 🏷️ Likely Rental
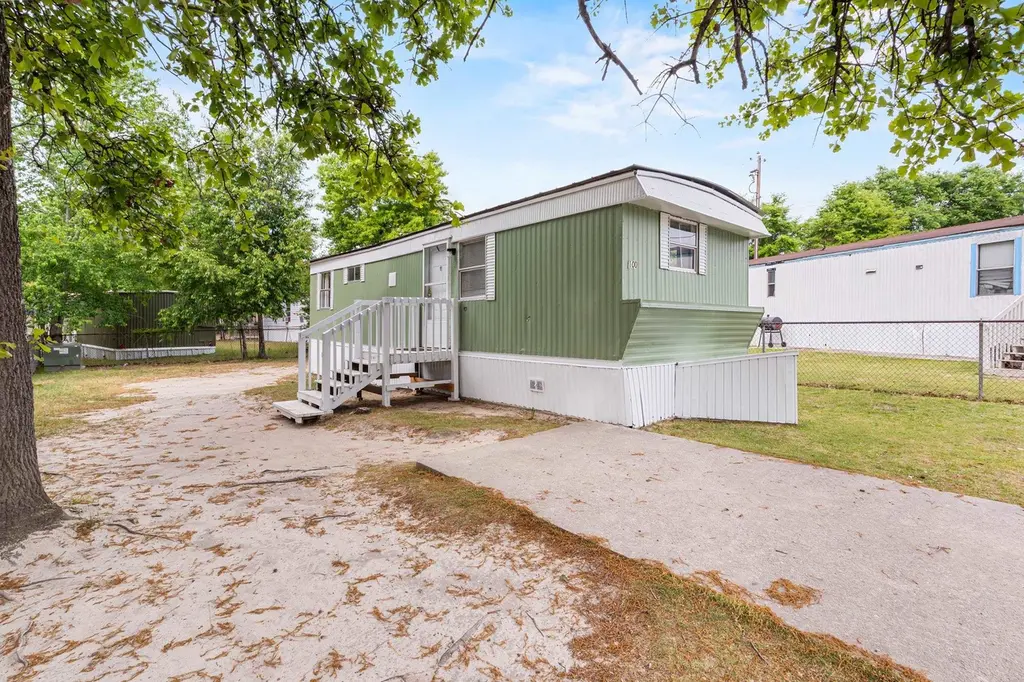
101 Lot 100 Dubbs Ave · Oak Grove, SC
Flood risk No data
- FEMA flood zone
- —
- Chance of flooding over 30 yrs
- —
- Est. flood insurance / yr
- —
Fire risk No data
- Est. fire insurance / yr
- —
Heat risk No data
- Hot days now (above threshold)
- —
- Hot days in 30 yrs
- —
Wind risk No data
- Chance of severe wind over 30 yrs
- —
Air-quality risk No data
- Unhealthy air days now
- —
- Unhealthy air days in 30 yrs
- —
Risk factors via First Street. Map © Google.
Why this score? — see what drove the C- grade
The composite is a weighted blend of 9 inputs, each scored 0–100. Each bar is that input's sub-score; the figure is the points it added to the 100-point composite (weight × sub-score).
- Cash flow +15.0/30.0
- ARV discount +15.0/15.0
- 1% rule +5.0/10.0
- DSCR +5.0/10.0
- Rent growth +3.4/5.0
- Livability +3.3/5.0
- Schools +2.9/10.0
- Condition / age +2.5/5.0
- Appreciation +0.0/10.0
$17,000
🖨 Deal sheet 📄 Offer letter ✓ Due diligence
Listing remarks
Just hit the market in Oak Grove Estates! This charming 2-bedroom, 1-bath home at 101 Dubbs Lot 100 in West Columbia offers just under 1,000 sq ft of beautiful living space designed with a sustainable, modern, affordable touch. From the welcoming layout to the comfortable bedrooms, gorgeous ceramic kitchen backsplash, and durable planking flooring throughout, this home is ready for you to move in and make it your own. Park is investor friendly, Pet Friendly, Kid Friendly! Great central location! Schedule your tour today — this one won’t last long! RENT TO OWN AVAILABLE. Call Agent for Details. Land does not convey with this home, it is located in a park on leased land. Now accep
Key facts
- Kid friendly
- Central location
- Investor friendly
Tags
Property features AI
Finance
- Financial info: Has land lease of $637 per month
- HOA & community: Association fees collected monthly
Exterior
- Parking: Driveway; 2 parking spaces (total)
- Home design: Single-wide manufactured/mobile home
- Exterior features: Single wide mobile home; Resale condition; Zoned property
Interior
- Bathrooms: 1 full bathroom
- Interior features: Furnished
Neighborhood map
What this means for you Summary
Snapshot
- This is a 2-bed/1.0-bath manufactured listed at $17k.
Deal economics
- At list price, monthly cash flow is $1k ($13k/yr) — positive.
- The deal already cash-flows at list — no discount required.
- Meets the 1% rule at list price ($2k rent vs $17k).
- Recommended offer: $16k (3.0% below list) — sets the bar for market timing.
Location & tenants
- Location reads 66/100 on livability (#114 in SC) — a middle-class / working-renter tenant base. Strengths: cost of living A+, housing A+, health & safety B; Watch: crime D, schools D-, amenities F.
- Lexington 02 (suburban): math 30% / reading 38% proficiency, ranked #45 of 80 in SC (top 56%) — families likely to look elsewhere, expect single-tenant / working-renter base with shorter leases.
- Market conditions: Rents rising (+3.5%/yr); 127 active listings in the ZIP; 4 comparable units currently listed for rent nearby; rentals leasing fast (median 11d on market — plan ~1-2 weeks tenant-placement turnaround); 1,712 units permitted in Lexington County in 2024 (0 in 5+ unit buildings).
- This rent runs 33% of the median local income ($57k/yr) — at the standard rent-burdened threshold; future hikes will face affordability resistance.
Forward outlook
- Local home prices are declining (-3.0%/yr); year-one equity from $118 of loan paydown is wiped out by about $510 of value loss. Plan a longer hold.
- Lexington County population projected at +26% by 2050 — long-run rental-demand tailwind backs the buy-and-hold thesis.
- At projected returns (-3.0% appreciation + 3.5% rent growth), your $5k cash investment doubles in ~1 year — after that, you're playing with house money.
Negotiation context
- It's been on market 38 days — a 3% lower offer ($16k) is reasonable based on typical stale-listing flexibility.
- 4 sale attempts; this cycle's ask has dropped $13k (43%) from the opening price — seller is motivated, your offer sets the floor, not the list.
Questions for the listing agent
- It's been on market 38 days. Have you received any prior offers? Is the seller open to a 3% concession, seller financing, or rate buy-down credit?
- Built in 1973 — when were the roof, HVAC, electrical panel, plumbing, and water heater last replaced?
- Is there a deadline driving the sale (1031 exchange, divorce, estate, relocation)? That informs how much negotiation room exists.
- Schools are D-rated, which usually means shorter tenancies and higher turnover. Who's the typical renter profile here, and what's been the actual vacancy rate?
- Crime grade is D in this area — have there been break-ins, vandalism, or insurance claims at this property in the last 3 years? What carrier currently insures it and at what premium?
- What's the average days-on-market for RENTAL listings here right now (not sales)? A rising rental-DOM trend means longer vacancies and softer asking-rent achievability than the comps imply.
- What's the recent tenant-quality profile in this submarket — average credit score on applications, eviction rate, late-payment / NSF rate, and stable-employment percentage? A property-management company in the area should have these aggregated.
- How much new for-sale + rental construction is in the pipeline within 1–3 miles? Heavy new supply typically softens prices + rents 12–24 months out; constrained supply supports both.
Investment metrics
- 1% rule
- 9.25% ✓
- Cap rate
- 85.65%
- Cash-on-cash
- 283.42%
- DSCR
- 13.61
- GRM
- 0.9
CMA / ARV
- ARV (on-the-fly)
- $25,480
- Comps found
- 1
Show comp detail 1 sale within ~0.75 mi
| Address | Dist | Beds/Ba | Sqft | Sold | Price | $/sf | Match |
|---|---|---|---|---|---|---|---|
| 10 Romell Rd | 0.19mi | 2/2.0 | 1,064 (+9%) | 10mo | $28,000 | $26 | 64 |
Match score weights: distance 35% · size 25% · config 20% · recency 20%. Top-matched comps best support the ARV.
Projected returns pro-forma
-3.0% appreciation · 3.48% rent growth · sell at horizon
- IRR
- —
- Equity multiple
- 15.63×
- Total profit
- $69,635
- Equity at exit
- $2,535
- IRR
- —
- Equity multiple
- 33.79×
- Total profit
- $156,095
- Equity at exit
- $1,470
Cash invested: $4,760 (down + closing). Projections, not guarantees.
Landlord ↔ Tenant lean methodology
- Overall (STATE)
- 90 Strongly Landlord-Friendly
- State South Carolina
- 90 Strongly Landlord-Friendly · R+6
- County
- — inherits STATE
- City
- — inherits STATE
ZIP-level market 29169
- Home prices YoY
- -15.8%
- Rents YoY
- 3.5%
- Active inventory
- 127
- Price-to-rent
- 0.9×
Monthly cashflow live
- Estimated rent
- $1,572 medium interval (Pro) →
- Mortgage (P&I)
- −$89
- Tax est. 1.5%
- −$21 /mo · $255/yr
- Insurance
- −$7
- HOA
- −$0
- Vacancy / Maint / Mgmt
- −$330
- Net cashflow
- $1,124
Break-even live
UW: 25.0% down · 7.5% · 30yr · 1.5% tax · 5.0% vac · 8.0% maint · 8.0% mgmt
Financing live
Cash to close
- Down payment
- $4,250
- Closing costs
- $510
- Reserves months
- —
- Total cash needed
- —
Loan-product check · same deal, 3 products live
Conventional
25% down · 7.5% · 30yr
- Down + closing
- —
- Monthly P&I
- —
- Monthly cashflow
- —
- DSCR
- —
- Eligible?
- —
Personal DTI + credit; lowest rate.
DSCR
20% down · 8.5% · 30yr
- Down + closing
- —
- Monthly P&I
- —
- Monthly cashflow
- —
- DSCR
- —
- Eligible?
- —
No personal income docs; deal must DSCR.
Hard money
10% down · 12.0% · 12mo
- Down + closing
- —
- Monthly P&I
- —
- Monthly cashflow
- —
- DSCR
- —
- Eligible?
- —
Short-term bridge; refi at stabilization.
Rent comps 4 comps
| Address | Beds | Baths | Sqft | Rent | $/sqft | DOM | Units | Dist |
|---|---|---|---|---|---|---|---|---|
| 2705 Leaphart Rd West Columbia, SC | 2.0 | 1.0–2.0 | 632 | $1,500 | $2.37 | 11d | 8 | 0.23mi |
| 604 Melton St West Columbia, SC | 1.0 | 1.0 | 1000 | $1,475 | $1.48 | 2d | 1 | 0.41mi |
| 200 # W Unit Woodberry Rd unit West Columbia, SC | 2.0 | 2.0 | 1000 | $1,300 | $1.30 | 2d | 1 | 1.07mi |
| 2720 Sunset Blvd West Columbia, SC | 1.0–3.0 | 1.0–2.0 | 1187 | $2,132 | $1.80 | 19d | 35 | 1.10mi |
Listing history 27 events
-
2026-06-18days on market $17,000 Active 38 DOM
-
2026-06-17days on market $17,000 Active 37 DOM
-
2026-06-16days on market $17,000 Active 36 DOM
-
2026-06-15days on market $17,000 Active 35 DOM
-
2026-06-14pricedays on market $17,000 Active 33 DOM
-
2026-06-13pricedays on market $18,000 Active 32 DOM
-
2026-06-10days on market $20,000 Active 30 DOM
-
2026-06-09days on market $20,000 Active 29 DOM
-
2026-06-08days on market $20,000 Active 28 DOM
-
2026-06-07pricedays on market $20,000 Active 27 DOM
-
2026-06-05days on market $25,000 Active 24 DOM
-
2026-05-31days on market $25,000 Active 19 DOM
-
2026-05-20price $25,000
-
2026-05-16price $28,000
-
2026-05-12$30,000 Active
-
2026-05-06status Active
-
2026-05-06historical
-
2026-04-28historical
-
2026-04-24historical Active Under Contract
-
2026-04-18price $25,500
-
2026-04-16price $30,500
-
2026-04-14$30,000 Active
-
2026-04-07price $30,000
-
2026-04-07price $25,000
-
2026-04-07historical
-
2026-03-17price $21,000
-
2026-03-14$22,000 Active
ⓘ Source: listings_history table (triggers on properties + properties_extension) + one-shot
backfill from property_details.listing_events for pre-trigger history.
Nearby sold comps map
Loading sold comps map…
Walkable amenities ~0.75 mi
Loading nearby amenities…
Taxation est. · year 1
- Rental income
- $18,862
- − Mortgage interest
- −$952
- − Property taxes
- −$255
- − Insurance
- −$85
- − Repairs & maintenance
- −$1,509
- − Management
- −$1,509
- − Depreciation
- −$495
- Taxable income
- $14,057
- Est. tax owed @ 24.0%
- −$3,374
- After-tax cash flow
- $10,117/yr
For passive investors: Depreciation is non-cash, so a rental often shows a tax loss while cash-flowing — sheltering income. Rental losses are passive: they offset passive income freely, and up to $25,000/yr can offset ordinary (W-2) income if you actively participate and your MAGI is under $100k (phasing out to $0 by $150k); unused losses carry forward. On sale, claimed depreciation is recaptured at up to 25%, and gains may owe capital-gains tax (a 1031 exchange can defer both). Figures are a year-1 estimate at your 24.0% rate — not tax advice; consult a CPA.
Schools (NCES district)
- District
- Lexington 02
- NCES district ID
- 4502730
- Math proficiency
- 30% ▼ -6.00%
- Reading proficiency
- 38% ▬ 0.00%
- Median HH income
- $42,532
- Composite
- 28.78/100
- National rank
- #6669
- State rank
- #45 of 80 in SC
Livability — Oak Grove
- Score
- 66/100
- State rank
- #114
- US rank
- #11681
Category grades
Schools grade is shown separately in the Schools card above.
Census & demographics
- Census place
- Oak Grove, SC
- County
- Lexington County · 232,571 people
- Metro
- Columbia, SC
- Population (ZIP)
- 21,647
- Household income
- $57,122
- Rent vs Own
- Severe rent burden
- 1172.0
Population outlook (Lexington County) Hauer SSP2
- Today (2025)
- 322,999 people
- By 2030
- 342,356 · +6.0%
- By 2040
- 377,715 · +16.9%
- By 2050
- 406,984 · +26.0%
- By 2075
- 465,447 · +44.1%
- By 2100
- 485,674 · +50.4%
Race, ethnicity, and origin ACS 2023
- Neighborhood character
- Predominantly White (66%)
- Race & ethnicity
- White 66% Black 16% Two or more races 11% Hispanic / Latino 10% Asian 3%
- Hispanic origin (detail)
- Mexican 6%
- Common ancestry
- Serbian 2% Italian 2% Lithuanian 2%
- Foreign-born
- 8% · Canada, China
- Languages at home
- 88% English-only · Spanish 8% Other Indo-European 1% Chinese 1%
Political lean MEDSL · Lexington
- 2024 margin
- Solid R (+33.5) · D 32.5% · R 66.0% · Other 1.4%
- 2008→2024 swing
- +4.6pp toward D · 2008: -38.0pp · 2024: -33.5pp
- All cycles
- 2024: R+33.5 2020: R+30.1 2016: R+36.7 2012: R+37.8 2008: R+38.0
Not yet ingested
- Civics
- —
Market trends
- HPI YoY
- ▼ -53.87%
- Current HPI
- 287.4791
- Rent YoY
- ▲ 3.48%
- Metro
- Columbia, SC
- State GDP YoY
- ▲ 4.51%
- F500 in state
- 2
Industry mix (Fortune 500 HQ in SC)
| Industry | F500 HQs | Revenue |
|---|---|---|
| Packaging | 1 | $7B |
|
||
Price history
+13.6% since first listed15 events — show timeline
- 2026-05-20 Price Changed $25,000 CCAR
- 2026-05-16 Price Changed $28,000 CCAR
- 2026-05-12 Listed $30,000 CCAR
- 2026-05-06 Relisted — CCAR
- 2026-05-06 Listing Removed — CCAR
- 2026-04-28 Listing Removed — CCAR
- 2026-04-24 Contingent — CCAR
- 2026-04-18 Price Changed $25,500 CCAR
- 2026-04-16 Price Changed $30,500 CCAR
- 2026-04-14 Listed $30,000 CCAR
- 2026-04-07 Listing Removed — CCAR
- 2026-04-07 Price Changed $25,000 CCAR
- 2026-04-07 Price Changed $30,000 CCAR
- 2026-03-17 Price Changed $21,000 CCAR
- 2026-03-14 Listed $22,000 CCAR
Cash-flow waterfall
monthlySold comps — $/sqft
last 12 mo · ≤1 miLoading sold comps…