 7-Plex
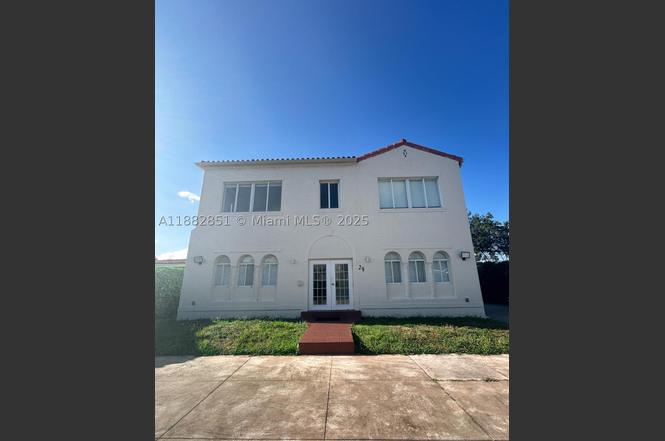
29 Oviedo Ave · Coral Gables, FL
Flood risk 1/10 · Minimal
- FEMA flood zone
- X (shaded)
- Chance of flooding over 30 yrs
- 0.0%
- Est. flood insurance / yr
- $507 – $1,088
Fire risk 1/10 · Minimal
- Est. fire insurance / yr
- $947 – $1,759
Heat risk 10/10 · Severe
- Hot days now (above 104°F)
- 7 days/yr
- Hot days in 30 yrs
- 29 days/yr
Wind risk 10/10 · Severe
- Chance of severe wind over 30 yrs
- 99.0%
Air-quality risk 2/10 · Minimal
- Unhealthy air days now
- 1 days/yr
- Unhealthy air days in 30 yrs
- 1 days/yr
Risk factors via First Street. Map © Google.
Why this score? — see what drove the C- grade
The composite is a weighted blend of 9 inputs, each scored 0–100. Each bar is that input's sub-score; the figure is the points it added to the 100-point composite (weight × sub-score).
- Cash flow +20.7/30.0
- ARV discount +7.5/15.0
- DSCR +6.6/10.0
- 1% rule +5.0/10.0
- Schools +4.2/10.0
- Livability +4.2/5.0
- Rent growth +2.7/5.0
- Condition / age +2.5/5.0
- Appreciation +0.0/10.0
$1,999,950
🖨 Deal sheet 📄 Offer letter ✓ Due diligence
Multi-family units
County records classify this as Multi-Family (2-4 Unit). Listing-text estimate: 7 units. estimate disagrees with records
Listing remarks MLS
Fabulous income property! This charming Old Spanish fourplex building offers superb location. Building renovated substantially when purchased, Unit #1 just remodeled again partially. Efficient floor plans can be used as 2/1 each, or 1/1 plus office/den, all identical. Great central location in Coral Gables, minutes from downtown, airport and major shopping/office areas. One unit is vacant so easily shown, the rest have been rented for long time, on a month to month now. Neutral tile flooring, newer appliances including inside washer/dryer in each unit. One parking space in open area, more parking on street.
Key facts
- Multifamily property
- In-unit washer
- Prime location
Tags
Property features AI
Finance
- Financial info: Multifamily property composed of multiple furnished 2-bedroom, 1-bath units with listed rents (examples: several units at $3,500; one unit at $2,600); Some or all units currently leased
Exterior
- Parking: Total of 4 parking spaces; Other parking types available
- Utilities: Public sewer; Cable available; Electric-powered heating and cooling
- Home design: 2-story building; Block construction; Resale property
- Construction: Block construction
- Exterior features: Less than quarter acre lot; Cable available
Interior
- Kitchen: Dishwasher; Microwave; Refrigerator
- Bedrooms: Multiple 2-bedroom units (various units described below)
- Bathrooms: Units with 1 full bathroom
- Heating & cooling: Central heating (electric); Central air conditioning (electric)
- Interior features: Smoke detectors; Furnished units
- Laundry & utility: Washer; Dryer; Solar hot water heater (leased in some units)
Neighborhood map
What this means for you Summary
Snapshot
- This is a 7 × 1-bed/?-bath units multifamily listed at $2.00M.
Deal economics
- At list price, monthly cash flow is $3k ($33k/yr) — positive. Per door: $387/mo.
- The deal already cash-flows at list — no discount required.
- To meet the 1% rule (rent ≥ 1% of price), the offer needs to be $1.99M (0.3% below list).
- Recommended offer: $1.76M (12.0% below list) — sets the bar for market timing.
- Cap rate 7.9% vs local median 0.6% in Coral Gables — top-decile yield for the area; either an underpriced asset or a hidden risk that comps aren't pricing in. Stress-test before assuming the spread holds.
Location & tenants
- Location reads 84/100 on livability (#31 in FL, #646 nationally) — a professional / high-income tenant draw. Strengths: schools A+, crime A+, commute A+; Watch: cost of living F.
- Miami-Dade (suburban): math 45% / reading 54% proficiency, ranked #40 of 73 in FL (top 55%) — families likely to look elsewhere, expect single-tenant / working-renter base with shorter leases; 64% free/reduced lunch — lower-income household profile, screen leases tightly.
- Market conditions: Rents flat; 304 active listings in the ZIP; 3 comparable units currently listed for rent nearby; rentals leasing fast (median 8d on market — plan ~1-2 weeks tenant-placement turnaround); solid renter incomes; 10,051 units permitted in Miami-Dade County in 2024 (7,758 in 5+ unit buildings).
- At $19,930/mo this rent would consume 240% of the median local household income ($100k/yr) (locally 1812% of renters already pay >50% of income on rent) — very limited rent-growth headroom before tenants either downsize or default.
Forward outlook
- Local home prices are declining (-3.0%/yr); year-one equity from $14k of loan paydown is wiped out by about $60k of value loss. Plan a longer hold.
- Miami-Dade County population projected at +28% by 2050 — long-run rental-demand tailwind backs the buy-and-hold thesis.
Negotiation context
- It's been on market 260 days — a 12% lower offer ($1.76M) is reasonable based on typical stale-listing flexibility.
- 2 sale attempts since 4y ago with the ask held roughly flat each time — persistent listings suggest the price (not the market) is what's stuck; bring a comps-based counter.
- Current owner paid $1.35M; 48% above their basis — modest negotiation headroom, anchor on the comps not their cost.
Risks & watch-outs
- Watch-outs: built in 1924 — expect roof / HVAC / electrical / plumbing capex.
- Climate carrying-cost: severe wind risk, 99% chance of damaging wind over 30y; extreme-heat days projected 7→29/yr by 2055 (HVAC capex compounding) — expect insurance premiums to compound above CPI over the hold.
Questions for the listing agent
- It's been on market 260 days. Have you received any prior offers? Is the seller open to a 12% concession, seller financing, or rate buy-down credit?
- Can we see the unit-by-unit rent roll, current vacancy, and any below-market leases? What's the average tenancy length?
- What capital expenditures (roof, boiler, parking lot, exteriors) have been made in the last 5 years, and what's planned in the next 2?
- Built in 1924 — when were the roof, HVAC, electrical panel, plumbing, and water heater last replaced?
- Why hasn't it sold? Are there any deal-killer items the seller is aware of (foundation, flood, title, zoning, code violations)?
- Is there a deadline driving the sale (1031 exchange, divorce, estate, relocation)? That informs how much negotiation room exists.
- Schools are A-rated — typically a magnet for longer-tenancy family renters. What's the average tenant stay here, and is there a school-zone premium baked into asking?
- What's the average days-on-market for RENTAL listings here right now (not sales)? A rising rental-DOM trend means longer vacancies and softer asking-rent achievability than the comps imply.
- What's the recent tenant-quality profile in this submarket — average credit score on applications, eviction rate, late-payment / NSF rate, and stable-employment percentage? A property-management company in the area should have these aggregated.
- How much new apartment / multifamily construction is in the pipeline within 1–3 miles? Heavy new supply (>2% of stock underway) typically softens rents 12–24 months out; light construction supports rent growth.
Investment metrics
- 1% rule
- 1.00% ✗
- Cap rate
- 7.92%
- Cash-on-cash
- 5.81%
- DSCR
- 1.26
- GRM
- 8.4
CMA / ARV
No comps found within radius.
Projected returns pro-forma
-3.0% appreciation · 0.92% rent growth · sell at horizon
- IRR
- -9.6%
- Equity multiple
- 0.66×
- Total profit
- $-192,388
- Equity at exit
- $298,199
- IRR
- -3.1%
- Equity multiple
- 0.81×
- Total profit
- $-106,673
- Equity at exit
- $172,919
Cash invested: $559,986 (down + closing). Projections, not guarantees.
Landlord ↔ Tenant lean methodology
- Overall (STATE)
- 87 Strongly Landlord-Friendly
- State Florida
- 87 Strongly Landlord-Friendly · R+3
- County
- — inherits STATE
- City
- — inherits STATE
ZIP-level market 33134
- Rents YoY
- 0.9%
- Active inventory
- 304
- Price-to-rent
- 58.5×
Monthly cashflow live
- Estimated rent
- $19,930 medium interval (Pro) →
- Mortgage (P&I)
- −$10,488
- Tax from tax record
- −$1,711 /mo · $20,535/yr
- Insurance
- −$833
- HOA
- −$0
- Vacancy / Maint / Mgmt
- −$4,185
- Net cashflow
- $2,712
Break-even live
7-unit breakdown (identical units grouped — click to expand)
| Units | Beds | Baths | Est. rent |
|---|---|---|---|
| 7× units | 1 | — | $19,929 |
| #1 | 1 | — | $2,847 |
| #2 | 1 | — | $2,847 |
| #3 | 1 | — | $2,847 |
| #4 | 1 | — | $2,847 |
| #5 | 1 | — | $2,847 |
| #6 | 1 | — | $2,847 |
| #7 | 1 | — | $2,847 |
| Total (7 units) | $19,930 | ||
UW: 25.0% down · 7.5% · 30yr · 1.5% tax · 5.0% vac · 8.0% maint · 8.0% mgmt
Financing live
Cash to close
- Down payment
- $499,988
- Closing costs
- $59,998
- Reserves months
- —
- Total cash needed
- —
Loan-product check · same deal, 3 products live
Conventional
25% down · 7.5% · 30yr
- Down + closing
- —
- Monthly P&I
- —
- Monthly cashflow
- —
- DSCR
- —
- Eligible?
- —
Personal DTI + credit; lowest rate.
DSCR
20% down · 8.5% · 30yr
- Down + closing
- —
- Monthly P&I
- —
- Monthly cashflow
- —
- DSCR
- —
- Eligible?
- —
No personal income docs; deal must DSCR.
Hard money
10% down · 12.0% · 12mo
- Down + closing
- —
- Monthly P&I
- —
- Monthly cashflow
- —
- DSCR
- —
- Eligible?
- —
Short-term bridge; refi at stabilization.
Rent comps 3 comps
| Address | Beds | Baths | Sqft | Rent | $/sqft | DOM | Units | Dist |
|---|---|---|---|---|---|---|---|---|
| 3905 SW 5th St Coral Gables, FL | 4.0 | 4.5 | 2998 | $20,000 | $6.67 | 24d | 1 | 0.28mi |
| 1710 SW 27th Ave Unit 1272101P Miami, FL | 1.0–5.0 | 1.0–4.0 | 1716 | $15,843 | $9.23 | 7d | 3 | 1.29mi |
| 2601 Salzedo St Coral Gables, FL | 2.0–3.0 | 2.5–4.5 | 2236 | $25,000 | $11.18 | 3d | 78 | 1.33mi |
Listing history 25 events
-
2026-06-18days on market $1,999,950 Active 260 DOM
-
2026-06-17days on market $1,999,950 Active 259 DOM
-
2026-06-16days on market $1,999,950 Active 258 DOM
-
2026-06-15days on market $1,999,950 Active 257 DOM
-
2026-06-13days on market $1,999,950 Active 255 DOM
-
2026-06-09days on market $1,999,950 Active 251 DOM
-
2026-06-08days on market $1,999,950 Active 250 DOM
-
2026-06-08days on market $1,999,950 Active 249 DOM
-
2026-06-04days on market $1,999,950 Active 246 DOM
-
2026-06-03days on market $1,999,950 Active 245 DOM
-
2026-06-02days on market $1,999,950 Active 244 DOM
-
2026-06-01days on market $1,999,950 Active 243 DOM
-
2026-05-31days on market $1,999,950 Active 242 DOM
-
2026-05-20price $1,999,950
-
2025-10-01$2,000,000 Active
-
2022-10-26soldstatus $1,350,000
-
2022-10-21soldstatus $1,350,000 Closed 614-char remark
Show marketing remark (614 chars)
Fabulous income property! This charming Old Spanish fourplex building offers superb location. Building renovated substantially when purchased, Unit #1 just remodeled again partially. Efficient floor plans can be used as 2/1 each, or 1/1 plus office/den, all identical. Great central location in Coral Gables, minutes from downtown, airport and major shopping/office areas. One unit is vacant so easily shown, the rest have been rented for long time, on a month to month now. Neutral tile flooring, newer appliances including inside washer/dryer in each unit. One parking space in open area, more parking on street.
-
2022-09-26status Pending 614-char remark
Show marketing remark (614 chars)
Fabulous income property! This charming Old Spanish fourplex building offers superb location. Building renovated substantially when purchased, Unit #1 just remodeled again partially. Efficient floor plans can be used as 2/1 each, or 1/1 plus office/den, all identical. Great central location in Coral Gables, minutes from downtown, airport and major shopping/office areas. One unit is vacant so easily shown, the rest have been rented for long time, on a month to month now. Neutral tile flooring, newer appliances including inside washer/dryer in each unit. One parking space in open area, more parking on street.
-
2022-09-07historical Active Under Contract 614-char remark
Show marketing remark (614 chars)
Fabulous income property! This charming Old Spanish fourplex building offers superb location. Building renovated substantially when purchased, Unit #1 just remodeled again partially. Efficient floor plans can be used as 2/1 each, or 1/1 plus office/den, all identical. Great central location in Coral Gables, minutes from downtown, airport and major shopping/office areas. One unit is vacant so easily shown, the rest have been rented for long time, on a month to month now. Neutral tile flooring, newer appliances including inside washer/dryer in each unit. One parking space in open area, more parking on street.
-
2022-08-23$1,375,000 Active 614-char remark
Show marketing remark (614 chars)
Fabulous income property! This charming Old Spanish fourplex building offers superb location. Building renovated substantially when purchased, Unit #1 just remodeled again partially. Efficient floor plans can be used as 2/1 each, or 1/1 plus office/den, all identical. Great central location in Coral Gables, minutes from downtown, airport and major shopping/office areas. One unit is vacant so easily shown, the rest have been rented for long time, on a month to month now. Neutral tile flooring, newer appliances including inside washer/dryer in each unit. One parking space in open area, more parking on street.
-
2011-04-15soldstatus $337,500 494-char remark
Show marketing remark (494 chars)
Bank-owned Old Spanish 2-story fourplex consists of four one bedroom + den apartments. Wood floors. Front and rear entry. No laundry on premises. Sold in 'AS IS' condition. Open, unmarked parking on site and additional street parking. Great central loca tion, just North of 8th Street between Ponce and Douglas Road, within walking distance to shops, restaurants, transportation and airport. Buyer responsible for a $250.00 closing fee to Selelr. Seller selects escrow, title and closing agent.
-
2005-10-20soldstatus $710,000
-
2000-08-31soldstatus $240,000
-
1995-12-26soldstatus $232,500
-
1992-07-21soldstatus $130,000
ⓘ Source: listings_history table (triggers on properties + properties_extension) + one-shot
backfill from property_details.listing_events for pre-trigger history.
Tax reassessment forecast FL · Resets to sale price
- Current annual tax
- $20,535 · $1,711/mo
- Projected year-2 tax
- $20,535 · $1,711/mo
- Expected delta
- $0/yr ($0/mo · 0.0%)
ⓘ Screening estimate from a state-policy table — verify with the county assessor before closing.
Climate risk First Street
- Flood 1/10 Low FEMA zone X (shaded) · 0% chance over 30 yrs
- Wildfire 1/10 Low
- Heat 10/10 Extreme 7 d/yr ≥104°F today · 29 d/yr by 30 yrs out
- Wind 10/10 Extreme 99% chance of damaging wind over 30 yrs
- Air quality 2/10 Low 1 unhealthy d/yr today · 1 by 30 yrs out
Nearby sold comps map
Loading sold comps map…
Walkable amenities ~0.75 mi
Loading nearby amenities…
Taxation est. · year 1
- Rental income
- $239,160
- − Mortgage interest
- −$112,028
- − Property taxes
- −$20,535
- − Insurance
- −$10,000
- − Repairs & maintenance
- −$19,133
- − Management
- −$19,133
- − Depreciation
- −$58,180
- Taxable income
- $151
- Est. tax owed @ 24.0%
- −$36
- After-tax cash flow
- $32,510/yr
For passive investors: Depreciation is non-cash, so a rental often shows a tax loss while cash-flowing — sheltering income. Rental losses are passive: they offset passive income freely, and up to $25,000/yr can offset ordinary (W-2) income if you actively participate and your MAGI is under $100k (phasing out to $0 by $150k); unused losses carry forward. On sale, claimed depreciation is recaptured at up to 25%, and gains may owe capital-gains tax (a 1031 exchange can defer both). Figures are a year-1 estimate at your 24.0% rate — not tax advice; consult a CPA.
Schools (NCES district)
- District
- Miami-Dade
- NCES district ID
- 1200390
- Math proficiency
- 45% ▼ -16.00%
- Reading proficiency
- 54% ▼ -5.00%
- Median HH income
- $43,928
- Composite
- 41.76/100
- National rank
- #3397
- State rank
- #40 of 73 in FL
Livability — Coral Gables
- Score
- 84/100
- State rank
- #31
- US rank
- #646
Category grades
Schools grade is shown separately in the Schools card above.
Census & demographics
- Census place
- Coral Gables, FL
- County
- Miami-Dade County · 2,697,751 people
- City population
- 57,226
- Metro
- Miami-Fort Lauderdale-Pompano Beach, FL
- Population (ZIP)
- 38,174
- Household income
- $99,766
- Rent vs Own
- Severe rent burden
- 1812.0
Population outlook (Miami-Dade County) Hauer SSP2
- Today (2025)
- 3,126,439 people
- By 2030
- 3,325,765 · +6.4%
- By 2040
- 3,697,561 · +18.3%
- By 2050
- 4,012,134 · +28.3%
- By 2075
- 4,605,612 · +47.3%
- By 2100
- 4,866,598 · +55.7%
Race, ethnicity, and origin ACS 2023
- Neighborhood character
- Predominantly Hispanic (75%)
- Race & ethnicity
- Hispanic / Latino 75% Two or more races 45% White 21% Asian 1%
- Hispanic origin (detail)
- Mexican 3% Puerto Rican 2% Cuban 41% Dominican 1% Salvadoran 2%
- Common ancestry
- Lithuanian 2% Russian 2% Romanian 1%
- Foreign-born
- 55% · Canada, Jamaica, Dominican Republic
- Languages at home
- 22% English-only · Spanish 71% Other Indo-European 4% French/Haitian/Cajun 1%
Political lean MEDSL · Miami-Dade
- 2024 margin
- R (+11.4) · D 43.9% · R 55.4%
- 2008→2024 swing
- -27.6pp toward R · 2008: 16.1pp · 2024: -11.4pp
- All cycles
- 2024: R+11.4 2020: D+7.3 2016: D+29.6 2012: D+23.7 2008: D+16.1
Not yet ingested
- Civics
- —
Market trends
- HPI YoY
- ▼ -1014.50%
- Current HPI
- 402.6405
- Rent YoY
- ▲ 0.92%
- Metro
- Miami-Fort Lauderdale-Pompano Beach, FL
- State GDP YoY
- ▲ 3.28%
- F500 in state
- 36
Industry mix (Fortune 500 HQ in FL)
| Industry | F500 HQs | Revenue |
|---|---|---|
| Industrial Technology | 2 | $29B |
|
||
| Insurance | 2 | $17B |
|
||
| Retail | 1 | $60B |
|
||
| Technology Distribution | 1 | $58B |
|
||
| Homebuilding | 1 | $35B |
|
||
| Technology Manufacturing | 1 | $35B |
|
||
Price history
+1438.4% since first listed12 events — show timeline
- 2026-05-20 Price Changed $1,999,950 MARMLS
- 2025-10-01 Listed $2,000,000 MARMLS
- 2022-10-26 Sold (Public Records) $1,350,000 Public Records
- 2022-10-21 Sold (MLS) $1,350,000 MARMLS
- 2022-09-26 Pending — MARMLS
- 2022-09-07 Contingent — MARMLS
- 2022-08-23 Listed $1,375,000 MARMLS
- 2011-04-15 Sold (MLS) $337,500 MARMLS
- 2005-10-20 Sold (Public Records) $710,000 Public Records
- 2000-08-31 Sold (Public Records) $240,000 Public Records
- 1995-12-26 Sold (Public Records) $232,500 Public Records
- 1992-07-21 Sold (Public Records) $130,000 Public Records
Property tax history
+8.5%/yrLatest (2025): $20,535 · +0.0% YoY. Source: county tax records.
Cash-flow waterfall
monthlySold comps — $/sqft
last 12 mo · ≤1 miLoading sold comps…