 🌊 Lakefront
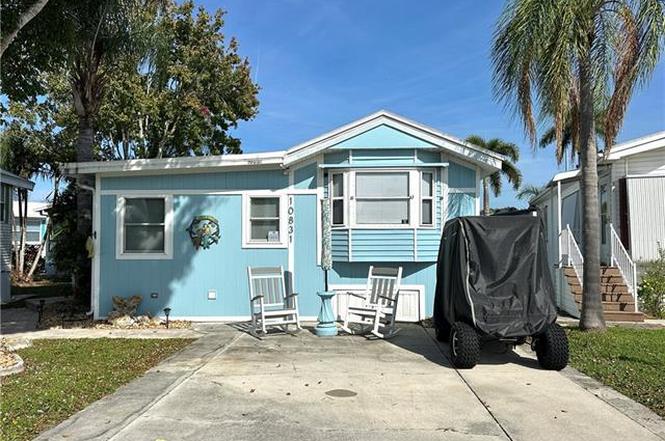
10831 Vireo Cir · Estero, FL
Flood risk 4/10 · Minor
- FEMA flood zone
- AH
- Chance of flooding over 30 yrs
- 0.13%
- Est. flood insurance / yr
- $1,142 – $2,507
Fire risk 5/10 · Moderate
- Est. fire insurance / yr
- $947 – $1,759
Heat risk 9/10 · Severe
- Hot days now (above 107°F)
- 6 days/yr
- Hot days in 30 yrs
- 26 days/yr
Wind risk 10/10 · Severe
- Chance of severe wind over 30 yrs
- 99.0%
Air-quality risk 3/10 · Minor
- Unhealthy air days now
- 2 days/yr
- Unhealthy air days in 30 yrs
- 2 days/yr
Risk factors via First Street. Map © Google.
Why this score? — see what drove the C+ grade
The composite is a weighted blend of 9 inputs, each scored 0–100. Each bar is that input's sub-score; the figure is the points it added to the 100-point composite (weight × sub-score).
- Cash flow +20.7/30.0
- ARV discount +15.0/15.0
- 1% rule +6.9/10.0
- DSCR +6.6/10.0
- Schools +4.1/10.0
- Livability +4.0/5.0
- Condition / age +2.5/5.0
- Rent growth +2.1/5.0
- Appreciation +0.0/10.0
$155,000
🖨 Deal sheet (PDF) 📄 Offer letter ✓ Due diligence
Listing remarks
Charming Manufactured Home in Corkscrew Woodlands. Welcome to this stunning, completely renovated manufactured home located in the highly desirable Corkscrew Woodlands, an active 55+ community. This beautiful residence features two bedrooms and one and a half baths, offering comfortable living in a serene environment with breathtaking lake view. Nestled within the outer circle of the community, this home boasts a lovely patio, perfect for enjoying morning coffee or evening sunsets over the lake. The expansive living room impresses with custom wood beams on the ceiling and modern LED lighting, creating a bright and inviting atmosphere. Meticulously renovated by its owners, the home showcases
Key facts
- Lake view
- Modern led lighting
- Custom wood beams
Tags
Property features AI
Finance
- Other: Community type: Mobile/Manufactured; Subdivision: Corkscrew Woodlands; Zoning code: RV; Lot is regular and approximately 0.058 acres; Restrictions: Architectural, deeded, limited number vehicles, no commercial
- HOA & community: Mandatory HOA with quarterly fee; Quarterly HOA fee of $771 (total annual recurring fees $3,084); On-site management; HOA maintenance includes cable, irrigation water, laundry facilities, lawn/land maintenance, legal/accounting, manager, recreation facilities, reserve, sewer, street lights, street maintenance, trash removal, water; Community amenities: clubhouse, community pool, community spa/hot tub, exercise room, billiards, bocce court, pickleball, tennis court, shuffleboard, BBQ/picnic area, common laundry, extra storage, internet access, sidewalks, streetlights
Exterior
- Utilities: Central water; Central sewer; Cable available
- Home design: Manufactured residential home; Single-story; Rear exposure facing north
- Construction: Built in 1988; Vinyl siding exterior; Shingle roof; Manufactured building design
- Exterior features: Patio; Lake view / waterfront (lake); Private road
Interior
- Kitchen: Island; Breakfast bar; Dishwasher; Range; Microwave; Refrigerator/Freezer
- Bedrooms: 2 bedrooms; Split bedroom floor plan
- Flooring: Laminate
- Bathrooms: 1 full bathroom; 1 half bathroom; Master bath with shower only
- Heating & cooling: Central electric heat; Central electric cooling; Ceiling fans
- Interior features: Cable prewire; Vaulted ceiling; Turnkey
- Laundry & utility: Laundry in residence; Washer; Dryer
Neighborhood map
What this means for you Summary
Snapshot
- This is a 1-bed/1.0-bath manufactured listed at $155k.
Deal economics
- At list price, monthly cash flow is $57 ($678/yr) — positive.
- The deal already cash-flows at list — no discount required.
- Meets the 1% rule at list price ($2k rent vs $155k).
- Recommended offer: $136k (12.0% below list) — sets the bar for market timing.
- Cap rate 7.9% vs local median 3.4% in Estero — top-decile yield for the area; either an underpriced asset or a hidden risk that comps aren't pricing in. Stress-test before assuming the spread holds.
Location & tenants
- Location reads 79/100 on livability (#149 in FL, #2,242 nationally) — a middle-class / working-renter tenant base. Strengths: crime A+, employment A+, housing A+; Watch: amenities F, commute F, cost of living D-.
- Lee (suburban): math 47% / reading 50% proficiency, ranked #42 of 73 in FL (top 58%) — families likely to look elsewhere, expect single-tenant / working-renter base with shorter leases.
- Zoned schools: Pinewoods Elementary School (math 81% / reading 74%, grade A, #163 of 2,144 statewide, top 8%, 1,089 students, 25% FRL); Lexington Middle School (math 55% / reading 54%, grade B-, #183 of 571 statewide, top 34%, 1,138 students, 44% FRL); South Fort Myers High School (math 23% / reading 30%, grade F, #489 of 667 statewide, top 74%, 1,917 students, 50% FRL) — zoned schools average 39% FRL vs 57% district-wide (18 pts lower); this property's tenant base skews higher-income than the district average.
- Market conditions: Rents soft (-1.4%/yr); 674 active listings in the ZIP; 8 comparable units currently listed for rent nearby; rentals at typical pace (median 16d on market — plan ~3-4 weeks tenant-placement turnaround); solid renter incomes; 15,411 units permitted in Lee County in 2024 (4,686 in 5+ unit buildings).
Forward outlook
- Local home prices are declining (-3.0%/yr); year-one equity from $1k of loan paydown is wiped out by about $5k of value loss. Plan a longer hold.
- Lee County population projected at +44% by 2050 — long-run rental-demand tailwind backs the buy-and-hold thesis.
Negotiation context
- It's been on market 198 days — a 12% lower offer ($136k) is reasonable based on typical stale-listing flexibility.
- Current owner paid $100k; list at $155k implies a 55% gain — meaningful room to come down on a strong offer.
Risks & watch-outs
- Watch-outs: flood insurance adds $152/mo.
- Climate carrying-cost: in FEMA flood zone AH (mandatory federal flood insurance); severe wind risk, 99% chance of damaging wind over 30y; moderate wildfire risk; extreme-heat days projected 6→26/yr by 2055 (HVAC capex compounding) — expect insurance premiums to compound above CPI over the hold.
Questions for the listing agent
- It's been on market 198 days. Have you received any prior offers? Is the seller open to a 12% concession, seller financing, or rate buy-down credit?
- What's the actual annual flood-insurance premium (NFIP or private), and is the property in a SFHA with mandatory coverage?
- What does the HOA fee cover, when was the last increase, and are there any pending special assessments or reserve-fund shortfalls?
- Why hasn't it sold? Are there any deal-killer items the seller is aware of (foundation, flood, title, zoning, code violations)?
- Is there a deadline driving the sale (1031 exchange, divorce, estate, relocation)? That informs how much negotiation room exists.
- Schools are A-rated — typically a magnet for longer-tenancy family renters. What's the average tenant stay here, and is there a school-zone premium baked into asking?
- This sits on a lake — are riparian / water-frontage rights deeded with the parcel? Any dock permits, shoreline easements, or HOA water-use restrictions?
- What's the documented flood / surge / shoreline-erosion history here (FEMA AND non-FEMA — e.g., storm surge, creek backup, septic-field saturation)?
- Any water-quality or seasonal algae-bloom issues that affect tenant satisfaction or short-term-rental demand?
- What's the average days-on-market for RENTAL listings here right now (not sales)? A rising rental-DOM trend means longer vacancies and softer asking-rent achievability than the comps imply.
- What's the recent tenant-quality profile in this submarket — average credit score on applications, eviction rate, late-payment / NSF rate, and stable-employment percentage? A property-management company in the area should have these aggregated.
- How much new for-sale + rental construction is in the pipeline within 1–3 miles? Heavy new supply typically softens prices + rents 12–24 months out; constrained supply supports both.
Investment metrics
- 1% rule
- 1.19% ✓
- Cap rate
- 7.91%
- Cash-on-cash
- 5.77%
- DSCR
- 1.26
- GRM
- 7.0
CMA / ARV
- ARV (on-the-fly)
- $211,953
- Comps found
- 4
Show comp detail 4 sales within ~0.75 mi
| Address | Dist | Beds/Ba | Sqft | Sold | Price | $/sf | Match |
|---|---|---|---|---|---|---|---|
| 10840 Bonapartes Gull | 0.16mi | 2/1.0 (+1) | 782 (-5%) | 13mo | $90,000 | $115 | 69 |
| 10713 Roseate Spoonbill Cir | 0.19mi | 1/1.0 | 702 (-15%) | 9mo | $135,000 | $192 | 60 |
| 10809 White Wood Stork Cir #5 | 0.24mi | 2/1.0 (+1) | 918 (+12%) | 16mo | $175,000 | $191 | 51 |
| 10903 Peregrine Falcon Cir | 0.50mi | 2/2.0 (+1) | 903 (+10%) | 11mo | $165,000 | $183 | 42 |
Match score weights: distance 35% · size 25% · config 20% · recency 20%. Top-matched comps best support the ARV.
Projected returns pro-forma
-3.0% appreciation · 0.0% rent growth · sell at horizon
- IRR
- -18.1%
- Equity multiple
- 0.39×
- Total profit
- $-26,681
- Equity at exit
- $23,111
- IRR
- -20.6%
- Equity multiple
- 0.11×
- Total profit
- $-38,512
- Equity at exit
- $13,402
Cash invested: $43,400 (down + closing). Projections, not guarantees.
Landlord ↔ Tenant lean methodology
- Overall (STATE)
- 87 Strongly Landlord-Friendly
- State Florida
- 87 Strongly Landlord-Friendly · R+3
- County
- — inherits STATE
- City
- — inherits STATE
ZIP-level market 33928
- Rents YoY
- -1.4%
- Active inventory
- 674
- Price-to-rent
- 7.0×
Monthly cashflow live
- Estimated rent
- $1,840 high interval (Pro) →
- Mortgage (P&I)
- −$813
- Tax from tax record
- −$111 /mo · $1,329/yr
- Insurance
- −$65
- Flood insurance flood zone
- −$152 /mo · $1,824/yr
- HOA
- −$257
- Vacancy / Maint / Mgmt
- −$386
- Net cashflow
- $57
Break-even live
Sensitivity live
| Price | -10% $144 | -5% $100 | +0% $57 | +5% $13 | +10% $-31 |
|---|---|---|---|---|---|
| Rent | -10% $-89 | -5% $-16 | +0% $57 | +5% $129 | +10% $202 |
| Rate | -1.0pp $135 | -0.5pp $96 | base $57 | +0.5pp $16 | +1.0pp $-24 |
UW: 25.0% down · 7.5% · 30yr · 1.5% tax · 5.0% vac · 8.0% maint · 8.0% mgmt
Financing live
Cash to close
- Down payment
- $38,750
- Closing costs
- $4,650
- Reserves months
- —
- Total cash needed
- —
Loan-product check · same deal, 3 products live
Conventional
25% down · 7.5% · 30yr
- Down + closing
- —
- Monthly P&I
- —
- Monthly cashflow
- —
- DSCR
- —
- Eligible?
- —
Personal DTI + credit; lowest rate.
DSCR
20% down · 8.5% · 30yr
- Down + closing
- —
- Monthly P&I
- —
- Monthly cashflow
- —
- DSCR
- —
- Eligible?
- —
No personal income docs; deal must DSCR.
Hard money
10% down · 12.0% · 12mo
- Down + closing
- —
- Monthly P&I
- —
- Monthly cashflow
- —
- DSCR
- —
- Eligible?
- —
Short-term bridge; refi at stabilization.
Rent comps 8 comps
| Address | Beds | Baths | Sqft | Rent | $/sqft | DOM | Units | Dist |
|---|---|---|---|---|---|---|---|---|
| 10952 Snowy Egret Cir Estero, FL | 2.0 | 1.5 | 772 | $1,450 | $1.88 | 16d | 1 | 0.19mi |
| 10952 Snowy Egret Cir Estero, FL | 2.0 | 1.5 | 772 | $1,450 | $1.88 | 16d | 1 | 0.19mi |
| 10710 San Tropez Cir Estero, FL | 2.0 | 2.0 | 981 | $2,500 | $2.55 | 4d | 1 | 0.28mi |
| 21301 S Branch Blvd Estero, FL | 1.0–3.0 | 1.0–2.0 | 1510 | $1,833 | $1.21 | 4d | 12 | 0.52mi |
| 10445 Corkscrew Commons Dr Estero, FL | 1.0–2.0 | 1.0–2.0 | 1031 | $1,545 | $1.50 | 4d | 17 | 0.62mi |
| 19520 Highland Oaks Dr Estero, FL | 3.0 | 1.0–2.0 | 977 | $1,863 | $1.91 | 4d | 18 | 1.05mi |
| 10110 Villagio Palms Way #107 Estero, FL | 2.0 | 2.0 | 1048 | $2,050 | $1.96 | 23d | 1 | 1.33mi |
| 20321 Estero Gardens Cir Estero, FL | 2.0–3.0 | 1.5–2.0 | 1423 | $2,000 | $1.41 | 25d | 3 | 1.47mi |
HOA detail
- Monthly dues
- $257 · $3,084/yr
Listing history 14 events
-
2026-06-22days on market $155,000 Active 198 DOM
-
2026-06-17days on market $155,000 Active 194 DOM
-
2026-06-16days on market $155,000 Active 193 DOM
-
2026-06-15days on market $155,000 Active 192 DOM
-
2026-06-13days on market $155,000 Active 190 DOM
-
2026-06-09days on market $155,000 Active 186 DOM
-
2026-06-07days on market $155,000 Active 184 DOM
-
2026-06-02days on market $155,000 Active 179 DOM
-
2026-06-01days on market $155,000 Active 178 DOM
-
2026-06-01days on market $155,000 Active 177 DOM
-
2026-02-04price $155,000
-
2025-12-05$165,000 Active
-
2023-05-02soldstatus $100,000
-
2003-07-21soldstatus $56,000
ⓘ Source: listings_history table (triggers on properties + properties_extension) + one-shot
backfill from property_details.listing_events for pre-trigger history.
Tax reassessment forecast FL · Resets to sale price
- Current annual tax
- $1,329 · $111/mo
- Projected year-2 tax
- $1,329 · $111/mo
- Expected delta
- $0/yr ($0/mo · 0.0%)
ⓘ Screening estimate from a state-policy table — verify with the county assessor before closing.
Climate risk First Street
- Flood 4/10 Moderate FEMA zone AH · 13% chance over 30 yrs
- Wildfire 5/10 Major
- Heat 9/10 Extreme 6 d/yr ≥107°F today · 26 d/yr by 30 yrs out
- Wind 10/10 Extreme 99% chance of damaging wind over 30 yrs
- Air quality 3/10 Moderate 2 unhealthy d/yr today · 2 by 30 yrs out
Nearby sold comps map
Loading sold comps map…
Walkable amenities ~0.75 mi
Loading nearby amenities…
Taxation est. · year 1
- Rental income
- $22,083
- − Mortgage interest
- −$8,682
- − Property taxes
- −$1,329
- − Insurance
- −$2,600
- − Repairs & maintenance
- −$1,767
- − Management
- −$1,767
- − HOA
- −$3,084
- − Depreciation
- −$4,509
- Taxable loss
- −$1,655
- Est. tax savings @ 24.0%
- +$397
- After-tax cash flow
- $1,076/yr
For passive investors: Depreciation is non-cash, so a rental often shows a tax loss while cash-flowing — sheltering income. Rental losses are passive: they offset passive income freely, and up to $25,000/yr can offset ordinary (W-2) income if you actively participate and your MAGI is under $100k (phasing out to $0 by $150k); unused losses carry forward. On sale, claimed depreciation is recaptured at up to 25%, and gains may owe capital-gains tax (a 1031 exchange can defer both). Figures are a year-1 estimate at your 24.0% rate — not tax advice; consult a CPA.
Schools (NCES district)
- District
- Lee
- NCES district ID
- 1201080
- Math proficiency
- 47% ▼ -11.00%
- Reading proficiency
- 50% ▼ -4.00%
- Median HH income
- $49,518
- Composite
- 41.49/100
- National rank
- #3458
- State rank
- #42 of 73 in FL
Livability — Estero
- Score
- 79/100
- State rank
- #149
- US rank
- #2242
Category grades
Schools grade is shown separately in the Schools card above.
Census & demographics
- Census place
- Estero, FL
- County
- Lee County · 788,662 people
- City population
- 31,926
- Metro
- Cape Coral-Fort Myers, FL
- Population (ZIP)
- 31,926
- Household income
- $102,624
- Rent vs Own
- Severe rent burden
- 606.0
Population outlook (Lee County) Hauer SSP2
- Today (2025)
- 871,946 people
- By 2030
- 955,468 · +9.6%
- By 2040
- 1,113,587 · +27.7%
- By 2050
- 1,256,891 · +44.1%
- By 2075
- 1,560,270 · +78.9%
- By 2100
- 1,726,848 · +98.0%
Race, ethnicity, and origin ACS 2023
- Neighborhood character
- Predominantly White (85%)
- Race & ethnicity
- White 85% Hispanic / Latino 8% Two or more races 7% Asian 3% Black 1%
- Hispanic origin (detail)
- Mexican 2% Puerto Rican 2% Cuban 1%
- Common ancestry
- Romanian 5% Lithuanian 3% Slovak 2%
- Foreign-born
- 11% · Canada, China, Jamaica
- Languages at home
- 90% English-only · Spanish 5% Other Indo-European 1% French/Haitian/Cajun 1%
Political lean MEDSL · Lee
- 2024 margin
- Strong R (+28.4) · D 35.5% · R 63.9%
- 2008→2024 swing
- -18.0pp toward R · 2008: -10.4pp · 2024: -28.4pp
- All cycles
- 2024: R+28.4 2020: R+19.2 2016: R+20.4 2012: R+16.6 2008: R+10.4
Not yet ingested
- Civics
- —
Market trends
- HPI YoY
- ▼ -109.49%
- Current HPI
- 197.5913
- Rent YoY
- ▼ -1.42%
- Metro
- Cape Coral-Fort Myers, FL
- State GDP YoY
- ▲ 3.28%
- F500 in state
- 36
Industry mix (Fortune 500 HQ in FL)
| Industry | F500 HQs | Revenue |
|---|---|---|
| Industrial Technology | 2 | $29B |
|
||
| Insurance | 2 | $17B |
|
||
| Retail | 1 | $60B |
|
||
| Technology Distribution | 1 | $58B |
|
||
| Homebuilding | 1 | $35B |
|
||
| Technology Manufacturing | 1 | $35B |
|
||
Price history
+176.8% since first listed4 events — show timeline
- 2026-02-04 Price Changed $155,000 BEARMLS
- 2025-12-05 Listed $165,000 BEARMLS
- 2023-05-02 Sold (Public Records) $100,000 Public Records
- 2003-07-21 Sold (Public Records) $56,000 Public Records
Property tax history
+11.5%/yrLatest (2025): $1,329 · -26.1% YoY. Source: county tax records.
Cash-flow waterfall
monthlySold comps — $/sqft
last 12 mo · ≤1 miLoading sold comps…