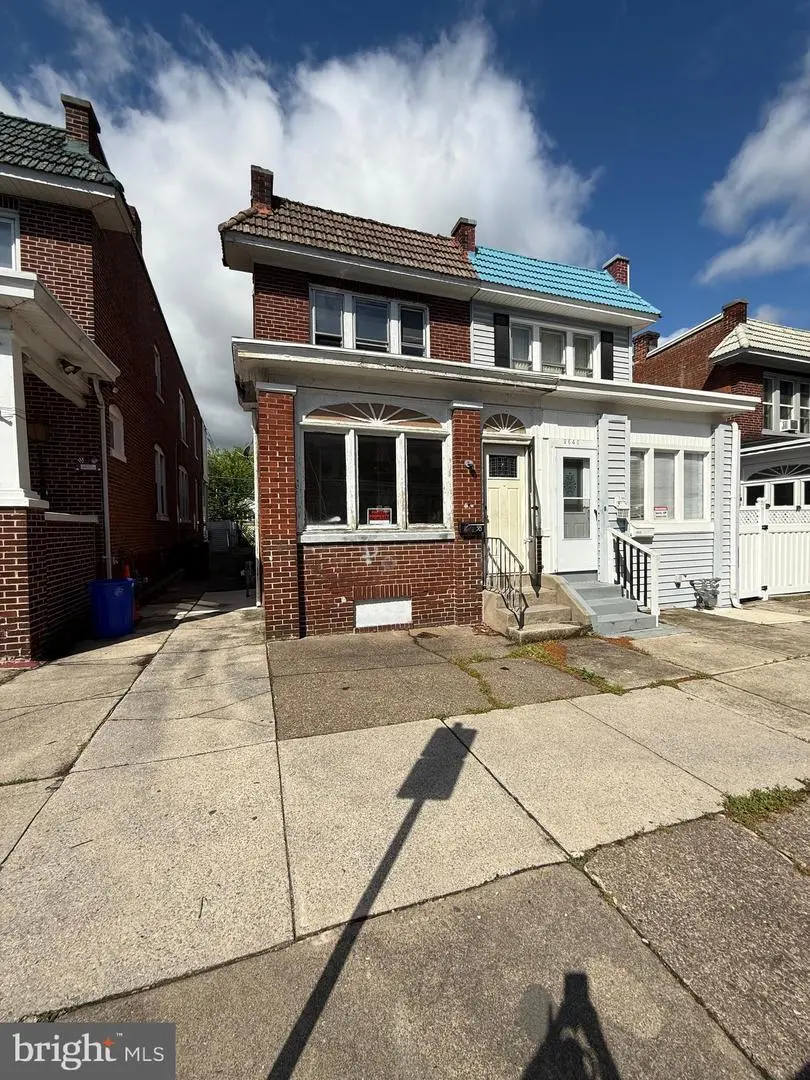
2638 Lexington St · Harrisburg, PA
Flood risk 1/10 · Minimal
- FEMA flood zone
- X (unshaded)
- Chance of flooding over 30 yrs
- 0.0%
- Est. flood insurance / yr
- $473 – $860
Fire risk 1/10 · Minimal
- Est. fire insurance / yr
- $511 – $949
Heat risk 6/10 · Moderate
- Hot days now (above 101°F)
- 7 days/yr
- Hot days in 30 yrs
- 15 days/yr
Wind risk 3/10 · Minor
- Chance of severe wind over 30 yrs
- 5.0%
Air-quality risk 2/10 · Minimal
- Unhealthy air days now
- 1 days/yr
- Unhealthy air days in 30 yrs
- 3 days/yr
Risk factors via First Street. Map © Google.
Why this score? — see what drove the B- grade
The composite is a weighted blend of 9 inputs, each scored 0–100. Each bar is that input's sub-score; the figure is the points it added to the 100-point composite (weight × sub-score).
- Cash flow +30.0/30.0
- 1% rule +10.0/10.0
- DSCR +10.0/10.0
- ARV discount +7.9/15.0
- Livability +4.2/5.0
- Rent growth +2.9/5.0
- Condition / age +2.5/5.0
- Schools +0.8/10.0
- Appreciation +0.0/10.0
$98,500
🖨 Deal sheet 📄 Offer letter ✓ Due diligence
Listing remarks
Investment opportunity in Harrisburg! This duplex at 2638 Lexington Street offers great potential for investors or buyers looking to renovate and build equity. The home features three bedrooms and one full bath, along with a spacious living room and a separate dining room. Enjoy the enclosed front porch and a fenced-in backyard. Conveniently located within walking distance to Camp Curtin Middle School and Italian Lake, this property is ideally situated near local amenities. Please note: The home is being sold strictly as-is and requires significant repairs. Exercise caution when touring the property.
Key facts
- Fenced-in backyard
- Enclosed front porch
- Near local amenities
Tags
Property features AI
Finance
- Other: Ownership is fee simple; Assessed values and tax details available (financial specifics excluded)
Exterior
- Parking: On-street parking
- Utilities: Public water; Public sewer
- Home design: Semi-detached structure
- Construction: Brick construction; Stone foundation; Above-grade and below-grade structures; Built year source: Assessor
- Exterior features: Porch(es) and deck(s)
Interior
- Kitchen: Kitchen (appliance details not provided)
- Bedrooms: Three bedrooms on the first upper level (total 3 bedrooms)
- Bathrooms: One full bathroom (on upper level)
- Heating & cooling: Radiator heating; Natural gas for heating and hot water; 100 Amp electric service
- Interior features: 6 total rooms; Living room and dining room; Basement with interior access and outside entrance; Basement is unfinished; Not in a federal flood zone
- Laundry & utility: Laundry in the basement
Neighborhood map
What this means for you Summary
Snapshot
- This is a 3-bed/1.0-bath townhouse listed at $98k.
Deal economics
- At list price, monthly cash flow is $563 ($7k/yr) — positive.
- The deal already cash-flows at list — no discount required.
- Meets the 1% rule at list price ($2k rent vs $98k).
- Recommended offer: $96k (3.0% below list) — sets the bar for market timing.
- Cap rate 13.1% vs local median 6.6% in Harrisburg — top-decile yield for the area; either an underpriced asset or a hidden risk that comps aren't pricing in. Stress-test before assuming the spread holds.
Location & tenants
- Location reads 84/100 on livability (#107 in PA, #826 nationally) — a professional / high-income tenant draw. Strengths: amenities A+, commute A+, cost of living A+; Watch: employment D, crime F.
- Harrisburg City SD (urban): math 6% / reading 13% proficiency, ranked #535 of 539 in PA (top 99%) — low school quality limits family demand, transient renter base, plan for 1-2y turnover; 82% free/reduced lunch — lower-income household profile, screen leases tightly.
- Zoned schools: Harrisburg Hs (math 24% / reading 10%, grade F, #399 of 437 statewide, top 92%, 1,230 students, 100% FRL) — zoned schools average 100% FRL vs 82% district-wide (18 pts higher); higher-poverty schools than district average — tighter screening recommended.
- Market conditions: Rents rising (+1.6%/yr); 170 active listings in the ZIP; 31 comparable units currently listed for rent nearby; rentals lingering (median 44d on market — plan ~5-8 weeks vacancy on turnover, expect pricing pressure); 55% of comp listings sitting > 30 days — soft ceiling on asking rent; solid renter incomes; 540 units permitted in Dauphin County in 2024 (194 in 5+ unit buildings).
Forward outlook
- Local home prices are declining (-3.0%/yr); year-one equity from $681 of loan paydown is wiped out by about $3k of value loss. Plan a longer hold.
- At projected returns (-3.0% appreciation + 1.6% rent growth), your $28k cash investment doubles in ~6 years — after that, you're playing with house money.
Negotiation context
- It's been on market 33 days — a 3% lower offer ($96k) is reasonable based on typical stale-listing flexibility.
- 6 sale attempts with the ask held roughly flat each time — persistent listings suggest the price (not the market) is what's stuck; bring a comps-based counter.
- Current owner paid $65k; list at $98k implies a 52% gain — meaningful room to come down on a strong offer.
Risks & watch-outs
- Watch-outs: built in 1926 — expect roof / HVAC / electrical / plumbing capex.
- Climate carrying-cost: extreme-heat days projected 7→15/yr by 2055 (HVAC capex compounding) — expect insurance premiums to compound above CPI over the hold.
Questions for the listing agent
- It's been on market 33 days. Have you received any prior offers? Is the seller open to a 3% concession, seller financing, or rate buy-down credit?
- Built in 1926 — when were the roof, HVAC, electrical panel, plumbing, and water heater last replaced?
- Is there a deadline driving the sale (1031 exchange, divorce, estate, relocation)? That informs how much negotiation room exists.
- Crime grade is F in this area — have there been break-ins, vandalism, or insurance claims at this property in the last 3 years? What carrier currently insures it and at what premium?
- What's the average days-on-market for RENTAL listings here right now (not sales)? A rising rental-DOM trend means longer vacancies and softer asking-rent achievability than the comps imply.
- What's the recent tenant-quality profile in this submarket — average credit score on applications, eviction rate, late-payment / NSF rate, and stable-employment percentage? A property-management company in the area should have these aggregated.
- How much new for-sale + rental construction is in the pipeline within 1–3 miles? Heavy new supply typically softens prices + rents 12–24 months out; constrained supply supports both.
Investment metrics
- 1% rule
- 1.62% ✓
- Cap rate
- 13.15%
- Cash-on-cash
- 24.48%
- DSCR
- 2.09
- GRM
- 5.1
CMA / ARV
- ARV (median comp)
- $99,460
- List price
- $98,500
- Delta
- -0.97%
- Verdict
- FAIR
- Comps
- 20 within 1.0 mi
Show comp detail 12 sales within ~0.75 mi
| Address | Dist | Beds/Ba | Sqft | Sold | Price | $/sf | Match |
|---|---|---|---|---|---|---|---|
| 619 Geary St | 0.10mi | 4/1.0 (+1) | 1,372 (-0%) | 1mo | $130,000 | $95 | 89 |
| 652 Seneca St | 0.34mi | 3/1.0 | 1,396 (+2%) | 4mo | $150,000 | $107 | 79 |
| 2636 Reel St | 0.04mi | 3/1.0 | 1,232 (-10%) | 3mo | $36,000 | $29 | 78 |
| 625 Oxford St | 0.26mi | 4/1.0 (+1) | 1,332 (-3%) | 1mo | $94,000 | $71 | 77 |
| 2234 N 5th St | 0.47mi | 3/1.0 | 1,380 (+0%) | 4mo | $115,000 | $83 | 75 |
| 2347 N 4th St | 0.34mi | 2/1.0 (-1) | 1,420 (+3%) | 0mo | $155,900 | $110 | 74 |
| 2414 Reel St | 0.28mi | 4/1.5 (+1) | 1,522 (+11%) | 3mo | $168,500 | $111 | 60 |
| 2447 N 2nd St | 0.43mi | 3/1.5 | 1,540 (+12%) | 3mo | $230,000 | $149 | 55 |
| 409 Emerald St | 0.45mi | 3/1.5 | 1,535 (+12%) | 4mo | $140,000 | $91 | 54 |
| 3211 N 4th St | 0.65mi | 4/1.0 (+1) | 1,470 (+7%) | 1mo | $185,000 | $126 | 52 |
| 3161 N 6th St | 0.60mi | 3/1.5 | 1,216 (-12%) | 1mo | $104,000 | $86 | 50 |
| 3227 N 4th St | 0.69mi | 4/1.5 (+1) | 1,530 (+11%) | 3mo | $144,000 | $94 | 40 |
Match score weights: distance 35% · size 25% · config 20% · recency 20%. Top-matched comps best support the ARV.
Projected returns pro-forma
-3.0% appreciation · 1.55% rent growth · sell at horizon
- IRR
- 16.2%
- Equity multiple
- 1.64×
- Total profit
- $17,605
- Equity at exit
- $14,687
- IRR
- 23.7%
- Equity multiple
- 2.90×
- Total profit
- $52,452
- Equity at exit
- $8,516
Cash invested: $27,580 (down + closing). Projections, not guarantees.
Landlord ↔ Tenant lean methodology
- Overall (STATE)
- 62 Landlord-Friendly
- State Pennsylvania
- 62 Landlord-Friendly · EVEN
- County
- — inherits STATE
- City
- — inherits STATE
ZIP-level market 17110
- Rents YoY
- 1.6%
- Active inventory
- 170
- Price-to-rent
- 5.1×
Monthly cashflow live
- Estimated rent
- $1,597 high interval (Pro) →
- Mortgage (P&I)
- −$517
- Tax from tax record
- −$142 /mo · $1,702/yr
- Insurance
- −$41
- HOA
- −$0
- Vacancy / Maint / Mgmt
- −$335
- Net cashflow
- $563
Break-even live
UW: 25.0% down · 7.5% · 30yr · 1.5% tax · 5.0% vac · 8.0% maint · 8.0% mgmt
Financing live
Cash to close
- Down payment
- $24,625
- Closing costs
- $2,955
- Reserves months
- —
- Total cash needed
- —
Loan-product check · same deal, 3 products live
Conventional
25% down · 7.5% · 30yr
- Down + closing
- —
- Monthly P&I
- —
- Monthly cashflow
- —
- DSCR
- —
- Eligible?
- —
Personal DTI + credit; lowest rate.
DSCR
20% down · 8.5% · 30yr
- Down + closing
- —
- Monthly P&I
- —
- Monthly cashflow
- —
- DSCR
- —
- Eligible?
- —
No personal income docs; deal must DSCR.
Hard money
10% down · 12.0% · 12mo
- Down + closing
- —
- Monthly P&I
- —
- Monthly cashflow
- —
- DSCR
- —
- Eligible?
- —
Short-term bridge; refi at stabilization.
Rent comps 31 comps
| Address | Beds | Baths | Sqft | Rent | $/sqft | DOM | Units | Dist |
|---|---|---|---|---|---|---|---|---|
| 514 Radnor St Harrisburg, PA | 4.0 | 1.0 | 1498 | $1,600 | $1.07 | 44d | 1 | 0.05mi |
| 2715 N 6th St Harrisburg, PA | 4.0 | 1.0 | 1620 | $1,650 | $1.02 | 14d | 1 | 0.14mi |
| 2728 N 6th St Harrisburg, PA | 4.0 | 2.0 | 1786 | $1,750 | $0.98 | 14d | 1 | 0.15mi |
| 2615 Waldo St Harrisburg, PA | 3.0 | 1.0 | 1400 | $1,095 | $0.78 | 44d | 1 | 0.23mi |
| 2406 Reel St Harrisburg, PA | 4.0 | 1.0 | 1500 | $1,395 | $0.93 | 44d | 1 | 0.28mi |
| 2801 N 2nd St Apt A2 Harrisburg, PA | 3.0 | 1.5 | 1200 | $1,495 | $1.25 | 44d | 1 | 0.40mi |
| 339 Emerald St Harrisburg, PA | 3.0 | 1.5 | 1420 | $1,650 | $1.16 | 14d | 1 | 0.45mi |
| 3003 Pennwood Rd Harrisburg, PA | 3.0 | 1.0 | 900 | $1,395 | $1.55 | 14d | 1 | 0.45mi |
| 2235 Logan St Harrisburg, PA | 3.0 | 1.0 | 1406 | $1,495 | $1.06 | 44d | 1 | 0.50mi |
| 2301 N 2nd St Harrisburg, PA | 2.0 | 1.5 | 1325 | $1,595 | $1.20 | 44d | 1 | 0.54mi |
| 2210 N 3rd St Unit 4 Harrisburg, PA | 2.0 | 1.0 | 1330 | $1,395 | $1.05 | 14d | 1 | 0.55mi |
| 325 Woodbine St Harrisburg, PA | 2.0 | 1.0 | 1706 | $1,350 | $0.79 | 23d | 1 | 0.57mi |
| 2118 N 4th St Harrisburg, PA | 4.0 | 1.0 | 1383 | $1,595 | $1.15 | 44d | 1 | 0.61mi |
| 2153 Penn St Harrisburg, PA | 4.0 | 2.0 | 1620 | $1,995 | $1.23 | 44d | 1 | 0.65mi |
| 2042 N 4th St Harrisburg, PA | 3.0 | 1.0 | 1090 | $1,400 | $1.28 | 44d | 1 | 0.69mi |
| 3216 Green St Harrisburg, PA | 4.0 | 2.0 | 1550 | $2,200 | $1.42 | 14d | 1 | 0.74mi |
| 2032 Susquehanna St Harrisburg, PA | 4.0 | 1.5 | 1600 | $1,595 | $1.00 | 44d | 1 | 0.75mi |
| 269 Peffer St Harrisburg, PA | 2.0 | 1.0 | 1000 | $1,195 | $1.20 | 44d | 1 | 0.81mi |
| 1909 N 4th St Harrisburg, PA | 2.0 | 1.0 | 1000 | $1,240 | $1.24 | 44d | 1 | 0.81mi |
| 1841 N 4th St Harrisburg, PA | 3.0 | 1.0 | 1376 | $1,399 | $1.02 | 23d | 1 | 0.85mi |
| 1841 N 3rd St Harrisburg, PA | 3.0 | 1.0 | 1376 | $1,399 | $1.02 | 14d | 1 | 0.88mi |
| 640 Kelker St Harrisburg, PA | 3.0 | 1.0 | 1294 | $1,650 | $1.28 | 44d | 1 | 0.91mi |
| 644 Kelker St Harrisburg, PA | 3.0 | 1.0 | 1294 | $1,295 | $1.00 | 44d | 1 | 0.91mi |
| 1839 Green St Harrisburg, PA | 1.0–2.0 | 1.0 | 815 | $1,595 | $1.96 | 14d | 1 | 0.92mi |
| 1834 Green St Harrisburg, PA | 4.0 | 1.0 | 1792 | $1,495 | $0.83 | 23d | 1 | 0.92mi |
| 1821 N 2nd St Unit 2 Harrisburg, PA | 2.0 | 1.0 | 1000 | $1,299 | $1.30 | 14d | 1 | 0.97mi |
| 1320 Penn St Harrisburg, PA | 2.0 | 1.0 | 1193 | $1,495 | $1.25 | 44d | 1 | 1.38mi |
| 1202 Penn St Harrisburg, PA | 4.0 | 1.0 | 1706 | $1,495 | $0.88 | 44d | 1 | 1.47mi |
| 1116 N 3rd St Unit 3 Harrisburg, PA | 2.0 | 1.0 | 1100 | $1,375 | $1.25 | 23d | 1 | 1.48mi |
| 1122 Green St #14 Harrisburg, PA | 2.0 | 1.0 | 918 | $1,895 | $2.06 | 44d | 1 | 1.49mi |
| 660 Boas St Harrisburg, PA | 2.0 | 1.0–2.0 | 800 | $1,574 | $1.97 | 14d | 21 | 1.50mi |
Listing history 33 events
-
2026-06-18days on market $98,500 Active 33 DOM
-
2026-06-17days on market $98,500 Active 32 DOM
-
2026-06-16days on market $98,500 Active 31 DOM
-
2026-06-15days on market $98,500 Active 30 DOM
-
2026-06-14days on market $98,500 Active 28 DOM
-
2026-06-13days on market $98,500 Active 27 DOM
-
2026-06-10days on market $98,500 Active 25 DOM
-
2026-06-09days on market $98,500 Active 24 DOM
-
2026-06-08days on market $98,500 Active 23 DOM
-
2026-06-07days on market $98,500 Active 22 DOM
-
2026-06-03days on market $98,500 Active 18 DOM
-
2026-06-02days on market $98,500 Active 17 DOM
-
2026-06-01days on market $98,500 Active 16 DOM
-
2026-05-31days on market $98,500 Active 15 DOM
-
2026-05-31days on market $98,500 Active 14 DOM
-
2026-05-07status Pending 607-char remark
-
2026-04-30$98,500 Active 607-char remark
-
2026-02-24historical
-
2026-01-20price $105,000
-
2025-11-10price $110,000
-
2025-11-10status Active
-
2025-10-27historical
-
2025-10-02price $116,000
-
2025-10-02status Active
-
2025-09-30historical
-
2025-08-06price $120,000
-
2025-08-01price $122,000
-
2025-08-01status Active
-
2025-07-31historical
-
2025-05-28price $125,000
-
2025-04-22price $130,000
-
2025-04-03$135,000 Active
-
2006-03-02soldstatus $65,000
ⓘ Source: listings_history table (triggers on properties + properties_extension) + one-shot
backfill from property_details.listing_events for pre-trigger history.
Tax reassessment forecast PA · Partial reset (capped growth)
- Current annual tax
- $1,702 · $142/mo
- Projected year-2 tax
- $1,702 · $142/mo
- Expected delta
- $0/yr ($0/mo · 0.0%)
ⓘ Screening estimate from a state-policy table — verify with the county assessor before closing.
Climate risk First Street
- Flood 1/10 Low FEMA zone X (unshaded) · 0% chance over 30 yrs
- Wildfire 1/10 Low
- Heat 6/10 Major 7 d/yr ≥101°F today · 15 d/yr by 30 yrs out
- Wind 3/10 Moderate 5% chance of damaging wind over 30 yrs
- Air quality 2/10 Low 1 unhealthy d/yr today · 3 by 30 yrs out
Nearby sold comps map
Loading sold comps map…
Walkable amenities ~0.75 mi
Loading nearby amenities…
Taxation est. · year 1
- Rental income
- $19,169
- − Mortgage interest
- −$5,518
- − Property taxes
- −$1,702
- − Insurance
- −$492
- − Repairs & maintenance
- −$1,533
- − Management
- −$1,533
- − Depreciation
- −$2,865
- Taxable income
- $5,524
- Est. tax owed @ 24.0%
- −$1,326
- After-tax cash flow
- $5,425/yr
For passive investors: Depreciation is non-cash, so a rental often shows a tax loss while cash-flowing — sheltering income. Rental losses are passive: they offset passive income freely, and up to $25,000/yr can offset ordinary (W-2) income if you actively participate and your MAGI is under $100k (phasing out to $0 by $150k); unused losses carry forward. On sale, claimed depreciation is recaptured at up to 25%, and gains may owe capital-gains tax (a 1031 exchange can defer both). Figures are a year-1 estimate at your 24.0% rate — not tax advice; consult a CPA.
Schools (NCES district)
- District
- Harrisburg City SD
- NCES district ID
- 4211580
- Math proficiency
- 6% ▼ -6.00%
- Reading proficiency
- 13% ▼ -10.00%
- Median HH income
- $33,432
- Composite
- 7.6/100
- National rank
- #9945
- State rank
- #535 of 539 in PA
Livability — Harrisburg
- Score
- 84/100
- State rank
- #107
- US rank
- #826
Category grades
Schools grade is shown separately in the Schools card above.
Census & demographics
- Census place
- Harrisburg, PA
- County
- Dauphin County · 247,857 people
- City population
- 184,296
- Metro
- Harrisburg-Carlisle, PA
- Population (ZIP)
- 27,364
- Household income
- $80,699
- Rent vs Own
- Severe rent burden
- 1037.0
Population outlook (Dauphin County) Hauer SSP2
- Today (2025)
- 281,628 people
- By 2030
- 283,549 · +0.7%
- By 2040
- 285,385 · +1.3%
- By 2050
- 286,188 · +1.6%
- By 2075
- 291,053 · +3.3%
- By 2100
- 282,374 · +0.3%
Race, ethnicity, and origin ACS 2023
- Neighborhood character
- Diverse neighborhood (Simpson 0.66)
- Race & ethnicity
- White 47% Black 32% Hispanic / Latino 9% Asian 7% Two or more races 6%
- Hispanic origin (detail)
- Puerto Rican 6% Dominican 1%
- Common ancestry
- Italian 3% Romanian 2% Slovak 1%
- Foreign-born
- 8% · Canada, India, Vietnam
- Languages at home
- 88% English-only · Spanish 6% Other Indo-European 2% Vietnamese 1%
Political lean MEDSL · Dauphin
- 2024 margin
- Lean D (+5.9) · D 52.4% · R 46.5% · Other 1.1%
- 2008→2024 swing
- -3.1pp toward R · 2008: 9.1pp · 2024: 5.9pp
- All cycles
- 2024: D+5.9 2020: D+8.5 2016: D+2.8 2012: D+6.0 2008: D+9.1
Not yet ingested
- Civics
- —
Market trends
- HPI YoY
- ▼ -144.07%
- Current HPI
- 257.826
- Rent YoY
- ▲ 1.55%
- Metro
- Harrisburg-Carlisle, PA
- State GDP YoY
- ▲ 1.68%
- F500 in state
- 34
Industry mix (Fortune 500 HQ in PA)
| Industry | F500 HQs | Revenue |
|---|---|---|
| Healthcare | 2 | $309B |
|
||
| Insurance | 2 | $27B |
|
||
| Telecommunications / Media | 1 | $124B |
|
||
| Industrial Distribution | 1 | $22B |
|
||
| Financial Services | 1 | $20B |
|
||
| Chemicals / Materials | 1 | $18B |
|
||
Price history
+51.5% since first listed19 events — show timeline
- 2026-05-24 Relisted — BRIGHT MLS
- 2026-05-07 Pending — BRIGHT MLS
- 2026-04-30 Listed $98,500 BRIGHT MLS
- 2026-02-24 Listing Removed — BRIGHT MLS
- 2026-01-20 Price Changed $105,000 BRIGHT MLS
- 2025-11-10 Price Changed $110,000 BRIGHT MLS
- 2025-11-10 Relisted — BRIGHT MLS
- 2025-10-27 Listing Removed — BRIGHT MLS
- 2025-10-02 Price Changed $116,000 BRIGHT MLS
- 2025-10-02 Relisted — BRIGHT MLS
- 2025-09-30 Listing Removed — BRIGHT MLS
- 2025-08-06 Price Changed $120,000 BRIGHT MLS
- 2025-08-01 Price Changed $122,000 BRIGHT MLS
- 2025-08-01 Relisted — BRIGHT MLS
- 2025-07-31 Listing Removed — BRIGHT MLS
- 2025-05-28 Price Changed $125,000 BRIGHT MLS
- 2025-04-22 Price Changed $130,000 BRIGHT MLS
- 2025-04-03 Listed $135,000 BRIGHT MLS
- 2006-03-02 Sold (Public Records) $65,000 Public Records
Property tax history
+1.0%/yrLatest (2026): $1,702 · +1.6% YoY. Source: county tax records.
Cash-flow waterfall
monthlySold comps — $/sqft
last 12 mo · ≤1 miLoading sold comps…