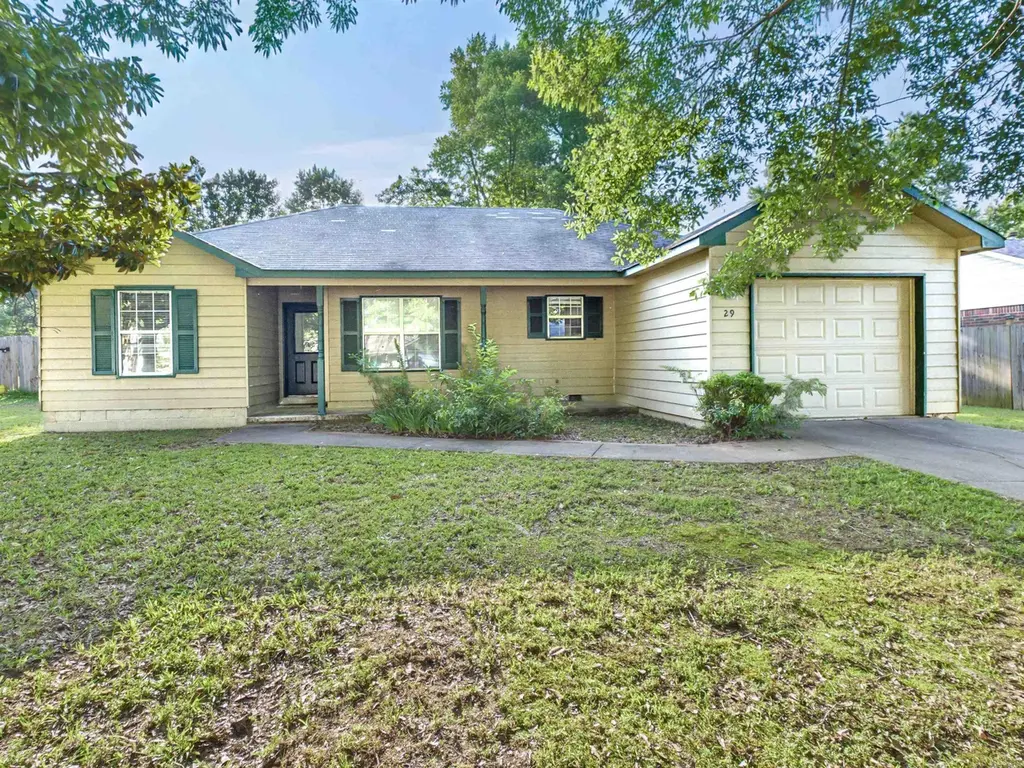
29 Burns Dr · Cabot, AR
Flood risk 1/10 · Minimal
- FEMA flood zone
- X (unshaded)
- Chance of flooding over 30 yrs
- 0.0%
- Est. flood insurance / yr
- $507 – $1,088
Fire risk 4/10 · Minor
- Est. fire insurance / yr
- $1,499 – $2,785
Heat risk 7/10 · Major
- Hot days now (above 109°F)
- 7 days/yr
- Hot days in 30 yrs
- 19 days/yr
Wind risk 3/10 · Minor
- Chance of severe wind over 30 yrs
- 8.0%
Air-quality risk 2/10 · Minimal
- Unhealthy air days now
- 1 days/yr
- Unhealthy air days in 30 yrs
- 1 days/yr
Risk factors via First Street. Map © Google.
Why this score? — see what drove the D grade
The composite is a weighted blend of 9 inputs, each scored 0–100. Each bar is that input's sub-score; the figure is the points it added to the 100-point composite (weight × sub-score).
- Cash flow +14.6/30.0
- ARV discount +8.3/15.0
- DSCR +4.4/10.0
- Schools +4.0/10.0
- Livability +3.9/5.0
- Rent growth +3.3/5.0
- 1% rule +3.0/10.0
- Condition / age +2.5/5.0
- Appreciation +0.0/10.0
$167,500
🖨 Deal sheet (PDF) 📄 Offer letter ✓ Due diligence
Listing remarks
Lovely home with a spacious layout and plenty of natural light! NEW ROOF!! The large kitchen features a breakfast bar with ample space for cooking and gathering. Enjoy the sunny living room, dedicated laundry area, and generously sized bedrooms. Easy-to-maintain flooring throughout makes everyday living simple. Step outside to a large backyard that’s perfect for entertaining, relaxing, or enjoying outdoor activities. A must-see property with so much to offer!
Key facts
- Large backyard
- Large kitchen
- Breakfast bar
Tags
Property features AI
Exterior
- Parking: 1-car garage
- Utilities: Public water
- Home design: Frame exterior
- Construction: Composition roof; Slab foundation; Frame construction
- Exterior features: Partially fenced yard; Paved road access; Level lot
Interior
- Kitchen: Gas range; Dishwasher
- Flooring: Tile; Luxury vinyl
- Bathrooms: 2 full bathrooms
- Heating & cooling: Central heating (gas); Central cooling (electric)
- Interior features: Tile and luxury vinyl flooring; Laundry room
- Laundry & utility: Laundry room
Neighborhood map
What this means for you Summary
Snapshot
- This is a 3-bed/2.0-bath single-family listed at $168k.
Deal economics
- At list price, monthly cash flow is $39 ($472/yr) — positive.
- The deal already cash-flows at list — no discount required.
- To meet the 1% rule (rent ≥ 1% of price), the offer needs to be $134k (20.0% below list).
- Recommended offer: $134k (20.0% below list) — sets the bar for 1% rule.
- Cap rate 6.6% vs local median 4.6% in Cabot — top-decile yield for the area; either an underpriced asset or a hidden risk that comps aren't pricing in. Stress-test before assuming the spread holds.
Location & tenants
- Location reads 78/100 on livability (#6 in AR, #2,695 nationally) — a middle-class / working-renter tenant base. Strengths: cost of living A+, housing A+, health & safety A+; Watch: commute F.
- Cabot School District (suburban): math 48% / reading 43% proficiency, ranked #29 of 238 in AR (top 12%) — families likely to look elsewhere, expect single-tenant / working-renter base with shorter leases.
- Zoned schools: Westside Elementary School (math 52% / reading 37%, grade F, #143 of 454 statewide, top 36%, 400 students, 65% FRL); Cabot Middle School South (math 48% / reading 38%, grade D-, #70 of 201 statewide, top 38%, 717 students, 49% FRL); Cabot High School (math 29% / reading 45%, grade F, #64 of 292 statewide, top 26%, 2,198 students, 36% FRL) — zoned schools average 50% FRL vs 30% district-wide (20 pts higher); higher-poverty schools than district average — tighter screening recommended.
- Market conditions: Rents rising (+3.2%/yr); 345 active listings in the ZIP; 21 comparable units currently listed for rent nearby; rentals at typical pace (median 25d on market — plan ~3-4 weeks tenant-placement turnaround); solid renter incomes; 185 units permitted in Lonoke County in 2024 (0 in 5+ unit buildings).
Forward outlook
- Local home prices are declining (-3.0%/yr); year-one equity from $1k of loan paydown is wiped out by about $5k of value loss. Plan a longer hold.
- Lonoke County population projected at +12% by 2050 — modest demand growth; plan on rents tracking national, not racing it.
Negotiation context
- It's been on market 18 days — a 2% lower offer ($165k) is reasonable based on typical stale-listing flexibility.
- 4 sale attempts since 2y ago with the ask held roughly flat each time — persistent listings suggest the price (not the market) is what's stuck; bring a comps-based counter.
- Current owner paid $79k; list at $168k implies a 112% gain — meaningful room to come down on a strong offer.
Risks & watch-outs
- Climate carrying-cost: extreme-heat days projected 7→19/yr by 2055 (HVAC capex compounding) — expect insurance premiums to compound above CPI over the hold.
Questions for the listing agent
- Is there a deadline driving the sale (1031 exchange, divorce, estate, relocation)? That informs how much negotiation room exists.
- The area grade is low — what's the realistic commute time and amenity access for the typical tenant pool here? Any planned neighborhood developments (good or bad) we should know about?
- What's the average days-on-market for RENTAL listings here right now (not sales)? A rising rental-DOM trend means longer vacancies and softer asking-rent achievability than the comps imply.
- What's the recent tenant-quality profile in this submarket — average credit score on applications, eviction rate, late-payment / NSF rate, and stable-employment percentage? A property-management company in the area should have these aggregated.
- How much new for-sale + rental construction is in the pipeline within 1–3 miles? Heavy new supply typically softens prices + rents 12–24 months out; constrained supply supports both.
Investment metrics
- 1% rule
- 0.80% ✗
- Cap rate
- 6.57%
- Cash-on-cash
- 1.01%
- DSCR
- 1.04
- GRM
- 10.4
CMA / ARV
- ARV (on-the-fly)
- $170,640
- Comps found
- 12
Show comp detail 12 sales within ~0.75 mi
| Address | Dist | Beds/Ba | Sqft | Sold | Price | $/sf | Match |
|---|---|---|---|---|---|---|---|
| 30 Mcarthur Dr Dr | 0.06mi | 3/1.5 | 1,236 (+4%) | 3mo | $159,000 | $129 | 86 |
| 37 Saint John St | 0.54mi | 3/1.0 | 1,188 (+0%) | 3mo | $81,500 | $69 | 68 |
| 33 Reno Dr | 0.55mi | 2/2.0 (-1) | 1,221 (+3%) | 0mo | $140,000 | $115 | 64 |
| 39 Nevada Ln | 0.36mi | 3/2.0 | 1,320 (+11%) | 3mo | $205,000 | $155 | 62 |
| 51 Nevada Ln | 0.41mi | 3/2.0 | 1,310 (+10%) | 4mo | $195,000 | $149 | 60 |
| 20 Westhaven Pl | 0.38mi | 2/2.0 (-1) | 1,087 (-8%) | 5mo | $179,500 | $165 | 59 |
| 38 S 10th St | 0.65mi | 3/1.0 | 1,140 (-4%) | 2mo | $135,000 | $118 | 58 |
| 21 Silverado Ct | 0.50mi | 3/2.0 | 1,321 (+12%) | 2mo | $190,000 | $144 | 56 |
| 212 Rodney Guthrie Dr | 0.45mi | 3/2.0 | 1,346 (+14%) | 1mo | $176,000 | $131 | 56 |
| 19 Fox Run Cir | 0.55mi | 3/2.0 | 1,050 (-11%) | 0mo | $175,000 | $167 | 55 |
| 609 Dakota St | 0.54mi | 2/2.0 (-1) | 1,287 (+9%) | 6mo | $205,000 | $159 | 51 |
| 24 Winchester Ct | 0.65mi | 3/2.0 | 1,294 (+9%) | 6mo | $179,900 | $139 | 50 |
Match score weights: distance 35% · size 25% · config 20% · recency 20%. Top-matched comps best support the ARV.
Projected returns pro-forma
-3.0% appreciation · 3.19% rent growth · sell at horizon
- IRR
- -14.6%
- Equity multiple
- 0.48×
- Total profit
- $-24,446
- Equity at exit
- $24,975
- IRR
- -5.6%
- Equity multiple
- 0.63×
- Total profit
- $-17,269
- Equity at exit
- $14,482
Cash invested: $46,900 (down + closing). Projections, not guarantees.
Landlord ↔ Tenant lean methodology
- Overall (STATE)
- 92 Strongly Landlord-Friendly
- State Arkansas
- 92 Strongly Landlord-Friendly · R+14
- County
- — inherits STATE
- City
- — inherits STATE
ZIP-level market 72023
- Home prices YoY
- -13.8%
- Rents YoY
- 3.2%
- Active inventory
- 345
- Price-to-rent
- 10.4×
Monthly cashflow live
- Estimated rent
- $1,340 high interval (Pro) →
- Mortgage (P&I)
- −$878
- Tax from tax record
- −$71 /mo · $848/yr
- Insurance
- −$70
- HOA
- −$0
- Vacancy / Maint / Mgmt
- −$281
- Net cashflow
- $39
Break-even live
Sensitivity live
| Price | -10% $134 | -5% $87 | +0% $39 | +5% $-8 | +10% $-55 |
|---|---|---|---|---|---|
| Rent | -10% $-66 | -5% $-14 | +0% $39 | +5% $92 | +10% $145 |
| Rate | -1.0pp $124 | -0.5pp $82 | base $39 | +0.5pp $-4 | +1.0pp $-48 |
UW: 25.0% down · 7.5% · 30yr · 1.5% tax · 5.0% vac · 8.0% maint · 8.0% mgmt
Financing live
Cash to close
- Down payment
- $41,875
- Closing costs
- $5,025
- Reserves months
- —
- Total cash needed
- —
Loan-product check · same deal, 3 products live
Conventional
25% down · 7.5% · 30yr
- Down + closing
- —
- Monthly P&I
- —
- Monthly cashflow
- —
- DSCR
- —
- Eligible?
- —
Personal DTI + credit; lowest rate.
DSCR
20% down · 8.5% · 30yr
- Down + closing
- —
- Monthly P&I
- —
- Monthly cashflow
- —
- DSCR
- —
- Eligible?
- —
No personal income docs; deal must DSCR.
Hard money
10% down · 12.0% · 12mo
- Down + closing
- —
- Monthly P&I
- —
- Monthly cashflow
- —
- DSCR
- —
- Eligible?
- —
Short-term bridge; refi at stabilization.
Rent comps 21 comps
| Address | Beds | Baths | Sqft | Rent | $/sqft | DOM | Units | Dist |
|---|---|---|---|---|---|---|---|---|
| 29 Burns Dr Cabot, AR | 3.0 | 2.0 | 1185 | $1,325 | $1.12 | 25d | 1 | 0.02mi |
| 28 Park Cir Cabot, AR | 3.0 | 2.0 | 1312 | $1,325 | $1.01 | 25d | 1 | 0.33mi |
| 13 Pheasant Run Dr Cabot, AR | 3.0 | 1.5 | 1162 | $1,245 | $1.07 | 25d | 1 | 0.46mi |
| 506 Waymack Cv Cabot, AR | 3.0 | 2.0 | 1165 | $1,450 | $1.24 | 25d | 1 | 0.53mi |
| 35 Pheasant Run Dr Cabot, AR | 3.0 | 1.0 | 1185 | $1,250 | $1.05 | 25d | 1 | 0.56mi |
| 415 Waymack Dr Cabot, AR | 2.0 | 1.0 | 913 | $995 | $1.09 | 25d | 1 | 0.57mi |
| 47 Pheasant Run Dr Cabot, AR | 3.0 | 1.0 | 1211 | $1,100 | $0.91 | 16d | 1 | 0.58mi |
| 405 Waymack Dr Cabot, AR | 3.0 | 2.0 | 1300 | $1,450 | $1.12 | 16d | 1 | 0.58mi |
| 1012 W Myrtle St Unit A Cabot, AR | 2.0 | 1.5 | 900 | $875 | $0.97 | 25d | 1 | 0.70mi |
| 1099 W Elm St Unit B Cabot, AR | 2.0 | 1.5 | 864 | $875 | $1.01 | 25d | 1 | 0.71mi |
| 303 S 10th St Apt 2 Cabot, AR | 2.0 | 1.5 | 1054 | $900 | $0.85 | 21d | 1 | 0.72mi |
| 807 W Elm St Unit 1D Cabot, AR | 2.0 | 1.5 | 957 | $750 | $0.78 | 25d | 1 | 0.85mi |
| 400 Northport Dr Cabot, AR | 2.0–3.0 | 1.0–2.0 | 991 | $1,223 | $1.23 | 16d | 16 | 1.01mi |
| 33 Ryleigh Cir Cabot, AR | 3.0 | 2.0 | 1333 | $1,350 | $1.01 | 25d | 1 | 1.01mi |
| 63 Robinson St Cabot, AR | 3.0 | 1.5 | 1008 | $1,350 | $1.34 | 25d | 1 | 1.08mi |
| 311 S Lincoln St Cabot, AR | 2.0 | 1.0 | 780 | $1,000 | $1.28 | 16d | 1 | 1.18mi |
| 106 S Grant St Cabot, AR | 2.0 | 1.0 | 958 | $1,050 | $1.10 | 25d | 1 | 1.18mi |
| 118 N Park St Unit A Cabot, AR | 2.0 | 1.0 | 750 | $950 | $1.27 | 25d | 1 | 1.42mi |
| 305 N Jackson St Cabot, AR | 3.0 | 2.0 | 1009 | $1,395 | $1.38 | 23d | 1 | 1.42mi |
| 107 N Park St Unit A Cabot, AR | 2.0 | 1.0 | 784 | $800 | $1.02 | 16d | 1 | 1.47mi |
| 2695 S 2nd St Cabot, AR | 2.0–3.0 | 2.0 | 1125 | $1,175 | $1.04 | 16d | 2 | 1.48mi |
Listing history 13 events
-
2026-06-21days on market $167,500 Active 18 DOM
-
2026-06-18days on market $167,500 Active 15 DOM
-
2026-06-17days on market $167,500 Active 14 DOM
-
2026-06-16remarks 463-char remark
-
2026-06-16days on market $167,500 Active 13 DOM
-
2026-06-15days on market $167,500 Active 12 DOM
-
2026-06-14days on market $167,500 Active 10 DOM
-
2026-06-10statusdays on market $167,500 Active 7 DOM
-
2026-06-09days on market $167,500 New Listing 6 DOM
-
2026-06-08days on market $167,500 New Listing 5 DOM
-
2026-06-07days on market $167,500 New Listing 4 DOM
-
2026-06-05remarks 452-char remark
-
2026-06-05$167,500 New Listing 1 DOM
ⓘ Source: listings_history table (triggers on properties + properties_extension) + one-shot
backfill from property_details.listing_events for pre-trigger history.
Tax reassessment forecast AR · Resets to sale price
- Current annual tax
- $848 · $71/mo
- Projected year-2 tax
- $1,072 · $89/mo
- Expected delta
- +$224/yr (+$19/mo · 26.3%)
ⓘ Screening estimate from a state-policy table — verify with the county assessor before closing.
Climate risk First Street
- Flood 1/10 Low FEMA zone X (unshaded) · 0% chance over 30 yrs
- Wildfire 4/10 Moderate
- Heat 7/10 Severe 7 d/yr ≥109°F today · 19 d/yr by 30 yrs out
- Wind 3/10 Moderate 8% chance of damaging wind over 30 yrs
- Air quality 2/10 Low 1 unhealthy d/yr today · 1 by 30 yrs out
Nearby sold comps map
Loading sold comps map…
Walkable amenities ~0.75 mi
Loading nearby amenities…
Taxation est. · year 1
- Rental income
- $16,074
- − Mortgage interest
- −$9,383
- − Property taxes
- −$848
- − Insurance
- −$838
- − Repairs & maintenance
- −$1,286
- − Management
- −$1,286
- − Depreciation
- −$4,873
- Taxable loss
- −$2,439
- Est. tax savings @ 24.0%
- +$585
- After-tax cash flow
- $1,057/yr
For passive investors: Depreciation is non-cash, so a rental often shows a tax loss while cash-flowing — sheltering income. Rental losses are passive: they offset passive income freely, and up to $25,000/yr can offset ordinary (W-2) income if you actively participate and your MAGI is under $100k (phasing out to $0 by $150k); unused losses carry forward. On sale, claimed depreciation is recaptured at up to 25%, and gains may owe capital-gains tax (a 1031 exchange can defer both). Figures are a year-1 estimate at your 24.0% rate — not tax advice; consult a CPA.
Schools (NCES district)
- District
- Cabot School District
- NCES district ID
- 0503750
- Math proficiency
- 48% ▼ -14.00%
- Reading proficiency
- 43% ▼ -10.00%
- Median HH income
- $55,993
- Composite
- 39.66/100
- National rank
- #3912
- State rank
- #29 of 238 in AR
Livability — Cabot
- Score
- 78/100
- State rank
- #6
- US rank
- #2695
Category grades
Schools grade is shown separately in the Schools card above.
Census & demographics
- Census place
- Cabot, AR
- County
- Lonoke County · 46,130 people
- City population
- 37,452
- Metro
- Little Rock-North Little Rock-Conway, AR
- Population (ZIP)
- 37,452
- Household income
- $76,931
- Rent vs Own
- Severe rent burden
- 939.0
Population outlook (Lonoke County) Hauer SSP2
- Today (2025)
- 78,072 people
- By 2030
- 80,673 · +3.3%
- By 2040
- 84,977 · +8.8%
- By 2050
- 87,778 · +12.4%
- By 2075
- 91,398 · +17.1%
- By 2100
- 87,858 · +12.5%
Race, ethnicity, and origin ACS 2023
- Neighborhood character
- Predominantly White (85%)
- Race & ethnicity
- White 85% Two or more races 6% Hispanic / Latino 5% Black 4% Asian 2%
- Common ancestry
- Italian 2% Lithuanian 2% Serbian 1%
- Foreign-born
- 3% · Canada, Vietnam
- Languages at home
- 96% English-only · Spanish 2%
Political lean MEDSL · Lonoke
- 2024 margin
- Solid R (+53.7) · D 22.2% · R 75.8% · Other 2.0%
- 2008→2024 swing
- -6.2pp toward R · 2008: -47.5pp · 2024: -53.7pp
- All cycles
- 2024: R+53.7 2020: R+52.8 2016: R+53.3 2012: R+50.9 2008: R+47.5
Not yet ingested
- Civics
- —
Market trends
- HPI YoY
- ▼ -29.12%
- Current HPI
- 182.3489
- Rent YoY
- ▲ 3.19%
- Metro
- Little Rock-North Little Rock-Conway, AR
- State GDP YoY
- ▲ 3.80%
- F500 in state
- 10
Industry mix (Fortune 500 HQ in AR)
| Industry | F500 HQs | Revenue |
|---|---|---|
| Retail | 1 | $681B |
|
||
| Food / Agriculture | 1 | $53B |
|
||
| Retail / Energy | 1 | $22B |
|
||
| Transportation / Logistics | 1 | $12B |
|
||
| Energy | 1 | $4B |
|
||
Price history
+112.0% since first listed11 events — show timeline
- 2026-06-03 Listed $167,500 CARMLS
- 2026-06-01 Rental Removed $1,325 APPFOLIO
- 2026-05-06 Listed for Rent $1,325 APPFOLIO
- 2025-03-09 Rental Removed $1,225 APPFOLIO
- 2025-03-06 Price Changed $1,225 APPFOLIO
- 2025-02-25 Price Changed $1,275 APPFOLIO
- 2025-02-01 Listed for Rent $1,350 APPFOLIO
- 2024-03-17 Rental Removed $1,225 APPFOLIO
- 2024-03-13 Listed for Rent $1,225 APPFOLIO
- 2022-03-05 Price Changed $925 APPFOLIO
- 2003-09-11 Sold (Public Records) $79,000 Public Records
Property tax history
+0.6%/yrLatest (2025): $848 · +0.0% YoY. Source: county tax records.
Cash-flow waterfall
monthlySold comps — $/sqft
last 12 mo · ≤1 miLoading sold comps…