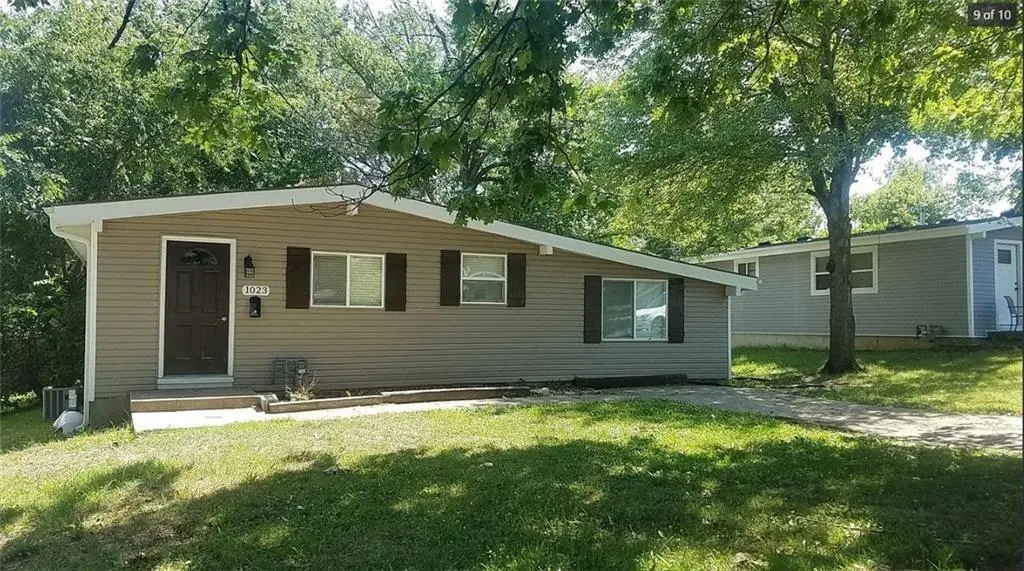
1023 Shearer Rd · Kansas City, KS
Flood risk 1/10 · Minimal
- FEMA flood zone
- X (unshaded)
- Chance of flooding over 30 yrs
- 0.0%
- Est. flood insurance / yr
- $473 – $860
Fire risk 1/10 · Minimal
- Est. fire insurance / yr
- $1,154 – $2,142
Heat risk 4/10 · Minor
- Hot days now (above 106°F)
- 6 days/yr
- Hot days in 30 yrs
- 15 days/yr
Wind risk 2/10 · Minimal
- Chance of severe wind over 30 yrs
- —
Air-quality risk 3/10 · Minor
- Unhealthy air days now
- 2 days/yr
- Unhealthy air days in 30 yrs
- 3 days/yr
Risk factors via First Street. Map © Google.
Why this score? — see what drove the D grade
The composite is a weighted blend of 9 inputs, each scored 0–100. Each bar is that input's sub-score; the figure is the points it added to the 100-point composite (weight × sub-score).
- Cash flow +16.2/30.0
- ARV discount +7.5/15.0
- DSCR +5.0/10.0
- Rent growth +3.9/5.0
- 1% rule +3.7/10.0
- Livability +3.6/5.0
- Condition / age +2.5/5.0
- Schools +0.9/10.0
- Appreciation +0.0/10.0
$229,000
🖨 Deal sheet (PDF) 📄 Offer letter ✓ Due diligence
Listing remarks
Newly remodeled 4 bed/1bath, 1400 sq ft, large fenced backyard, hardwood floors, New kitchen cabinets and appliances, freshly remodeled bathroom. New roof and plumbing, newer hvac, Move in ready. This house qualifies for $6,000 down payment assistance with no mortgage insurance and lower than average interest rate. Ask agent for more details. Minutes from downtown, Westport, Plaza and KU Med.
Key facts
- New kitchen cabinets
- Hardwood floors
- 7,405 sq ft lot
Tags
Property features AI
Finance
- Other: Lot about 0.17 acres
- HOA & community: No association fees; No maintenance provided
Exterior
- Parking: Other parking
- Utilities: Public water; Public sewer
- Home design: Single-family residence; Residential property; Ranch style
- Construction: Vinyl siding; Composition roof; Home built approximately 76–100 years ago
- Exterior features: Not in a flood plain
Interior
- Bedrooms: 4 bedrooms
- Flooring: Luxury vinyl flooring; Wood flooring
- Bathrooms: 1 full bathroom
- Heating & cooling: Natural gas heating; Electric cooling (has air conditioning)
- Interior features: Ranch floor plan; Crawl space basement
Neighborhood map
What this means for you Summary
Snapshot
- This is a 3-bed/1.0-bath single-family listed at $229k.
Deal economics
- At list price, monthly cash flow is $120 ($1k/yr) — positive.
- The deal already cash-flows at list — no discount required.
- To meet the 1% rule (rent ≥ 1% of price), the offer needs to be $200k (12.6% below list).
- Recommended offer: $200k (12.6% below list) — sets the bar for 1% rule.
- Cap rate 6.9% vs local median 4.8% in Kansas City — top-decile yield for the area; either an underpriced asset or a hidden risk that comps aren't pricing in. Stress-test before assuming the spread holds.
Location & tenants
- Location reads 72/100 on livability (#103 in KS) — a middle-class / working-renter tenant base. Strengths: commute A+, cost of living A+, housing A+; Watch: crime F, employment D-.
- Kansas City (urban): math 8% / reading 15% proficiency, ranked #169 of 169 in KS (top 100%) — low school quality limits family demand, transient renter base, plan for 1-2y turnover; 81% free/reduced lunch — lower-income household profile, screen leases tightly.
- Zoned schools: Noble Prentis Elem (math 8% / reading 27%, grade F, #612 of 684 statewide, top 89%, 216 students, 91% FRL); Argentine Middle (math 3% / reading 11%, grade F, #210 of 219 statewide, top 98%, 569 students, 86% FRL); J C Harmon High (math 0% / reading 4%, grade F, #326 of 327 statewide, top 100%, 1,330 students, 79% FRL) — zoned schools at 85% FRL track the district average.
- Market conditions: Rents rising fast (+5.8%/yr); 58 active listings in the ZIP; 1 comparable units currently listed for rent nearby; 369 units permitted in Wyandotte County in 2024 (236 in 5+ unit buildings).
- At $2,001/mo this rent would consume 46% of the median local household income ($52k/yr) (locally 805% of renters already pay >50% of income on rent) — very limited rent-growth headroom before tenants either downsize or default.
Forward outlook
- Local home prices are declining (-3.0%/yr); year-one equity from $2k of loan paydown is wiped out by about $7k of value loss. Plan a longer hold.
- Wyandotte County population projected at +17% by 2050 — long-run rental-demand tailwind backs the buy-and-hold thesis.
Negotiation context
- It's been on market 41 days — a 3% lower offer ($222k) is reasonable based on typical stale-listing flexibility.
- 7 sale attempts since 18y ago with the ask held roughly flat each time — persistent listings suggest the price (not the market) is what's stuck; bring a comps-based counter.
Risks & watch-outs
- Watch-outs: built in 1954 — expect roof / HVAC / electrical / plumbing capex.
Questions for the listing agent
- It's been on market 41 days. Have you received any prior offers? Is the seller open to a 13% concession, seller financing, or rate buy-down credit?
- Built in 1954 — when were the roof, HVAC, electrical panel, plumbing, and water heater last replaced?
- Is there a deadline driving the sale (1031 exchange, divorce, estate, relocation)? That informs how much negotiation room exists.
- Schools are F-rated, which usually means shorter tenancies and higher turnover. Who's the typical renter profile here, and what's been the actual vacancy rate?
- Crime grade is F in this area — have there been break-ins, vandalism, or insurance claims at this property in the last 3 years? What carrier currently insures it and at what premium?
- The area grade is low — what's the realistic commute time and amenity access for the typical tenant pool here? Any planned neighborhood developments (good or bad) we should know about?
- What's the average days-on-market for RENTAL listings here right now (not sales)? A rising rental-DOM trend means longer vacancies and softer asking-rent achievability than the comps imply.
- What's the recent tenant-quality profile in this submarket — average credit score on applications, eviction rate, late-payment / NSF rate, and stable-employment percentage? A property-management company in the area should have these aggregated.
- How much new for-sale + rental construction is in the pipeline within 1–3 miles? Heavy new supply typically softens prices + rents 12–24 months out; constrained supply supports both.
Investment metrics
- 1% rule
- 0.87% ✗
- Cap rate
- 6.92%
- Cash-on-cash
- 2.25%
- DSCR
- 1.10
- GRM
- 9.5
CMA / ARV
No comps found within radius.
Projected returns pro-forma
-3.0% appreciation · 5.78% rent growth · sell at horizon
- IRR
- -9.9%
- Equity multiple
- 0.63×
- Total profit
- $-23,739
- Equity at exit
- $34,145
- IRR
- 2.7%
- Equity multiple
- 1.22×
- Total profit
- $14,003
- Equity at exit
- $19,800
Cash invested: $64,120 (down + closing). Projections, not guarantees.
Landlord ↔ Tenant lean methodology
- Overall (STATE)
- 83 Strongly Landlord-Friendly
- State Kansas
- 83 Strongly Landlord-Friendly · R+10
- County
- — inherits STATE
- City
- — inherits STATE
ZIP-level market 66103
- Home prices YoY
- -20.2%
- Rents YoY
- 5.8%
- Active inventory
- 58
- Price-to-rent
- 9.5×
Monthly cashflow live
- Estimated rent
- $2,001 medium interval (Pro) →
- Mortgage (P&I)
- −$1,201
- Tax from tax record
- −$164 /mo · $1,971/yr
- Insurance
- −$95
- HOA
- −$0
- Vacancy / Maint / Mgmt
- −$420
- Net cashflow
- $120
Break-even live
Sensitivity live
| Price | -10% $250 | -5% $185 | +0% $120 | +5% $55 | +10% $-9 |
|---|---|---|---|---|---|
| Rent | -10% $-38 | -5% $41 | +0% $120 | +5% $199 | +10% $278 |
| Rate | -1.0pp $236 | -0.5pp $179 | base $120 | +0.5pp $61 | +1.0pp $1 |
UW: 25.0% down · 7.5% · 30yr · 1.5% tax · 5.0% vac · 8.0% maint · 8.0% mgmt
Financing live
Cash to close
- Down payment
- $57,250
- Closing costs
- $6,870
- Reserves months
- —
- Total cash needed
- —
Loan-product check · same deal, 3 products live
Conventional
25% down · 7.5% · 30yr
- Down + closing
- —
- Monthly P&I
- —
- Monthly cashflow
- —
- DSCR
- —
- Eligible?
- —
Personal DTI + credit; lowest rate.
DSCR
20% down · 8.5% · 30yr
- Down + closing
- —
- Monthly P&I
- —
- Monthly cashflow
- —
- DSCR
- —
- Eligible?
- —
No personal income docs; deal must DSCR.
Hard money
10% down · 12.0% · 12mo
- Down + closing
- —
- Monthly P&I
- —
- Monthly cashflow
- —
- DSCR
- —
- Eligible?
- —
Short-term bridge; refi at stabilization.
Rent comps 1 comps
| Address | Beds | Baths | Sqft | Rent | $/sqft | DOM | Units | Dist |
|---|---|---|---|---|---|---|---|---|
| 3600 Rainbow Blvd Kansas City, KS | 2.0 | 1.0–2.0 | 811 | $3,310 | $4.08 | 12d | 38 | 1.23mi |
Listing history 30 events
-
2026-06-16status $229,000 Pending 41 DOM
-
2026-06-15days on market $229,000 Active 41 DOM
-
2026-06-13days on market $229,000 Active 39 DOM
-
2026-06-13days on market $229,000 Active 38 DOM
-
2026-06-09days on market $229,000 Active 35 DOM
-
2026-06-08days on market $229,000 Active 34 DOM
-
2026-06-07days on market $229,000 Active 33 DOM
-
2026-06-05remarks 395-char remark
-
2026-06-05days on market $229,000 Active 30 DOM
-
2026-06-03days on market $229,000 Active 29 DOM
-
2026-06-02days on market $229,000 Active 28 DOM
-
2026-06-01days on market $229,000 Active 27 DOM
-
2026-05-31days on market $229,000 Active 26 DOM
-
2026-05-05$229,000 Active
-
2026-02-09historical
-
2026-02-03price $155,000
-
2026-01-17price $160,000
-
2026-01-10price $170,000
-
2025-12-13$175,000 Active
-
2025-06-23historical
-
2025-06-09$675,000 Active
-
2019-05-09historical
-
2019-05-01$360,000 Active
-
2013-01-04historical
-
2012-11-27$40,000
-
2009-03-06soldstatus
-
2009-01-26$23,000
-
2008-04-25$45,000
-
2005-04-29soldstatus
-
2004-01-29soldstatus
ⓘ Source: listings_history table (triggers on properties + properties_extension) + one-shot
backfill from property_details.listing_events for pre-trigger history.
Tax reassessment forecast KS · Resets to sale price
- Current annual tax
- $1,971 · $164/mo
- Projected year-2 tax
- $3,229 · $269/mo
- Expected delta
- +$1,258/yr (+$105/mo · 63.8%)
ⓘ Screening estimate from a state-policy table — verify with the county assessor before closing.
Climate risk First Street
- Flood 1/10 Low FEMA zone X (unshaded) · 0% chance over 30 yrs
- Wildfire 1/10 Low
- Heat 4/10 Moderate 6 d/yr ≥106°F today · 15 d/yr by 30 yrs out
- Wind 2/10 Low
- Air quality 3/10 Moderate 2 unhealthy d/yr today · 3 by 30 yrs out
Nearby sold comps map
Loading sold comps map…
Walkable amenities ~0.75 mi
Loading nearby amenities…
Taxation est. · year 1
- Rental income
- $24,012
- − Mortgage interest
- −$12,828
- − Property taxes
- −$1,971
- − Insurance
- −$1,145
- − Repairs & maintenance
- −$1,921
- − Management
- −$1,921
- − Depreciation
- −$6,662
- Taxable loss
- −$2,435
- Est. tax savings @ 24.0%
- +$584
- After-tax cash flow
- $2,028/yr
For passive investors: Depreciation is non-cash, so a rental often shows a tax loss while cash-flowing — sheltering income. Rental losses are passive: they offset passive income freely, and up to $25,000/yr can offset ordinary (W-2) income if you actively participate and your MAGI is under $100k (phasing out to $0 by $150k); unused losses carry forward. On sale, claimed depreciation is recaptured at up to 25%, and gains may owe capital-gains tax (a 1031 exchange can defer both). Figures are a year-1 estimate at your 24.0% rate — not tax advice; consult a CPA.
Schools (NCES district)
- District
- Kansas City
- NCES district ID
- 2007950
- Math proficiency
- 8% ▼ -10.00%
- Reading proficiency
- 15% ▼ -4.00%
- Median HH income
- $34,774
- Composite
- 9.38/100
- National rank
- #9856
- State rank
- #169 of 169 in KS
Livability — Kansas City
- Score
- 72/100
- State rank
- #103
- US rank
- #6054
Category grades
Schools grade is shown separately in the Schools card above.
Census & demographics
- Census place
- Kansas City, KS
- County
- Wyandotte County · 130,206 people
- City population
- 130,206
- Metro
- Kansas City, MO-KS
- Population (ZIP)
- 12,730
- Household income
- $52,479
- Rent vs Own
- Severe rent burden
- 805.0
Population outlook (Wyandotte County) Hauer SSP2
- Today (2025)
- 177,063 people
- By 2030
- 183,212 · +3.5%
- By 2040
- 195,697 · +10.5%
- By 2050
- 207,897 · +17.4%
- By 2075
- 236,169 · +33.4%
- By 2100
- 255,790 · +44.5%
Race, ethnicity, and origin ACS 2023
- Neighborhood character
- Diverse neighborhood (Simpson 0.69)
- Race & ethnicity
- White 45% Hispanic / Latino 31% Two or more races 12% Black 12% Asian 6% Native American 3%
- Hispanic origin (detail)
- Mexican 26% Puerto Rican 1%
- Common ancestry
- Lithuanian 2% Italian 1% Iranian 1%
- Foreign-born
- 16% · Canada, China, South Korea
- Languages at home
- 74% English-only · Spanish 20% Other Indo-European 1% Other Asian/Pacific 1%
Political lean MEDSL · Wyandotte
- 2024 margin
- Strong D (+23.9) · D 61.1% · R 37.3% · Other 1.6%
- 2008→2024 swing
- -17.0pp toward R · 2008: 40.9pp · 2024: 23.9pp
- All cycles
- 2024: D+23.9 2020: D+30.9 2016: D+29.1 2012: D+36.4 2008: D+40.9
Not yet ingested
- Civics
- —
Market trends
- HPI YoY
- ▼ -93.15%
- Current HPI
- 368.8332
- Rent YoY
- ▲ 5.78%
- Metro
- Kansas City, MO-KS
- State GDP YoY
- —
- F500 in state
- 0
Price history
+408.9% since first listed17 events — show timeline
- 2026-05-05 Listed $229,000 Heartland MLS as Distributed by MLS Grid
- 2026-02-09 Listing Removed — Heartland MLS as Distributed by MLS Grid
- 2026-02-03 Price Changed $155,000 Heartland MLS as Distributed by MLS Grid
- 2026-01-17 Price Changed $160,000 Heartland MLS as Distributed by MLS Grid
- 2026-01-10 Price Changed $170,000 Heartland MLS as Distributed by MLS Grid
- 2025-12-13 Listed $175,000 Heartland MLS as Distributed by MLS Grid
- 2025-06-23 Listing Removed — Heartland MLS as Distributed by MLS Grid
- 2025-06-09 Listed $675,000 Heartland MLS as Distributed by MLS Grid
- 2019-05-09 Listing Removed — Heartland MLS as Distributed by MLS Grid
- 2019-05-01 Listed $360,000 Heartland MLS as Distributed by MLS Grid
- 2013-01-04 Listing Removed — Heartland MLS as Distributed by MLS Grid
- 2012-11-27 Listed $40,000 Heartland MLS as Distributed by MLS Grid
- 2009-03-06 Sold (MLS) — Heartland MLS as Distributed by MLS Grid
- 2009-01-26 Listed $23,000 Heartland MLS as Distributed by MLS Grid
- 2008-04-25 Listed $45,000 Heartland MLS as Distributed by MLS Grid
- 2005-04-29 Sold (Public Records) — Public Records
- 2004-01-29 Sold (Public Records) — Public Records
Property tax history
+4.6%/yrLatest (2025): $1,971 · +21.2% YoY. Source: county tax records.
Cash-flow waterfall
monthlySold comps — $/sqft
last 12 mo · ≤1 miLoading sold comps…