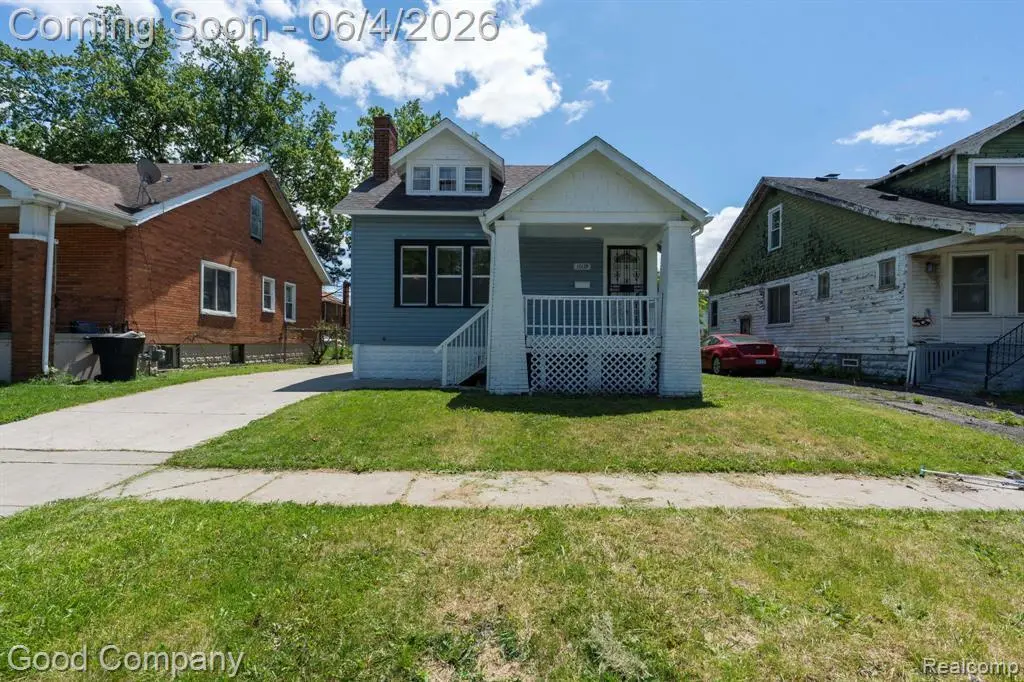
10139 Maplelawn St · Detroit, MI
Flood risk 1/10 · Minimal
- FEMA flood zone
- X (unshaded)
- Chance of flooding over 30 yrs
- 0.0%
- Est. flood insurance / yr
- $507 – $1,088
Fire risk 1/10 · Minimal
- Est. fire insurance / yr
- $784 – $1,456
Heat risk 3/10 · Minor
- Hot days now (above 97°F)
- 7 days/yr
- Hot days in 30 yrs
- 15 days/yr
Wind risk 2/10 · Minimal
- Chance of severe wind over 30 yrs
- —
Air-quality risk 3/10 · Minor
- Unhealthy air days now
- 2 days/yr
- Unhealthy air days in 30 yrs
- 5 days/yr
Risk factors via First Street. Map © Google.
Why this score? — see what drove the C grade
The composite is a weighted blend of 9 inputs, each scored 0–100. Each bar is that input's sub-score; the figure is the points it added to the 100-point composite (weight × sub-score).
- Cash flow +18.5/30.0
- Appreciation +10.0/10.0
- ARV discount +7.5/15.0
- DSCR +5.8/10.0
- 1% rule +5.0/10.0
- Livability +3.7/5.0
- Rent growth +2.5/5.0
- Condition / age +2.5/5.0
- Schools +1.3/10.0
$109,900
🖨 Deal sheet 📄 Offer letter ✓ Due diligence
Listing remarks MLS
This three bedroom, one bathroom bungalow is an investor's dream. Home has great basics but needs cosmetic rehabilitation. Wood floors, fireplace, full basement. Fixer upper opportunity. Garage may need to be demolished. RESERVE AUCTION PROPERTY- Property sold “AS-IS” without contingencies, repairs, warranties, guarantees or representation as to listing accuracy, property information, photo or other depiction included or described herein. Inspect before bidding.
Key facts
- 4,356 sq ft lot
- Built 1926
- Listed 11 days
Property features AI
Finance
- Other: Has home warranty
Exterior
- Utilities: Public water
- Home design: Residential property; 1 1/2-story structure; Built in 1926; Frontage approximately 44 feet
- Construction: Vinyl siding exterior; Basement foundation
- Exterior features: Vinyl siding; Paved street access
Interior
- Bedrooms: Bedroom 1 (Entry): 11 x 10, wood flooring; Bedroom 2 (Entry): 15 x 12; Bedroom 3 (Entry): 10 (width listed)
- Flooring: Wood flooring in at least one bedroom; Ceramic flooring in one bathroom; Carpet in second bathroom
- Bathrooms: 2 full bathrooms; Bathroom 1 (Entry): ceramic floor, approx. 10 x 5; Bathroom 2 (Second): carpeted floor, approx. 20 x 15
- Heating & cooling: Forced air heating; Natural gas fuel
- Interior features: Total of 5 rooms; Unfinished basement
Neighborhood map
What this means for you Summary
Snapshot
- This is a 3-bed/1.0-bath single-family listed at $110k.
Deal economics
- At list price, monthly cash flow is $105 ($1k/yr) — positive.
- The deal already cash-flows at list — no discount required.
- To meet the 1% rule (rent ≥ 1% of price), the offer needs to be $109k (0.5% below list).
- Recommended offer: $109k (0.5% below list) — sets the bar for 1% rule.
- Cap rate 7.4% vs local median 10.2% in Detroit — below-typical yield; the buyer is paying a premium for something (appreciation thesis, condition, location) that the cap rate doesn't capture.
Location & tenants
- Location reads 73/100 on livability (#218 in MI) — a middle-class / working-renter tenant base. Strengths: amenities A+, commute A+, cost of living A+; Watch: schools F, crime F, employment F.
- Detroit Public Schools Community District (urban): math 10% / reading 24% proficiency, ranked #499 of 540 in MI (top 92%) — low school quality limits family demand, transient renter base, plan for 1-2y turnover; 90% free/reduced lunch — lower-income household profile, screen leases tightly.
- Market conditions: 244 active listings in the ZIP; 26 comparable units currently listed for rent nearby; rentals lingering (median 44d on market — plan ~5-8 weeks vacancy on turnover, expect pricing pressure); 58% of comp listings sitting > 30 days — soft ceiling on asking rent; lower-income renter base — watch delinquency; 2,639 units permitted in Wayne County in 2024 (1,216 in 5+ unit buildings).
- This rent runs 38% of the median local income ($34k/yr) — at the standard rent-burdened threshold; future hikes will face affordability resistance.
Forward outlook
- In year one you build about $12k of equity ($760 loan paydown + $11k appreciation (10.0% local appreciation)).
- Wayne County population projected at -17% by 2050 — secular population decline; favor cash flow + early exit over multi-decade hold.
- At projected returns (10.0% appreciation + 3.0% rent growth), your $31k cash investment doubles in ~3 years — after that, you're playing with house money.
- By year 4, paydown + projected appreciation supports a ~$42k cash-out refi (75% LTV) — recoverable capital for the next deal without selling this one.
Negotiation context
- Only 11 days on market — expect competitive offers; lowballing is unlikely to land.
- 2 sale attempts since 2y ago; this cycle's ask is 591% above the opening price — seller raised mid-cycle; expect resistance to lowballs.
- Current owner paid $15k; list at $110k implies a 633% gain — meaningful room to come down on a strong offer.
Risks & watch-outs
- Watch-outs: built in 1926 — expect roof / HVAC / electrical / plumbing capex.
Questions for the listing agent
- Built in 1926 — when were the roof, HVAC, electrical panel, plumbing, and water heater last replaced?
- Is there a deadline driving the sale (1031 exchange, divorce, estate, relocation)? That informs how much negotiation room exists.
- Schools are F-rated, which usually means shorter tenancies and higher turnover. Who's the typical renter profile here, and what's been the actual vacancy rate?
- Crime grade is F in this area — have there been break-ins, vandalism, or insurance claims at this property in the last 3 years? What carrier currently insures it and at what premium?
- What's the average days-on-market for RENTAL listings here right now (not sales)? A rising rental-DOM trend means longer vacancies and softer asking-rent achievability than the comps imply.
- What's the recent tenant-quality profile in this submarket — average credit score on applications, eviction rate, late-payment / NSF rate, and stable-employment percentage? A property-management company in the area should have these aggregated.
- How much new for-sale + rental construction is in the pipeline within 1–3 miles? Heavy new supply typically softens prices + rents 12–24 months out; constrained supply supports both.
Investment metrics
- 1% rule
- 1.00% ✗
- Cap rate
- 7.43%
- Cash-on-cash
- 4.08%
- DSCR
- 1.18
- GRM
- 8.4
CMA / ARV
- ARV (on-the-fly)
- $44,688
- Comps found
- 12
Show comp detail 12 sales within ~0.75 mi
| Address | Dist | Beds/Ba | Sqft | Sold | Price | $/sf | Match |
|---|---|---|---|---|---|---|---|
| 11337 Steel St | 0.51mi | 3/1.0 | 880 (-4%) | 1mo | $35,000 | $40 | 70 |
| 9265 Birwood St | 0.46mi | 3/1.0 | 908 (-0%) | 14mo | $57,000 | $63 | 66 |
| 8691 Elmira St | 0.24mi | 3/1.0 | 1,001 (+10%) | 10mo | $35,000 | $35 | 65 |
| 9366 Steel St | 0.57mi | 3/1.0 | 900 (-1%) | 10mo | $59,000 | $66 | 64 |
| 11695 Kentucky St | 0.40mi | 2/1.5 (-1) | 912 (0%) | 14mo | $25,000 | $27 | 62 |
| 11437 Manor St | 0.39mi | 3/1.0 | 1,006 (+10%) | 5mo | $53,900 | $54 | 60 |
| 11318 Littlefield St | 0.73mi | 2/1.0 (-1) | 877 (-4%) | 5mo | $57,500 | $66 | 50 |
| 12440 Mendota St | 0.71mi | 3/1.0 | 1,035 (+14%) | 2mo | $39,999 | $39 | 43 |
| 10031 Sorrento St | 0.56mi | 3/1.0 | 1,019 (+12%) | 15mo | $50,000 | $49 | 42 |
| 11717 Kentucky St | 0.42mi | 2/1.0 (-1) | 1,034 (+13%) | 14mo | $13,000 | $13 | 42 |
| 9359 Steel St | 0.59mi | 3/1.0 | 802 (-12%) | 15mo | $40,000 | $50 | 40 |
| 9115 Roselawn St | 0.75mi | 3/1.0 | 1,025 (+12%) | 13mo | $50,000 | $49 | 34 |
Match score weights: distance 35% · size 25% · config 20% · recency 20%. Top-matched comps best support the ARV.
Projected returns pro-forma
10.0% appreciation · 3.0% rent growth · sell at horizon
- IRR
- 27.2%
- Equity multiple
- 3.16×
- Total profit
- $66,528
- Equity at exit
- $99,007
- IRR
- 23.8%
- Equity multiple
- 7.20×
- Total profit
- $190,712
- Equity at exit
- $213,512
Cash invested: $30,772 (down + closing). Projections, not guarantees.
Landlord ↔ Tenant lean methodology
- Overall (STATE)
- 62 Landlord-Friendly
- State Michigan
- 62 Landlord-Friendly · EVEN
- County
- — inherits STATE
- City
- — inherits STATE
ZIP-level market 48204
- Home prices YoY
- 18.5%
- Active inventory
- 244
- Price-to-rent
- 8.4×
Monthly cashflow live
- Estimated rent
- $1,094 high interval (Pro) →
- Mortgage (P&I)
- −$576
- Tax est. 1.5%
- −$137 /mo · $1,648/yr
- Insurance
- −$46
- HOA
- −$0
- Vacancy / Maint / Mgmt
- −$230
- Net cashflow
- $105
Break-even live
UW: 25.0% down · 7.5% · 30yr · 1.5% tax · 5.0% vac · 8.0% maint · 8.0% mgmt
Financing live
Cash to close
- Down payment
- $27,475
- Closing costs
- $3,297
- Reserves months
- —
- Total cash needed
- —
Loan-product check · same deal, 3 products live
Conventional
25% down · 7.5% · 30yr
- Down + closing
- —
- Monthly P&I
- —
- Monthly cashflow
- —
- DSCR
- —
- Eligible?
- —
Personal DTI + credit; lowest rate.
DSCR
20% down · 8.5% · 30yr
- Down + closing
- —
- Monthly P&I
- —
- Monthly cashflow
- —
- DSCR
- —
- Eligible?
- —
No personal income docs; deal must DSCR.
Hard money
10% down · 12.0% · 12mo
- Down + closing
- —
- Monthly P&I
- —
- Monthly cashflow
- —
- DSCR
- —
- Eligible?
- —
Short-term bridge; refi at stabilization.
Rent comps 26 comps
| Address | Beds | Baths | Sqft | Rent | $/sqft | DOM | Units | Dist |
|---|---|---|---|---|---|---|---|---|
| 10345 Crocuslawn Ave Unit 2 Detroit, MI | 2.0 | 1.0 | 850 | $950 | $1.12 | 44d | 1 | 0.16mi |
| 10303 Morley St #1 Detroit, MI | 2.0 | 1.0 | 950 | $950 | $1.00 | 44d | 1 | 0.24mi |
| 10002 Manor Unit 1 Detroit, MI | 2.0 | 1.0 | 1000 | $1,050 | $1.05 | 44d | 1 | 0.29mi |
| 10002 Manor Unit 2 Detroit, MI | 3.0 | 1.0 | 1100 | $1,150 | $1.05 | 44d | 1 | 0.29mi |
| 9558 Meyers Rd Detroit, MI | 3.0 | 1.0 | 950 | $1,150 | $1.21 | 44d | 1 | 0.40mi |
| 9353 Kentucky St Detroit, MI | 2.0 | 1.0 | 800 | $999 | $1.25 | 17d | 1 | 0.41mi |
| 12775 Plymouth Rd Unit 16 Detroit, MI | 2.0 | 1.0 | 1009 | $825 | $0.82 | 44d | 1 | 0.46mi |
| 12468 Mendota St Detroit, MI | 2.0 | 1.0 | 1100 | $1,000 | $0.91 | 24d | 1 | 0.71mi |
| 12468 Mendota St Detroit, MI | 2.0 | 1.0 | 1100 | $1,100 | $1.00 | 44d | 1 | 0.71mi |
| 9022 Northlawn St Detroit, MI | 2.0 | 1.0 | 1100 | $1,300 | $1.18 | 24d | 1 | 0.77mi |
| 9340 Hartwell St Detroit, MI | 3.0 | 1.0 | 1000 | $1,364 | $1.36 | 44d | 1 | 0.87mi |
| 13717 Keal St Detroit, MI | 2.0 | 1.0 | 799 | $1,000 | $1.25 | 44d | 1 | 0.94mi |
| 8544 Cloverlawn St Detroit, MI | 2.0 | 1.0 | 800 | $800 | $1.00 | 17d | 1 | 1.02mi |
| 8283 Pinehurst St Unit 2 Detroit, MI | 2.0 | 1.0 | 1000 | $900 | $0.90 | 44d | 1 | 1.05mi |
| 12032 Santa Rosa Dr Unit 1 Detroit, MI | 3.0 | 1.0 | 900 | $1,423 | $1.58 | 5d | 1 | 1.12mi |
| 12019 Stoepel St Detroit, MI | 2.0 | 1.0 | 1000 | $943 | $0.94 | 5d | 1 | 1.14mi |
| 8353 Alpine St Detroit, MI | 2.0 | 1.0 | 1000 | $1,050 | $1.05 | 44d | 1 | 1.18mi |
| 9917 Woodside St Apt 1 Detroit, MI | 2.0 | 1.0 | 800 | $800 | $1.00 | 44d | 1 | 1.18mi |
| 12415 Monica St Detroit, MI | 2.0 | 1.0 | 1000 | $1,200 | $1.20 | 44d | 1 | 1.20mi |
| 9789 Chenlot St Unit 1 Detroit, MI | 2.0 | 1.0 | 1000 | $1,000 | $1.00 | 5d | 1 | 1.33mi |
| 12663 Stoepel St Unit 1 Detroit, MI | 2.0 | 1.0 | 750 | $975 | $1.30 | 18d | 1 | 1.33mi |
| 12663 Stoepel St Detroit, MI | 2.0 | 1.0 | 1100 | $1,050 | $0.95 | 22d | 1 | 1.33mi |
| 9590 Marlowe St Detroit, MI | 2.0 | 1.0 | 877 | $1,430 | $1.63 | 44d | 1 | 1.42mi |
| 2926 Ewald Cir Detroit, MI | 2.0 | 1.0 | 800 | $900 | $1.12 | 17d | 1 | 1.45mi |
| 13620 Tuller St Detroit, MI | 4.0 | 1.0 | 1064 | $1,374 | $1.29 | 13d | 1 | 1.46mi |
| 14740 W Chicago Unit B Detroit, MI | 2.0 | 1.0 | 900 | $845 | $0.94 | 44d | 1 | 1.49mi |
Listing history 13 events
-
2026-06-19status $109,900 Active 11 DOM
-
2026-06-15statusdays on market $109,900 Pending 11 DOM
-
2026-06-13days on market $109,900 Active 10 DOM
-
2026-06-13days on market $109,900 Active 9 DOM
-
2026-06-09days on market $109,900 Active 6 DOM
-
2026-06-08days on market $109,900 Active 5 DOM
-
2026-06-08price $109,900 Active 4 DOM
-
2026-06-07days on market $99,900 Active 4 DOM
-
2026-06-04statusdays on market $99,900 Active 1 DOM
-
2026-06-03days on market $99,900 Coming Soon 5 DOM
-
2026-06-02days on market $99,900 Coming Soon 4 DOM
-
2026-06-01days on market $99,900 Coming Soon 3 DOM
-
2026-05-31days on market $99,900 Coming Soon 2 DOM
ⓘ Source: listings_history table (triggers on properties + properties_extension) + one-shot
backfill from property_details.listing_events for pre-trigger history.
Climate risk First Street
- Flood 1/10 Low FEMA zone X (unshaded) · 0% chance over 30 yrs
- Wildfire 1/10 Low
- Heat 3/10 Moderate 7 d/yr ≥97°F today · 15 d/yr by 30 yrs out
- Wind 2/10 Low
- Air quality 3/10 Moderate 2 unhealthy d/yr today · 5 by 30 yrs out
Nearby sold comps map
Loading sold comps map…
Walkable amenities ~0.75 mi
Loading nearby amenities…
Taxation est. · year 1
- Rental income
- $13,124
- − Mortgage interest
- −$6,156
- − Property taxes
- −$1,648
- − Insurance
- −$550
- − Repairs & maintenance
- −$1,050
- − Management
- −$1,050
- − Depreciation
- −$3,197
- Taxable loss
- −$527
- Est. tax savings @ 24.0%
- +$126
- After-tax cash flow
- $1,381/yr
For passive investors: Depreciation is non-cash, so a rental often shows a tax loss while cash-flowing — sheltering income. Rental losses are passive: they offset passive income freely, and up to $25,000/yr can offset ordinary (W-2) income if you actively participate and your MAGI is under $100k (phasing out to $0 by $150k); unused losses carry forward. On sale, claimed depreciation is recaptured at up to 25%, and gains may owe capital-gains tax (a 1031 exchange can defer both). Figures are a year-1 estimate at your 24.0% rate — not tax advice; consult a CPA.
Schools (NCES district)
- District
- Detroit Public Schools Community District
- NCES district ID
- 2601103
- Math proficiency
- 10% ▼ -2.00%
- Reading proficiency
- 24% ▲ 6.00%
- Median HH income
- $25,815
- Composite
- 13.06/100
- National rank
- #9564
- State rank
- #499 of 540 in MI
Livability — Detroit
- Score
- 73/100
- State rank
- #218
- US rank
- #5427
Category grades
Schools grade is shown separately in the Schools card above.
Census & demographics
- Census place
- Detroit, MI
- County
- Wayne County · 1,562,939 people
- City population
- 572,865
- Metro
- Detroit-Warren-Dearborn, MI
- Population (ZIP)
- 20,696
- Household income
- $34,468
- Rent vs Own
- Severe rent burden
- 1418.0
Population outlook (Wayne County) Hauer SSP2
- Today (2025)
- 1,675,273 people
- By 2030
- 1,620,300 · -3.3%
- By 2040
- 1,502,341 · -10.3%
- By 2050
- 1,384,039 · -17.4%
- By 2075
- 1,124,592 · -32.9%
- By 2100
- 881,193 · -47.4%
Race, ethnicity, and origin ACS 2023
- Neighborhood character
- Predominantly Black (86%)
- Race & ethnicity
- Black 86% Two or more races 7% Hispanic / Latino 5% White 4% Native American 2%
- Hispanic origin (detail)
- Mexican 4%
- Common ancestry
- Hispanic 1% Romanian 1%
- Foreign-born
- 2% · Canada
- Languages at home
- 95% English-only · Spanish 4%
Political lean MEDSL · Wayne
- 2024 margin
- Strong D (+29.0) · D 62.7% · R 33.7% · Other 3.6%
- 2008→2024 swing
- -20.5pp toward R · 2008: 49.5pp · 2024: 29.0pp
- All cycles
- 2024: D+29.0 2020: D+38.1 2016: D+37.3 2012: D+46.9 2008: D+49.5
Not yet ingested
- Civics
- —
Market trends
- HPI YoY
- ▲ 36.51%
- Current HPI
- 234.0465
- Rent YoY
- —
- Metro
- Detroit-Warren-Dearborn, MI
- State GDP YoY
- ▲ 1.37%
- F500 in state
- 28
Industry mix (Fortune 500 HQ in MI)
| Industry | F500 HQs | Revenue |
|---|---|---|
| Automotive Parts | 3 | $48B |
|
||
| Automotive | 2 | $372B |
|
||
| Chemicals | 1 | $45B |
|
||
| Automotive Retail | 1 | $29B |
|
||
| Healthcare / Medical Devices | 1 | $23B |
|
||
| Automotive Technology | 1 | $20B |
|
||
Price history
+528.3% since first listed8 events — show timeline
- 2026-05-29 Coming Soon $99,900 MiRealSource-MiMLS
- 2025-01-31 Sold (MLS) $15,000 MiRealSource-MiMLS
- 2025-01-31 Sold (MLS) $15,000 REALCOMP
- 2024-12-17 Pending — REALCOMP
- 2024-11-06 Pending — MiRealSource-MiMLS
- 2024-11-06 Pending — REALCOMP
- 2024-10-24 Listed $15,900 MiRealSource-MiMLS
- 2024-10-24 Listed $15,900 REALCOMP
Property tax history
-29.4%/yrLatest (2025): $21 · -41.2% YoY. Source: county tax records.
Cash-flow waterfall
monthlySold comps — $/sqft
last 12 mo · ≤1 miLoading sold comps…