 🏢 Co-op
3 Fordham Hill Oval Unit 14F · New York, NY
Flood risk 1/10 · Minimal
- FEMA flood zone
- X (unshaded)
- Chance of flooding over 30 yrs
- 0.0%
- Est. flood insurance / yr
- $507 – $1,088
Fire risk 1/10 · Minimal
- Est. fire insurance / yr
- $691 – $1,283
Heat risk 6/10 · Moderate
- Hot days now (above 99°F)
- 7 days/yr
- Hot days in 30 yrs
- 14 days/yr
Wind risk 6/10 · Moderate
- Chance of severe wind over 30 yrs
- 27.0%
Air-quality risk 3/10 · Minor
- Unhealthy air days now
- 3 days/yr
- Unhealthy air days in 30 yrs
- 4 days/yr
Risk factors via First Street. Map © Google.
Why this score? — see what drove the C- grade
The composite is a weighted blend of 9 inputs, each scored 0–100. Each bar is that input's sub-score; the figure is the points it added to the 100-point composite (weight × sub-score).
- Cash flow +11.1/30.0
- 1% rule +10.0/10.0
- ARV discount +7.5/15.0
- Appreciation +5.3/10.0
- Schools +5.0/10.0
- Rent growth +4.2/5.0
- Livability +3.8/5.0
- DSCR +3.2/10.0
- Condition / age +2.5/5.0
$222,500
🖨 Deal sheet 📄 Offer letter ✓ Due diligence
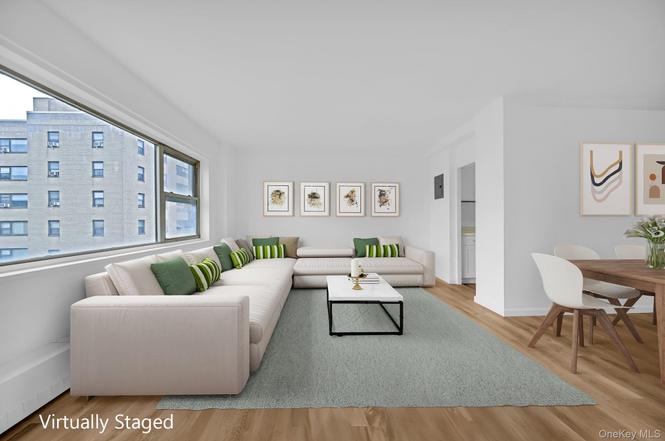
Listing remarks
$43,500 BUYER INCENTIVE TOWARDS MONTHLY MAINTENANCE PRE-PAIDS OR CLOSING COSTS! Coops requirements: DTI 33% minimum, 680 plus credit score, $95,000 minimum income. This bright and beautiful, newly renovated 2-bedroom/1.5 bath cooperative apartment is perfectly situated for access to Manhattan, Westchester, and other amenities the Bronx has to offer. The flexible floor plan allows for easy flow between living and dining spaces, with new, gorgeous water-resistant LVP floors installed throughout the apartment. The main space is bathed in south-facing light, with great views towards Manhattan and the Bronx, and one of the two bedroom has west-facing exposure for brilliant sunsets and partial vi
Key facts
- New fitness center
- Galley style kitchen
- $1,730 HOA
Tags
Property features AI
Finance
- HOA & community: Part of Fordham Hill Owners Corp; Monthly association fee (includes utilities, cable TV, common area maintenance, electricity, exterior maintenance, grounds care, heat, hot water, internet, sewer, snow removal, trash, water); Building amenities: elevators, fitness center, gated entry, landscaping, grounds maintenance
Exterior
- Parking: No carport
- Utilities: Public sewer; Water connected and available; Electricity available; Natural gas available; Cable available; Trash collection (public)
- Home design: Stock cooperative; One level; Updated/remodeled
- Construction: Block construction materials; Foundations: block, brick/mortar, concrete perimeter
- Exterior features: Block construction; Not waterfront
Interior
- Kitchen: Gas oven; Pantry; Quartz/Quartzite countertops
- Bedrooms: Total rooms: 4 (includes bedroom count within the room total)
- Flooring: Vinyl flooring; Other flooring types
- Bathrooms: 1 full bathroom; 1 half bathroom
- Heating & cooling: Baseboard heating; Wall/window air conditioning units
- Interior features: Formal dining area; Galley-style kitchen; Open floor plan; Pantry; Quartz/Quartzite counters; Double-pane windows; Finished common basement with walk-out access and storage space; Updated/remodeled condition; Pets allowed (contact for details)
- Laundry & utility: Laundry in basement (common area)
Neighborhood map
What this means for you Summary
Snapshot
- This is a 2-bed/1.5-bath condo listed at $222k.
Deal economics
- At list price, monthly cash flow is $-90 ($-1k/yr) — negative.
- To cash-flow at today's rent, offer at most $209k (5.9% below list).
- Meets the 1% rule at list price ($4k rent vs $222k).
- Recommended offer: $196k (12.0% below list) — sets the bar for market timing.
- Cap rate 5.8% vs local median 2.6% in New York — top-decile yield for the area; either an underpriced asset or a hidden risk that comps aren't pricing in. Stress-test before assuming the spread holds.
Location & tenants
- Location reads 75/100 on livability (#268 in NY, #4,188 nationally) — a middle-class / working-renter tenant base. Strengths: amenities A+, commute A+, health & safety A; Watch: crime F, cost of living F.
- Market conditions: Rents rising fast (+6.7%/yr); 122 active listings in the ZIP; 4 comparable units currently listed for rent nearby; rentals at typical pace (median 25d on market — plan ~3-4 weeks tenant-placement turnaround); 6,929 units permitted in Bronx County in 2024 (6,829 in 5+ unit buildings).
- At $4,022/mo this rent would consume 104% of the median local household income ($46k/yr) (locally 9659% of renters already pay >50% of income on rent) — very limited rent-growth headroom before tenants either downsize or default.
Forward outlook
- In year one you build about $3k of equity ($2k loan paydown + $1k appreciation (0.5% local appreciation)).
- Bronx County population projected at +21% by 2050 — long-run rental-demand tailwind backs the buy-and-hold thesis.
- By year 10, paydown + projected appreciation supports a ~$31k cash-out refi (75% LTV) — recoverable capital for the next deal without selling this one.
Negotiation context
- It's been on market 391 days — a 12% lower offer ($196k) is reasonable based on typical stale-listing flexibility.
- 3 sale attempts; this cycle's ask has dropped $20k (8%) from the opening price — seller is motivated, your offer sets the floor, not the list.
Risks & watch-outs
- Watch-outs: HOA is 43% of rent; built in 1950 — expect roof / HVAC / electrical / plumbing capex.
- Climate carrying-cost: major wind risk, 27% chance of damaging wind over 30y; extreme-heat days projected 7→14/yr by 2055 (HVAC capex compounding) — expect insurance premiums to compound above CPI over the hold.
Questions for the listing agent
- What do current leases actually rent for vs. the listed asking? Can we see a recent rent roll and the last 12 months of T-12 income?
- It's been on market 391 days. Have you received any prior offers? Is the seller open to a 12% concession, seller financing, or rate buy-down credit?
- Built in 1950 — when were the roof, HVAC, electrical panel, plumbing, and water heater last replaced?
- What does the HOA fee cover, when was the last increase, and are there any pending special assessments or reserve-fund shortfalls?
- Any open or pending special assessments — roof, HVAC, plumbing, elevator, façade? What's the per-unit balance and payoff schedule, and is the seller paying it off at close or rolling it to the buyer?
- Why hasn't it sold? Are there any deal-killer items the seller is aware of (foundation, flood, title, zoning, code violations)?
- Is there a deadline driving the sale (1031 exchange, divorce, estate, relocation)? That informs how much negotiation room exists.
- Schools are B-rated — typically a magnet for longer-tenancy family renters. What's the average tenant stay here, and is there a school-zone premium baked into asking?
- Crime grade is F in this area — have there been break-ins, vandalism, or insurance claims at this property in the last 3 years? What carrier currently insures it and at what premium?
- What's the average days-on-market for RENTAL listings here right now (not sales)? A rising rental-DOM trend means longer vacancies and softer asking-rent achievability than the comps imply.
- What's the recent tenant-quality profile in this submarket — average credit score on applications, eviction rate, late-payment / NSF rate, and stable-employment percentage? A property-management company in the area should have these aggregated.
- How much new apartment / multifamily construction is in the pipeline within 1–3 miles? Heavy new supply (>2% of stock underway) typically softens rents 12–24 months out; light construction supports rent growth.
Investment metrics
- 1% rule
- 1.81% ✓
- Cap rate
- 5.81%
- Cash-on-cash
- -1.73%
- DSCR
- 0.92
- GRM
- 4.6
CMA / ARV
No comps found within radius.
Projected returns pro-forma
0.5% appreciation · 6.7% rent growth · sell at horizon
- IRR
- 3.0%
- Equity multiple
- 1.16×
- Total profit
- $9,729
- Equity at exit
- $70,268
- IRR
- 12.7%
- Equity multiple
- 2.76×
- Total profit
- $109,760
- Equity at exit
- $89,126
Cash invested: $62,300 (down + closing). Projections, not guarantees.
Landlord ↔ Tenant lean methodology
- Overall (CITY)
- 0 Strongly Tenant-Friendly
- State New York
- 15 Strongly Tenant-Friendly · D+10
- County
- — inherits STATE
- City New York
- 0 Strongly Tenant-Friendly · D+34
ZIP-level market 10468
- Home prices YoY
- 0.2%
- Rents YoY
- 6.7%
- Active inventory
- 122
- Price-to-rent
- 4.6×
Monthly cashflow live
- Estimated rent
- $4,022 medium interval (Pro) →
- Mortgage (P&I)
- −$1,167
- Tax est. 1.5%
- −$278 /mo · $3,338/yr
- Insurance
- −$93
- HOA
- −$1,730
- Vacancy / Maint / Mgmt
- −$845
- Net cashflow
- $-90
Break-even live
UW: 25.0% down · 7.5% · 30yr · 1.5% tax · 5.0% vac · 8.0% maint · 8.0% mgmt
Financing live
Cash to close
- Down payment
- $55,625
- Closing costs
- $6,675
- Reserves months
- —
- Total cash needed
- —
Loan-product check · same deal, 3 products live
Conventional
25% down · 7.5% · 30yr
- Down + closing
- —
- Monthly P&I
- —
- Monthly cashflow
- —
- DSCR
- —
- Eligible?
- —
Personal DTI + credit; lowest rate.
DSCR
20% down · 8.5% · 30yr
- Down + closing
- —
- Monthly P&I
- —
- Monthly cashflow
- —
- DSCR
- —
- Eligible?
- —
No personal income docs; deal must DSCR.
Hard money
10% down · 12.0% · 12mo
- Down + closing
- —
- Monthly P&I
- —
- Monthly cashflow
- —
- DSCR
- —
- Eligible?
- —
Short-term bridge; refi at stabilization.
Rent comps 4 comps
| Address | Beds | Baths | Sqft | Rent | $/sqft | DOM | Units | Dist |
|---|---|---|---|---|---|---|---|---|
| 405 W 206th St Unit 1202E New York, NY | 3.0 | 2.0 | 900 | $6,250 | $6.94 | 24d | 1 | 0.52mi |
| 2600 Netherland Ave Bronx, NY | 1.0–3.0 | 1.0–2.5 | 1132 | $3,938 | $3.48 | 22d | 3 | 1.02mi |
| 2311 Crotona Ave Apt 1 Bronx, NY | 3.0 | 1.0 | 950 | $3,350 | $3.53 | 20d | 1 | 1.50mi |
| 2311 Crotona Ave Apt 2 Bronx, NY | 3.0 | 1.0 | 950 | $3,350 | $3.53 | 24d | 1 | 1.50mi |
HOA detail condo
- Monthly dues
- $1,730 · $20,760/yr
- Likely covers
- water
- Assessments
- None detected in remarks — confirm with the listing agent.
Listing history 18 events
-
2026-06-18days on market $222,500 Active 391 DOM
-
2026-06-17days on market $222,500 Active 390 DOM
-
2026-06-15days on market $222,500 Active 388 DOM
-
2026-06-13days on market $222,500 Active 386 DOM
-
2026-06-10days on market $222,500 Active 382 DOM
-
2026-06-08days on market $222,500 Active 381 DOM
-
2026-06-03days on market $222,500 Active 376 DOM
-
2026-06-01days on market $222,500 Active 374 DOM
-
2026-05-31pricedays on market $222,500 Active 373 DOM
-
2026-03-21price $225,000
-
2026-03-21status Active
-
2026-03-01historical
-
2026-01-13price $230,000
-
2025-12-19status Active
-
2025-11-21status Pending
-
2025-11-17price $266,000
-
2025-05-17price $235,000
-
2025-04-02$242,500 Active
ⓘ Source: listings_history table (triggers on properties + properties_extension) + one-shot
backfill from property_details.listing_events for pre-trigger history.
Climate risk First Street
- Flood 1/10 Low FEMA zone X (unshaded) · 0% chance over 30 yrs
- Wildfire 1/10 Low
- Heat 6/10 Major 7 d/yr ≥99°F today · 14 d/yr by 30 yrs out
- Wind 6/10 Major 27% chance of damaging wind over 30 yrs
- Air quality 3/10 Moderate 3 unhealthy d/yr today · 4 by 30 yrs out
Nearby sold comps map
Loading sold comps map…
Walkable amenities ~0.75 mi
Loading nearby amenities…
Taxation est. · year 1
- Rental income
- $48,267
- − Mortgage interest
- −$12,463
- − Property taxes
- −$3,338
- − Insurance
- −$1,112
- − Repairs & maintenance
- −$3,861
- − Management
- −$3,861
- − HOA
- −$20,760
- − Depreciation
- −$6,473
- Taxable loss
- −$3,602
- Est. tax savings @ 24.0%
- +$864
- After-tax cash flow
- $-216/yr
For passive investors: Depreciation is non-cash, so a rental often shows a tax loss while cash-flowing — sheltering income. Rental losses are passive: they offset passive income freely, and up to $25,000/yr can offset ordinary (W-2) income if you actively participate and your MAGI is under $100k (phasing out to $0 by $150k); unused losses carry forward. On sale, claimed depreciation is recaptured at up to 25%, and gains may owe capital-gains tax (a 1031 exchange can defer both). Figures are a year-1 estimate at your 24.0% rate — not tax advice; consult a CPA.
Schools (NCES district)
No district data.
Livability — New York
- Score
- 75/100
- State rank
- #268
- US rank
- #4188
Category grades
Schools grade is shown separately in the Schools card above.
Census & demographics
- Census place
- New York, NY
- County
- Bronx County · 1,197,324 people
- City population
- 7,731,280
- Metro
- New York-Newark-Jersey City, NY-NJ-PA
- Population (ZIP)
- 75,557
- Household income
- $46,233
- Rent vs Own
- Severe rent burden
- 9659.0
Population outlook (Bronx County) Hauer SSP2
- Today (2025)
- 1,607,353 people
- By 2030
- 1,681,852 · +4.6%
- By 2040
- 1,824,421 · +13.5%
- By 2050
- 1,945,470 · +21.0%
- By 2075
- 2,187,887 · +36.1%
- By 2100
- 2,244,136 · +39.6%
Race, ethnicity, and origin ACS 2023
- Neighborhood character
- Predominantly Hispanic (76%)
- Race & ethnicity
- Hispanic / Latino 76% Black 17% Two or more races 15% White 3% Asian 2% Native American 2%
- Hispanic origin (detail)
- Mexican 10% Puerto Rican 11% Dominican 45%
- Common ancestry
- Hispanic 1%
- Foreign-born
- 46% · Canada, Vietnam, Jamaica
- Languages at home
- 22% English-only · Spanish 69% French/Haitian/Cajun 1% Other Indo-European 1%
Political lean MEDSL · Bronx
- 2024 margin
- Solid D (+45.4) · D 72.7% · R 27.3%
- 2008→2024 swing
- -32.3pp toward R · 2008: 77.8pp · 2024: 45.4pp
- All cycles
- 2024: D+45.4 2020: D+67.6 2016: D+79.1 2012: D+82.9 2008: D+77.8
Not yet ingested
- Civics
- —
Market trends
- HPI YoY
- ▲ 0.50%
- Current HPI
- 249.8923
- Rent YoY
- ▲ 6.70%
- Metro
- New York-Newark-Jersey City, NY-NJ-PA
- State GDP YoY
- ▲ 2.60%
- F500 in state
- 92
Industry mix (Fortune 500 HQ in NY)
| Industry | F500 HQs | Revenue |
|---|---|---|
| Financial Services | 10 | $950B |
|
||
| Consumer Goods | 9 | $162B |
|
||
| Insurance | 4 | $225B |
|
||
| Telecommunications | 2 | $144B |
|
||
| Pharmaceuticals | 2 | $112B |
|
||
| Media / Entertainment | 2 | $69B |
|
||
Price history
-7.2% since first listed9 events — show timeline
- 2026-03-21 Price Changed $225,000 OneKey® MLS as Distributed by MLS Grid
- 2026-03-21 Relisted — OneKey® MLS as Distributed by MLS Grid
- 2026-03-01 Listing Removed — OneKey® MLS as Distributed by MLS Grid
- 2026-01-13 Price Changed $230,000 OneKey® MLS as Distributed by MLS Grid
- 2025-12-19 Relisted — OneKey® MLS as Distributed by MLS Grid
- 2025-11-21 Pending — OneKey® MLS as Distributed by MLS Grid
- 2025-11-17 Price Changed $266,000 OneKey® MLS as Distributed by MLS Grid
- 2025-05-17 Price Changed $235,000 OneKey® MLS as Distributed by MLS Grid
- 2025-04-02 Listed $242,500 OneKey® MLS as Distributed by MLS Grid
Cash-flow waterfall
monthlySold comps — $/sqft
last 12 mo · ≤1 miLoading sold comps…