16 Fairview Dr · McGehee, AR
Flood risk 5/10 · Moderate
- FEMA flood zone
- X (shaded)
- Chance of flooding over 30 yrs
- 0.49%
- Est. flood insurance / yr
- $507 – $1,088
Fire risk 3/10 · Minor
- Est. fire insurance / yr
- $1,499 – $2,785
Heat risk 6/10 · Moderate
- Hot days now (above 110°F)
- 7 days/yr
- Hot days in 30 yrs
- 20 days/yr
Wind risk 6/10 · Moderate
- Chance of severe wind over 30 yrs
- 27.0%
Air-quality risk 1/10 · Minimal
- Unhealthy air days now
- 0 days/yr
- Unhealthy air days in 30 yrs
- 0 days/yr
Risk factors via First Street. Map © Google.
Why this score? — see what drove the B+ grade
The composite is a weighted blend of 9 inputs, each scored 0–100. Each bar is that input's sub-score; the figure is the points it added to the 100-point composite (weight × sub-score).
- Cash flow +30.0/30.0
- ARV discount +15.0/15.0
- DSCR +10.0/10.0
- 1% rule +9.0/10.0
- Appreciation +4.5/10.0
- Livability +3.3/5.0
- Rent growth +2.5/5.0
- Condition / age +2.5/5.0
- Schools +1.9/10.0
$88,000
🖨 Deal sheet 📄 Offer letter ✓ Due diligence
Listing remarks
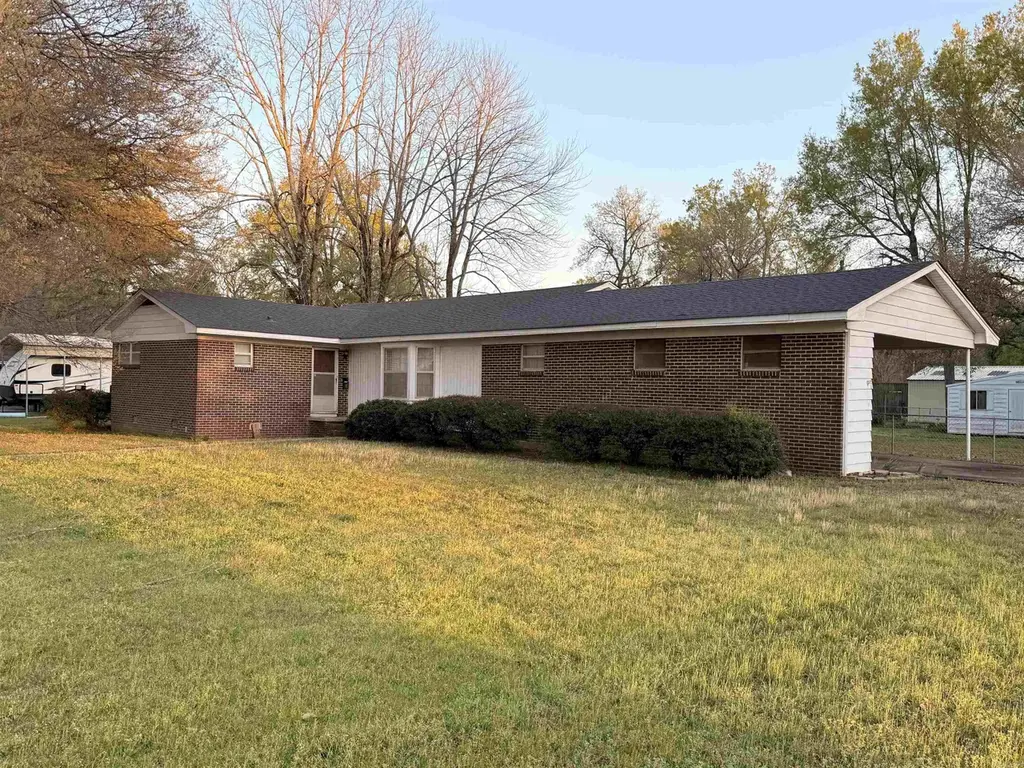
This pleasant 3-bedroom, 2-bath brick home sits on a spacious corner lot in McGehee, Arkansas. Featuring a low-maintenance brick exterior and a covered carport, the home offers a functional layout with comfortable living space. The large, level yard provides plenty of room for outdoor activities and gardening. A generous concrete patio in the backyard and screened porch are perfect for entertaining or relaxing. Additional highlights include a detached storage building and mature trees that frame the property. Ideal for families or investors seeking a solid, well-located home in a quiet neighborhood.
Key facts
- Level yard
- Brick exterior
- Covered carport
Tags
Neighborhood map
What this means for you Summary
Snapshot
- This is a 3-bed/2.0-bath single-family listed at $88k.
Deal economics
- At list price, monthly cash flow is $350 ($4k/yr) — positive.
- The deal already cash-flows at list — no discount required.
- Meets the 1% rule at list price ($1k rent vs $88k).
Location & tenants
- Location reads 66/100 on livability (#122 in AR) — a middle-class / working-renter tenant base. Strengths: cost of living A+, housing A+, health & safety A+; Watch: schools F, amenities F, commute F.
- Mcgehee School District (town): math 24% / reading 23% proficiency, ranked #200 of 238 in AR (top 84%) — low school quality limits family demand, transient renter base, plan for 1-2y turnover; 66% free/reduced lunch — lower-income household profile, screen leases tightly.
- Market conditions: 20 active listings in the ZIP; 4 units permitted in Desha County in 2024 (0 in 5+ unit buildings).
Forward outlook
- Local home prices are declining (-1.0%/yr); year-one equity from $608 of loan paydown is wiped out by about $891 of value loss. Plan a longer hold.
- Desha County population projected at -31% by 2050 — secular population decline; favor cash flow + early exit over multi-decade hold.
- At projected returns (-1.0% appreciation + 3.0% rent growth), your $25k cash investment doubles in ~6 years — after that, you're playing with house money.
Negotiation context
- Only 8 days on market — expect competitive offers; lowballing is unlikely to land.
- Current owner paid $55k; list at $88k implies a 60% gain — meaningful room to come down on a strong offer.
Risks & watch-outs
- Climate carrying-cost: moderate flood risk; major wind risk, 27% chance of damaging wind over 30y; extreme-heat days projected 7→20/yr by 2055 (HVAC capex compounding) — expect insurance premiums to compound above CPI over the hold.
Questions for the listing agent
- Built in 1974 — when were the roof, HVAC, electrical panel, plumbing, and water heater last replaced?
- Is there a deadline driving the sale (1031 exchange, divorce, estate, relocation)? That informs how much negotiation room exists.
- Schools are F-rated, which usually means shorter tenancies and higher turnover. Who's the typical renter profile here, and what's been the actual vacancy rate?
- What's the average days-on-market for RENTAL listings here right now (not sales)? A rising rental-DOM trend means longer vacancies and softer asking-rent achievability than the comps imply.
- What's the recent tenant-quality profile in this submarket — average credit score on applications, eviction rate, late-payment / NSF rate, and stable-employment percentage? A property-management company in the area should have these aggregated.
- How much new for-sale + rental construction is in the pipeline within 1–3 miles? Heavy new supply typically softens prices + rents 12–24 months out; constrained supply supports both.
Investment metrics
- 1% rule
- 1.40% ✓
- Cap rate
- 11.07%
- Cash-on-cash
- 17.07%
- DSCR
- 1.76
- GRM
- 6.0
CMA / ARV
- ARV (on-the-fly)
- $117,059
- Comps found
- 4
Show comp detail 4 sales within ~0.75 mi
| Address | Dist | Beds/Ba | Sqft | Sold | Price | $/sf | Match |
|---|---|---|---|---|---|---|---|
| 16 Fairview Dr | 0.00mi | 3/2.0 | 1,919 (0%) | 1mo | $85,000 | $44 | 99 |
| 10 Shannon | 0.18mi | 3/2.0 | 2,062 (+8%) | 13mo | $50,000 | $24 | 68 |
| 1 Adcock Cir | 0.37mi | 3/2.0 | 1,920 (+0%) | 18mo | $150,000 | $78 | 68 |
| 914 N 2nd St | 0.51mi | 4/2.0 (+1) | 2,123 (+11%) | 8mo | $130,000 | $61 | 46 |
Match score weights: distance 35% · size 25% · config 20% · recency 20%. Top-matched comps best support the ARV.
Projected returns pro-forma
-1.01% appreciation · 3.0% rent growth · sell at horizon
- IRR
- 14.1%
- Equity multiple
- 1.64×
- Total profit
- $15,669
- Equity at exit
- $21,188
- IRR
- 20.0%
- Equity multiple
- 3.01×
- Total profit
- $49,609
- Equity at exit
- $22,203
Cash invested: $24,640 (down + closing). Projections, not guarantees.
Landlord ↔ Tenant lean methodology
- Overall (STATE)
- 92 Strongly Landlord-Friendly
- State Arkansas
- 92 Strongly Landlord-Friendly · R+14
- County
- — inherits STATE
- City
- — inherits STATE
ZIP-level market 71654
- Home prices YoY
- -0.9%
- Active inventory
- 20
- Price-to-rent
- 6.0×
Monthly cashflow live
- Estimated rent
- $1,231 medium interval (Pro) →
- Mortgage (P&I)
- −$461
- Tax from tax record
- −$124 /mo · $1,485/yr
- Insurance
- −$37
- HOA
- −$0
- Vacancy / Maint / Mgmt
- −$258
- Net cashflow
- $350
Break-even live
UW: 25.0% down · 7.5% · 30yr · 1.5% tax · 5.0% vac · 8.0% maint · 8.0% mgmt
Financing live
Cash to close
- Down payment
- $22,000
- Closing costs
- $2,640
- Reserves months
- —
- Total cash needed
- —
Loan-product check · same deal, 3 products live
Conventional
25% down · 7.5% · 30yr
- Down + closing
- —
- Monthly P&I
- —
- Monthly cashflow
- —
- DSCR
- —
- Eligible?
- —
Personal DTI + credit; lowest rate.
DSCR
20% down · 8.5% · 30yr
- Down + closing
- —
- Monthly P&I
- —
- Monthly cashflow
- —
- DSCR
- —
- Eligible?
- —
No personal income docs; deal must DSCR.
Hard money
10% down · 12.0% · 12mo
- Down + closing
- —
- Monthly P&I
- —
- Monthly cashflow
- —
- DSCR
- —
- Eligible?
- —
Short-term bridge; refi at stabilization.
Listing history 4 events
-
2026-04-08status Under Contract
-
2026-03-31$88,000 New Listing
-
2012-07-25soldstatus $55,000
-
1974-05-07soldstatus $22,015
ⓘ Source: listings_history table (triggers on properties + properties_extension) + one-shot
backfill from property_details.listing_events for pre-trigger history.
Tax reassessment forecast AR · Resets to sale price
- Current annual tax
- $1,485 · $124/mo
- Projected year-2 tax
- $1,485 · $124/mo
- Expected delta
- $0/yr ($0/mo · 0.0%)
ⓘ Screening estimate from a state-policy table — verify with the county assessor before closing.
Climate risk First Street
- Flood 5/10 Major FEMA zone X (shaded) · 49% chance over 30 yrs
- Wildfire 3/10 Moderate
- Heat 6/10 Major 7 d/yr ≥110°F today · 20 d/yr by 30 yrs out
- Wind 6/10 Major 27% chance of damaging wind over 30 yrs
- Air quality 1/10 Low 0 unhealthy d/yr today · 0 by 30 yrs out
Nearby sold comps map
Loading sold comps map…
Walkable amenities ~0.75 mi
Loading nearby amenities…
Taxation est. · year 1
- Rental income
- $14,770
- − Mortgage interest
- −$4,929
- − Property taxes
- −$1,485
- − Insurance
- −$440
- − Repairs & maintenance
- −$1,182
- − Management
- −$1,182
- − Depreciation
- −$2,560
- Taxable income
- $2,992
- Est. tax owed @ 24.0%
- −$718
- After-tax cash flow
- $3,487/yr
For passive investors: Depreciation is non-cash, so a rental often shows a tax loss while cash-flowing — sheltering income. Rental losses are passive: they offset passive income freely, and up to $25,000/yr can offset ordinary (W-2) income if you actively participate and your MAGI is under $100k (phasing out to $0 by $150k); unused losses carry forward. On sale, claimed depreciation is recaptured at up to 25%, and gains may owe capital-gains tax (a 1031 exchange can defer both). Figures are a year-1 estimate at your 24.0% rate — not tax advice; consult a CPA.
Schools (NCES district)
- District
- Mcgehee School District
- NCES district ID
- 0509630
- Math proficiency
- 24% ▼ -9.00%
- Reading proficiency
- 23% ▼ -8.00%
- Median HH income
- $29,604
- Composite
- 18.88/100
- National rank
- #8858
- State rank
- #200 of 238 in AR
Livability — McGehee
- Score
- 66/100
- State rank
- #122
- US rank
- #11758
Category grades
Schools grade is shown separately in the Schools card above.
Census & demographics
- Census place
- McGehee, AR
- Population (ZIP)
- 4,290
Population outlook (Desha County) Hauer SSP2
- Today (2025)
- 10,289 people
- By 2030
- 9,472 · -7.9%
- By 2040
- 8,102 · -21.3%
- By 2050
- 7,128 · -30.7%
- By 2075
- 6,222 · -39.5%
- By 2100
- 6,583 · -36.0%
Race, ethnicity, and origin ACS 2023
- Neighborhood character
- Diverse neighborhood (Simpson 0.59)
- Race & ethnicity
- White 48% Black 41% Two or more races 8% Hispanic / Latino 7%
- Hispanic origin (detail)
- Mexican 7%
- Foreign-born
- 0%
- Languages at home
- 95% English-only · Spanish 5%
Political lean MEDSL · Desha
- 2024 margin
- Toss-up / Even · D 46.7% · R 51.5% · Other 1.8%
- 2008→2024 swing
- -17.0pp toward R · 2008: 12.2pp · 2024: -4.8pp
- All cycles
- 2024: R+4.8 2020: D+2.3 2016: D+7.4 2012: D+12.9 2008: D+12.2
Not yet ingested
- Civics
- —
Market trends
- HPI YoY
- ▼ -1.01%
- Current HPI
- 107.7356
- Rent YoY
- —
- Metro
- —
- State GDP YoY
- ▲ 3.80%
- F500 in state
- 10
Industry mix (Fortune 500 HQ in AR)
| Industry | F500 HQs | Revenue |
|---|---|---|
| Retail | 1 | $681B |
|
||
| Food / Agriculture | 1 | $53B |
|
||
| Retail / Energy | 1 | $22B |
|
||
| Transportation / Logistics | 1 | $12B |
|
||
| Energy | 1 | $4B |
|
||
Price history
+299.7% since first listed4 events — show timeline
- 2026-04-08 Pending — CARMLS
- 2026-03-31 Listed $88,000 CARMLS
- 2012-07-25 Sold (Public Records) $55,000 Public Records
- 1974-05-07 Sold (Public Records) $22,015 Public Records
Property tax history
+8.6%/yrLatest (2025): $1,485 · +637.3% YoY. Source: county tax records.
Cash-flow waterfall
monthlySold comps — $/sqft
last 12 mo · ≤1 miLoading sold comps…