 🏷️ Likely Rental
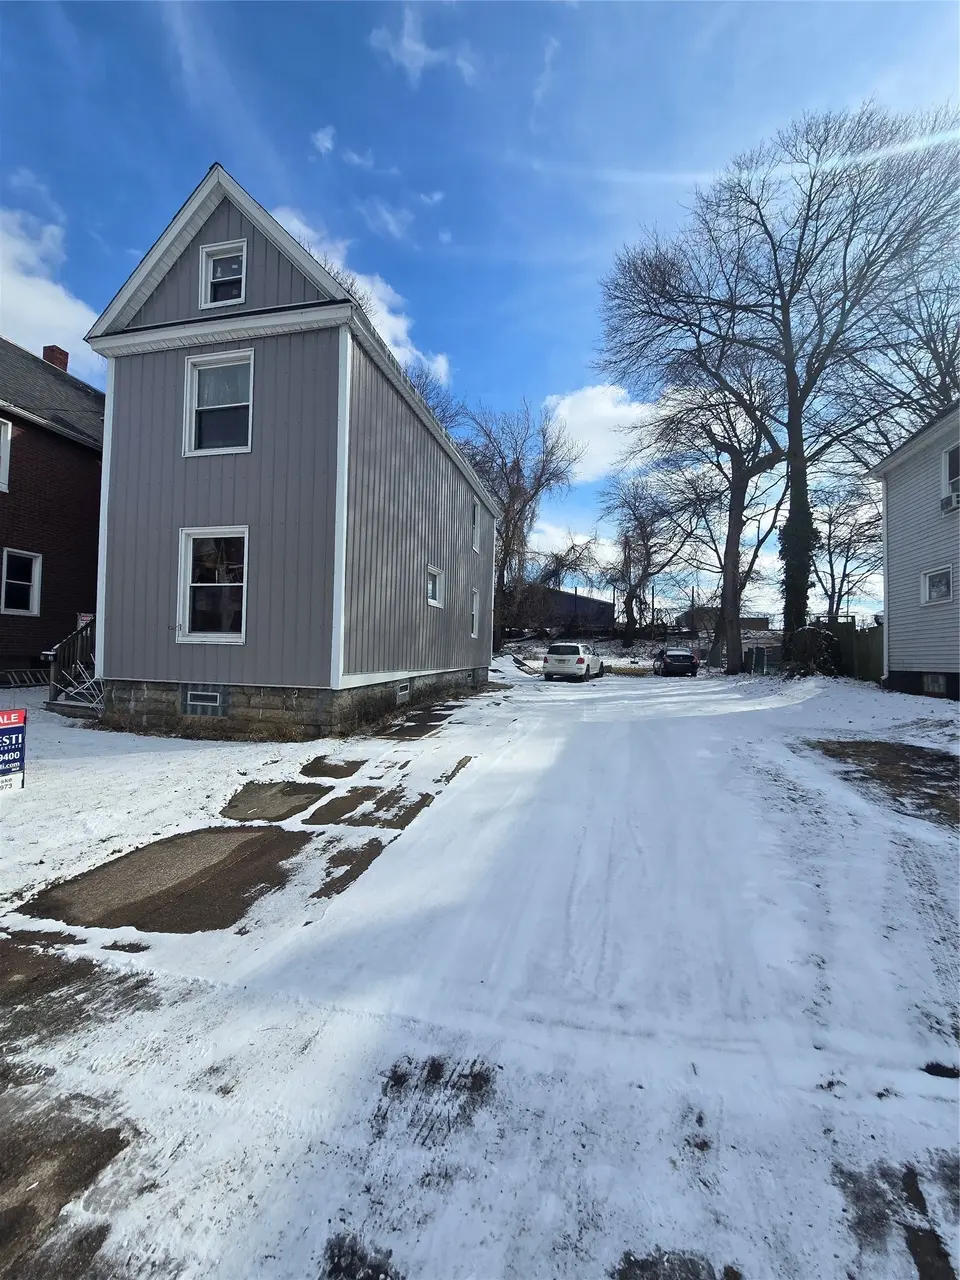
1131 W 11th St · Erie, PA
Flood risk 4/10 · Minor
- FEMA flood zone
- X (unshaded)
- Chance of flooding over 30 yrs
- 0.22%
- Est. flood insurance / yr
- $473 – $860
Fire risk 1/10 · Minimal
- Est. fire insurance / yr
- $511 – $949
Heat risk 2/10 · Minimal
- Hot days now (above 90°F)
- 7 days/yr
- Hot days in 30 yrs
- 17 days/yr
Wind risk 1/10 · Minimal
- Chance of severe wind over 30 yrs
- —
Air-quality risk 2/10 · Minimal
- Unhealthy air days now
- 1 days/yr
- Unhealthy air days in 30 yrs
- 3 days/yr
Risk factors via First Street. Map © Google.
Why this score? — see what drove the B- grade
The composite is a weighted blend of 9 inputs, each scored 0–100. Each bar is that input's sub-score; the figure is the points it added to the 100-point composite (weight × sub-score).
- Cash flow +30.0/30.0
- 1% rule +10.0/10.0
- DSCR +10.0/10.0
- ARV discount +7.5/15.0
- Livability +4.2/5.0
- Rent growth +3.2/5.0
- Condition / age +2.5/5.0
- Schools +1.3/10.0
- Appreciation +0.0/10.0
$59,900
🖨 Deal sheet 📄 Offer letter ✓ Due diligence
Listing remarks MLS
Tenant-occupied single-family investment opportunity with immediate rental income and an additional parcel included. This property offers strong long-term potential for investors looking to expand their portfolio. With room for future updates and improvements, the home presents an opportunity to build equity while generating income. The extra parcel adds flexibility and potential future value. Property is being sold as-is. Advance notice required for showings due to tenant occupancy.
Key facts
- Build equity
- Extra parcel
- Generating income
Tags
Neighborhood map
What this means for you Summary
Snapshot
- This is a 4-bed/1.0-bath single-family listed at $60k.
Deal economics
- At list price, monthly cash flow is $851 ($10k/yr) — positive.
- The deal already cash-flows at list — no discount required.
- Meets the 1% rule at list price ($2k rent vs $60k).
- Recommended offer: $55k (9.0% below list) — sets the bar for market timing.
- Cap rate 23.3% vs local median 5.2% in Erie — top-decile yield for the area; either an underpriced asset or a hidden risk that comps aren't pricing in. Stress-test before assuming the spread holds.
Location & tenants
- Location reads 83/100 on livability (#109 in PA, #840 nationally) — a professional / high-income tenant draw. Strengths: amenities A+, commute A+, cost of living A+; Watch: crime D+, employment F.
- Erie City SD (urban): math 12% / reading 19% proficiency, ranked #510 of 539 in PA (top 95%) — low school quality limits family demand, transient renter base, plan for 1-2y turnover; 81% free/reduced lunch — lower-income household profile, screen leases tightly.
- Market conditions: Rents rising (+3.0%/yr); 56 active listings in the ZIP; 8 comparable units currently listed for rent nearby; rentals lingering (median 44d on market — plan ~5-8 weeks vacancy on turnover, expect pricing pressure); 100% of comp listings sitting > 30 days — soft ceiling on asking rent; lower-income renter base — watch delinquency; 364 units permitted in Erie County in 2024 (188 in 5+ unit buildings).
- At $1,615/mo this rent would consume 50% of the median local household income ($39k/yr) (locally 1044% of renters already pay >50% of income on rent) — very limited rent-growth headroom before tenants either downsize or default.
Forward outlook
- Local home prices are declining (-3.0%/yr); year-one equity from $414 of loan paydown is wiped out by about $2k of value loss. Plan a longer hold.
- Erie County population projected at -14% by 2050 — secular population decline; favor cash flow + early exit over multi-decade hold.
- At projected returns (-3.0% appreciation + 3.0% rent growth), your $17k cash investment doubles in ~2 years — after that, you're playing with house money.
Negotiation context
- It's been on market 99 days — a 9% lower offer ($55k) is reasonable based on typical stale-listing flexibility.
- 2 sale attempts since 6y ago; this cycle's ask has dropped $15k (20%) from the opening price — seller is motivated, your offer sets the floor, not the list.
- Current owner paid $11k; list at $60k implies a 445% gain — meaningful room to come down on a strong offer.
Risks & watch-outs
- Watch-outs: built in 1914 — expect roof / HVAC / electrical / plumbing capex.
Questions for the listing agent
- It's been on market 99 days. Have you received any prior offers? Is the seller open to a 9% concession, seller financing, or rate buy-down credit?
- Built in 1914 — when were the roof, HVAC, electrical panel, plumbing, and water heater last replaced?
- Why hasn't it sold? Are there any deal-killer items the seller is aware of (foundation, flood, title, zoning, code violations)?
- Is there a deadline driving the sale (1031 exchange, divorce, estate, relocation)? That informs how much negotiation room exists.
- Crime grade is D in this area — have there been break-ins, vandalism, or insurance claims at this property in the last 3 years? What carrier currently insures it and at what premium?
- What's the average days-on-market for RENTAL listings here right now (not sales)? A rising rental-DOM trend means longer vacancies and softer asking-rent achievability than the comps imply.
- What's the recent tenant-quality profile in this submarket — average credit score on applications, eviction rate, late-payment / NSF rate, and stable-employment percentage? A property-management company in the area should have these aggregated.
- How much new for-sale + rental construction is in the pipeline within 1–3 miles? Heavy new supply typically softens prices + rents 12–24 months out; constrained supply supports both.
Investment metrics
- 1% rule
- 2.70% ✓
- Cap rate
- 23.34%
- Cash-on-cash
- 60.89%
- DSCR
- 3.71
- GRM
- 3.1
CMA / ARV
- ARV (median comp)
- $131,337
- List price
- $59,900
- Delta
- -54.39%
- Verdict
- UNDERPRICED
- Comps
- 20 within 1.0 mi
Show comp detail 12 sales within ~0.75 mi
| Address | Dist | Beds/Ba | Sqft | Sold | Price | $/sf | Match |
|---|---|---|---|---|---|---|---|
| 1054 W 11th | 0.09mi | 3/3.0 (-1) | 1,544 (0%) | 3mo | $64,600 | $42 | 80 |
| 963 W 7th St | 0.37mi | 4/1.0 | 1,536 (-0%) | 6mo | $145,000 | $94 | 77 |
| 922 W 10 St | 0.31mi | 4/2.5 | 1,536 (-0%) | 5mo | $150,500 | $98 | 74 |
| 1208 W 11 St | 0.10mi | 3/1.0 (-1) | 1,420 (-8%) | 4mo | $124,900 | $88 | 74 |
| 1331 W 10th St | 0.28mi | 3/1.0 (-1) | 1,472 (-5%) | 8mo | $129,900 | $88 | 68 |
| 623 W 5th St | 0.74mi | 4/1.0 | 1,560 (+1%) | 4mo | $150,000 | $96 | 61 |
| 1053 W 20th St | 0.59mi | 3/2.0 (-1) | 1,526 (-1%) | 1mo | $150,000 | $98 | 61 |
| 1057 W 20th Sts | 0.59mi | 4/1.0 | 1,403 (-9%) | 1mo | $149,000 | $106 | 56 |
| 1358 W 21st St | 0.70mi | 4/2.0 | 1,608 (+4%) | 1mo | $120,000 | $75 | 56 |
| 1017 W 20th St | 0.61mi | 4/1.0 | 1,370 (-11%) | 2mo | $163,000 | $119 | 51 |
| 1111 W 5th St | 0.46mi | 3/1.0 (-1) | 1,348 (-13%) | 4mo | $165,000 | $122 | 49 |
| 1617 Liberty St | 0.57mi | 3/1.0 (-1) | 1,332 (-14%) | 1mo | $76,000 | $57 | 45 |
Match score weights: distance 35% · size 25% · config 20% · recency 20%. Top-matched comps best support the ARV.
Projected returns pro-forma
-3.0% appreciation · 2.97% rent growth · sell at horizon
- IRR
- 59.7%
- Equity multiple
- 3.65×
- Total profit
- $44,475
- Equity at exit
- $8,931
- IRR
- 64.4%
- Equity multiple
- 7.47×
- Total profit
- $108,444
- Equity at exit
- $5,179
Cash invested: $16,772 (down + closing). Projections, not guarantees.
Landlord ↔ Tenant lean methodology
- Overall (STATE)
- 62 Landlord-Friendly
- State Pennsylvania
- 62 Landlord-Friendly · EVEN
- County
- — inherits STATE
- City
- — inherits STATE
ZIP-level market 16502
- Home prices YoY
- -30.5%
- Rents YoY
- 3.0%
- Active inventory
- 56
- Price-to-rent
- 3.1×
Monthly cashflow live
- Estimated rent
- $1,615 high interval (Pro) →
- Mortgage (P&I)
- −$314
- Tax from tax record
- −$86 /mo · $1,030/yr
- Insurance
- −$25
- HOA
- −$0
- Vacancy / Maint / Mgmt
- −$339
- Net cashflow
- $851
Break-even live
UW: 25.0% down · 7.5% · 30yr · 1.5% tax · 5.0% vac · 8.0% maint · 8.0% mgmt
Financing live
Cash to close
- Down payment
- $14,975
- Closing costs
- $1,797
- Reserves months
- —
- Total cash needed
- —
Loan-product check · same deal, 3 products live
Conventional
25% down · 7.5% · 30yr
- Down + closing
- —
- Monthly P&I
- —
- Monthly cashflow
- —
- DSCR
- —
- Eligible?
- —
Personal DTI + credit; lowest rate.
DSCR
20% down · 8.5% · 30yr
- Down + closing
- —
- Monthly P&I
- —
- Monthly cashflow
- —
- DSCR
- —
- Eligible?
- —
No personal income docs; deal must DSCR.
Hard money
10% down · 12.0% · 12mo
- Down + closing
- —
- Monthly P&I
- —
- Monthly cashflow
- —
- DSCR
- —
- Eligible?
- —
Short-term bridge; refi at stabilization.
Rent comps 8 comps
| Address | Beds | Baths | Sqft | Rent | $/sqft | DOM | Units | Dist |
|---|---|---|---|---|---|---|---|---|
| 1164 W 7th St Erie, PA | 3.0 | 1.0 | 1248 | $1,600 | $1.28 | 44d | 1 | 0.36mi |
| 729 W 9th St Erie, PA | 4.0 | 2.0 | 1782 | $3,000 | $1.68 | 44d | 1 | 0.47mi |
| 1610 Poplar St Unit Downstairs Erie, PA | 3.0 | 1.0 | 1200 | $875 | $0.73 | 44d | 1 | 0.59mi |
| 538 W 8th St Unit 1 Erie, PA | 3.0 | 1.0 | 2000 | $1,650 | $0.82 | 44d | 1 | 0.75mi |
| 923 Chestnut St Unit 2 Erie, PA | 4.0 | 2.0 | 1100 | $1,150 | $1.05 | 44d | 1 | 0.93mi |
| 1837 W 9th St Erie, PA | 3.0 | 1.0 | 1450 | $1,600 | $1.10 | 44d | 1 | 1.00mi |
| 2702 Raspberry St Unit 1 Erie, PA | 3.0 | 1.0 | 2000 | $1,200 | $0.60 | 44d | 1 | 1.00mi |
| 504 W 29th St Unit 2 Erie, PA | 3.0 | 1.0 | 1200 | $1,500 | $1.25 | 44d | 1 | 1.34mi |
Listing history 20 events
-
2026-06-19days on market $59,900 Active 99 DOM
-
2026-06-18days on market $59,900 Active 98 DOM
-
2026-06-17days on market $59,900 Active 97 DOM
-
2026-06-16days on market $59,900 Active 96 DOM
-
2026-06-15days on market $59,900 Active 95 DOM
-
2026-06-14days on market $59,900 Active 93 DOM
-
2026-06-13days on market $59,900 Active 92 DOM
-
2026-06-10days on market $59,900 Active 90 DOM
-
2026-06-09days on market $59,900 Active 89 DOM
-
2026-06-09status $59,900 Active 88 DOM
-
2026-05-31status $59,900 Pending 88 DOM
-
2026-05-31days on market $59,900 Active 88 DOM
-
2026-05-30days on market $59,900 Active 87 DOM
-
2026-05-17price $59,900 488-char remark
Show marketing remark (488 chars)
Tenant-occupied single-family investment opportunity with immediate rental income and an additional parcel included. This property offers strong long-term potential for investors looking to expand their portfolio. With room for future updates and improvements, the home presents an opportunity to build equity while generating income. The extra parcel adds flexibility and potential future value. Property is being sold as-is. Advance notice required for showings due to tenant occupancy.
-
2026-04-20price $69,900 488-char remark
Show marketing remark (488 chars)
Tenant-occupied single-family investment opportunity with immediate rental income and an additional parcel included. This property offers strong long-term potential for investors looking to expand their portfolio. With room for future updates and improvements, the home presents an opportunity to build equity while generating income. The extra parcel adds flexibility and potential future value. Property is being sold as-is. Advance notice required for showings due to tenant occupancy.
-
2026-03-02$74,900 Active 488-char remark
Show marketing remark (488 chars)
Tenant-occupied single-family investment opportunity with immediate rental income and an additional parcel included. This property offers strong long-term potential for investors looking to expand their portfolio. With room for future updates and improvements, the home presents an opportunity to build equity while generating income. The extra parcel adds flexibility and potential future value. Property is being sold as-is. Advance notice required for showings due to tenant occupancy.
-
2020-05-08soldstatus $11,000 238-char remark
Show marketing remark (238 chars)
North West Erie Fixer Upper. City Inspection 9/2019. Lead Renovated. Tenant Occupied. Sold "as is" Condition. Tenant Rent $575.00 Monthly And Pays Water, Sewer And Garbage. Roof Unknown. Taxes For Extra Lot are $256.00 Per Year.
-
2020-05-08soldstatus $11,000
Show marketing remark (238 chars)
North West Erie Fixer Upper. City Inspection 9/2019. Lead Renovated. Tenant Occupied. Sold "as is" Condition. Tenant Rent $575.00 Monthly And Pays Water, Sewer And Garbage. Roof Unknown. Taxes For Extra Lot are $256.00 Per Year.
-
2020-02-19$15,000 238-char remark
Show marketing remark (238 chars)
North West Erie Fixer Upper. City Inspection 9/2019. Lead Renovated. Tenant Occupied. Sold "as is" Condition. Tenant Rent $575.00 Monthly And Pays Water, Sewer And Garbage. Roof Unknown. Taxes For Extra Lot are $256.00 Per Year.
-
1976-12-29soldstatus $7,000
ⓘ Source: listings_history table (triggers on properties + properties_extension) + one-shot
backfill from property_details.listing_events for pre-trigger history.
Tax reassessment forecast PA · Partial reset (capped growth)
- Current annual tax
- $1,030 · $86/mo
- Projected year-2 tax
- $1,030 · $86/mo
- Expected delta
- $0/yr ($0/mo · 0.0%)
ⓘ Screening estimate from a state-policy table — verify with the county assessor before closing.
Climate risk First Street
- Flood 4/10 Moderate FEMA zone X (unshaded) · 22% chance over 30 yrs
- Wildfire 1/10 Low
- Heat 2/10 Low 7 d/yr ≥90°F today · 17 d/yr by 30 yrs out
- Wind 1/10 Low
- Air quality 2/10 Low 1 unhealthy d/yr today · 3 by 30 yrs out
Nearby sold comps map
Loading sold comps map…
Walkable amenities ~0.75 mi
Loading nearby amenities…
Taxation est. · year 1
- Rental income
- $19,380
- − Mortgage interest
- −$3,355
- − Property taxes
- −$1,030
- − Insurance
- −$300
- − Repairs & maintenance
- −$1,550
- − Management
- −$1,550
- − Depreciation
- −$1,743
- Taxable income
- $9,852
- Est. tax owed @ 24.0%
- −$2,365
- After-tax cash flow
- $7,847/yr
For passive investors: Depreciation is non-cash, so a rental often shows a tax loss while cash-flowing — sheltering income. Rental losses are passive: they offset passive income freely, and up to $25,000/yr can offset ordinary (W-2) income if you actively participate and your MAGI is under $100k (phasing out to $0 by $150k); unused losses carry forward. On sale, claimed depreciation is recaptured at up to 25%, and gains may owe capital-gains tax (a 1031 exchange can defer both). Figures are a year-1 estimate at your 24.0% rate — not tax advice; consult a CPA.
Schools (NCES district)
- District
- Erie City SD
- NCES district ID
- 4209300
- Math proficiency
- 12% ▼ -11.00%
- Reading proficiency
- 19% ▼ -16.00%
- Median HH income
- $33,625
- Composite
- 12.59/100
- National rank
- #9617
- State rank
- #510 of 539 in PA
Livability — Erie
- Score
- 83/100
- State rank
- #109
- US rank
- #840
Category grades
Schools grade is shown separately in the Schools card above.
Census & demographics
- Census place
- Erie, PA
- County
- Erie County · 92,215 people
- City population
- 92,215
- Metro
- Erie, PA
- Population (ZIP)
- 15,995
- Household income
- $38,566
- Rent vs Own
- Severe rent burden
- 1044.0
Population outlook (Erie County) Hauer SSP2
- Today (2025)
- 272,159 people
- By 2030
- 266,299 · -2.2%
- By 2040
- 250,987 · -7.8%
- By 2050
- 234,925 · -13.7%
- By 2075
- 199,164 · -26.8%
- By 2100
- 162,985 · -40.1%
Race, ethnicity, and origin ACS 2023
- Neighborhood character
- Predominantly White (66%)
- Race & ethnicity
- White 66% Two or more races 16% Hispanic / Latino 13% Black 11% Asian 2%
- Hispanic origin (detail)
- Mexican 5% Puerto Rican 5%
- Common ancestry
- Romanian 7% Serbian 2% Italian 1%
- Foreign-born
- 5% · Canada
- Languages at home
- 89% English-only · Spanish 8% Other Indo-European 1% Russian/Polish/Slavic 1%
Political lean MEDSL · Erie
- 2024 margin
- Toss-up / Even · D 49.0% · R 50.0%
- 2008→2024 swing
- -20.9pp toward R · 2008: 19.9pp · 2024: -1.0pp
- All cycles
- 2024: R+1.0 2020: D+1.0 2016: R+2.0 2012: D+16.9 2008: D+19.9
Not yet ingested
- Civics
- —
Market trends
- HPI YoY
- ▼ -92.73%
- Current HPI
- 211.4408
- Rent YoY
- ▲ 2.97%
- Metro
- Erie, PA
- State GDP YoY
- ▲ 1.68%
- F500 in state
- 34
Industry mix (Fortune 500 HQ in PA)
| Industry | F500 HQs | Revenue |
|---|---|---|
| Healthcare | 2 | $309B |
|
||
| Insurance | 2 | $27B |
|
||
| Telecommunications / Media | 1 | $124B |
|
||
| Industrial Distribution | 1 | $22B |
|
||
| Financial Services | 1 | $20B |
|
||
| Chemicals / Materials | 1 | $18B |
|
||
Price history
+755.7% since first listed7 events — show timeline
- 2026-05-17 Price Changed $59,900 GEBOR
- 2026-04-20 Price Changed $69,900 GEBOR
- 2026-03-02 Listed $74,900 GEBOR
- 2020-05-08 Sold (Public Records) $11,000 Public Records
- 2020-05-08 Sold (MLS) $11,000 GEBOR
- 2020-02-19 Listed $15,000 GEBOR
- 1976-12-29 Sold (Public Records) $7,000 Public Records
Property tax history
+1.9%/yrLatest (2026): $1,030 · +3.4% YoY. Source: county tax records.
Cash-flow waterfall
monthlySold comps — $/sqft
last 12 mo · ≤1 miLoading sold comps…