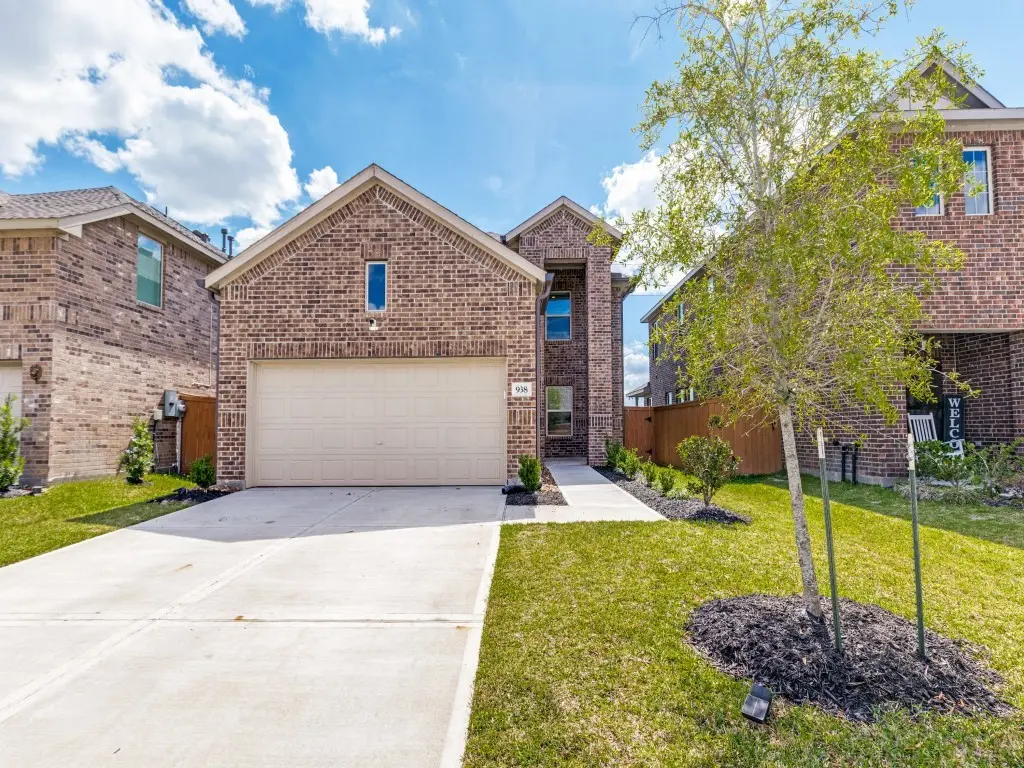
938 Mockingbird Passage Dr · Kendleton, TX
Flood risk No data
- FEMA flood zone
- —
- Chance of flooding over 30 yrs
- —
- Est. flood insurance / yr
- —
Fire risk No data
- Est. fire insurance / yr
- —
Heat risk No data
- Hot days now (above threshold)
- —
- Hot days in 30 yrs
- —
Wind risk No data
- Chance of severe wind over 30 yrs
- —
Air-quality risk No data
- Unhealthy air days now
- —
- Unhealthy air days in 30 yrs
- —
Risk factors via First Street. Map © Google.
Why this score? — see what drove the B grade
The composite is a weighted blend of 9 inputs, each scored 0–100. Each bar is that input's sub-score; the figure is the points it added to the 100-point composite (weight × sub-score).
- Cash flow +22.0/30.0
- ARV discount +15.0/15.0
- 1% rule +8.8/10.0
- Appreciation +7.1/10.0
- DSCR +7.0/10.0
- Schools +4.6/10.0
- Condition / age +4.0/5.0
- Livability +3.1/5.0
- Rent growth +2.5/5.0
$215,000
🖨 Deal sheet 📄 Offer letter ✓ Due diligence
Listing remarks MLS
Great opportunity to purchase in the Master Planned Community of Emberly in Beasley TX 2 Story home with 4 beds and 2.5 bathrooms. Conveniently located off US 59 for ease of commute. The community offers resort-style amenities to include a Clubhouse with Fitness Center, Courtyard, Shade Structures, Resort-style Pool, Water Park/Splash Pad, Event Lawn/Town Square, Playground, Pickleball Courts, Sand Volleyball Court, Dog Park and Hike/Bike Trails.
Key facts
- Pickleball courts
- Resort-style pool
- 5,144 sq ft lot
Tags
Neighborhood map
What this means for you Summary
Snapshot
- This is a 4-bed/2.5-bath single-family listed at $215k. Condition is rated good.
Deal economics
- At list price, monthly cash flow is $341 ($4k/yr) — positive.
- The deal already cash-flows at list — no discount required.
- Meets the 1% rule at list price ($3k rent vs $215k).
- Recommended offer: $202k (6.0% below list) — sets the bar for market timing.
- Cap rate 8.2% vs local median 6.2% in Kendleton — top-decile yield for the area; either an underpriced asset or a hidden risk that comps aren't pricing in. Stress-test before assuming the spread holds.
Location & tenants
- Location reads 61/100 on livability (#1,021 in TX) — a middle-class / working-renter tenant base. Strengths: cost of living A+, housing A+; Watch: schools C-, employment D+, crime D.
- Lamar CISD (suburban): math 50% / reading 53% proficiency, ranked #116 of 826 in TX (top 14%) — acceptable for families but not a draw, mixed tenant base, ~2y average lease.
- Market conditions: 232 active listings in the ZIP; 1 comparable units currently listed for rent nearby; 12,093 units permitted in Fort Bend County in 2024 (815 in 5+ unit buildings).
Forward outlook
- In year one you build about $10k of equity ($1k loan paydown + $9k appreciation (4.2% local appreciation)).
- Fort Bend County population projected at +75% by 2050 — long-run rental-demand tailwind backs the buy-and-hold thesis.
- At projected returns (4.2% appreciation + 3.0% rent growth), your $60k cash investment doubles in ~4 years — after that, you're playing with house money.
- By year 4, paydown + projected appreciation supports a ~$35k cash-out refi (75% LTV) — recoverable capital for the next deal without selling this one.
Negotiation context
- It's been on market 69 days — a 6% lower offer ($202k) is reasonable based on typical stale-listing flexibility.
- 2 sale attempts since 2y ago with the ask held roughly flat each time — persistent listings suggest the price (not the market) is what's stuck; bring a comps-based counter.
Risks & watch-outs
- Watch-outs: property tax is 3.7% of price.
Questions for the listing agent
- It's been on market 69 days. Have you received any prior offers? Is the seller open to a 6% concession, seller financing, or rate buy-down credit?
- Property tax is high relative to price — has the assessment been appealed recently, and will the sale trigger a re-assessment?
- What does the HOA fee cover, when was the last increase, and are there any pending special assessments or reserve-fund shortfalls?
- Why hasn't it sold? Are there any deal-killer items the seller is aware of (foundation, flood, title, zoning, code violations)?
- Is there a deadline driving the sale (1031 exchange, divorce, estate, relocation)? That informs how much negotiation room exists.
- Crime grade is D in this area — have there been break-ins, vandalism, or insurance claims at this property in the last 3 years? What carrier currently insures it and at what premium?
- What's the average days-on-market for RENTAL listings here right now (not sales)? A rising rental-DOM trend means longer vacancies and softer asking-rent achievability than the comps imply.
- What's the recent tenant-quality profile in this submarket — average credit score on applications, eviction rate, late-payment / NSF rate, and stable-employment percentage? A property-management company in the area should have these aggregated.
- How much new for-sale + rental construction is in the pipeline within 1–3 miles? Heavy new supply typically softens prices + rents 12–24 months out; constrained supply supports both.
Investment metrics
- 1% rule
- 1.38% ✓
- Cap rate
- 8.20%
- Cash-on-cash
- 6.81%
- DSCR
- 1.30
- GRM
- 6.0
CMA / ARV
- ARV (median comp)
- $270,451
- List price
- $215,000
- Delta
- -20.50%
- Verdict
- UNDERPRICED
- Comps
- 20 within 1.0 mi
Show comp detail 12 sales within ~0.75 mi
| Address | Dist | Beds/Ba | Sqft | Sold | Price | $/sf | Match |
|---|---|---|---|---|---|---|---|
| 10803 Hickory Ln | 0.32mi | 4/2.0 | 1,778 (-2%) | 2mo | $309,900 | $174 | 79 |
| 10735 Dogwood Sky Dr | 0.34mi | 4/2.0 | 1,778 (-2%) | 0mo | $289,990 | $163 | 79 |
| 719 Mockingbird Psge | 0.20mi | 3/2.0 (-1) | 1,863 (+3%) | 2mo | $335,490 | $180 | 76 |
| 10606 Crimson Trce | 0.49mi | 3/2.0 (-1) | 1,826 (+1%) | 2mo | $265,000 | $145 | 66 |
| 10710 Sage Bend Dr | 0.38mi | 3/2.0 (-1) | 1,595 (-12%) | 1mo | $274,990 | $172 | 55 |
| 1062 Blue Stone Dr | 0.60mi | 4/2.0 | 1,655 (-8%) | 2mo | $317,990 | $192 | 55 |
| 1138 Blue Stone Dr | 0.65mi | 4/2.5 | 1,951 (+8%) | 3mo | $289,990 | $149 | 54 |
| 10422 Rocky Trl | 0.57mi | 4/2.5 | 2,066 (+14%) | 3mo | $297,990 | $144 | 47 |
| 10415 Rocky Trl | 0.59mi | 4/2.5 | 2,066 (+14%) | 3mo | $294,990 | $143 | 46 |
| 10407 Rocky Trl | 0.61mi | 4/2.5 | 2,066 (+14%) | 3mo | $294,990 | $143 | 45 |
| 1031 Blue Stone Dr | 0.60mi | 3/2.0 (-1) | 1,572 (-13%) | 2mo | $307,990 | $196 | 42 |
| 1023 Blue Stone Dr | 0.59mi | 3/2.0 (-1) | 1,572 (-13%) | 3mo | $309,990 | $197 | 42 |
Match score weights: distance 35% · size 25% · config 20% · recency 20%. Top-matched comps best support the ARV.
Projected returns pro-forma
4.15% appreciation · 3.0% rent growth · sell at horizon
- IRR
- 16.8%
- Equity multiple
- 2.02×
- Total profit
- $61,416
- Equity at exit
- $110,940
- IRR
- 17.6%
- Equity multiple
- 3.87×
- Total profit
- $172,933
- Equity at exit
- $183,009
Cash invested: $60,200 (down + closing). Projections, not guarantees.
Landlord ↔ Tenant lean methodology
- Overall (STATE)
- 87 Strongly Landlord-Friendly
- State Texas
- 87 Strongly Landlord-Friendly · R+5
- County
- — inherits STATE
- City
- — inherits STATE
ZIP-level market 77417
- Home prices YoY
- 1.2%
- Active inventory
- 232
- Price-to-rent
- 6.0×
Monthly cashflow live
- Estimated rent
- $2,965 medium interval (Pro) →
- Mortgage (P&I)
- −$1,127
- Tax from tax record
- −$671 /mo · $8,051/yr
- Insurance
- −$90
- HOA
- −$113
- Vacancy / Maint / Mgmt
- −$623
- Net cashflow
- $341
Break-even live
UW: 25.0% down · 7.5% · 30yr · 1.5% tax · 5.0% vac · 8.0% maint · 8.0% mgmt
Financing live
Cash to close
- Down payment
- $53,750
- Closing costs
- $6,450
- Reserves months
- —
- Total cash needed
- —
Loan-product check · same deal, 3 products live
Conventional
25% down · 7.5% · 30yr
- Down + closing
- —
- Monthly P&I
- —
- Monthly cashflow
- —
- DSCR
- —
- Eligible?
- —
Personal DTI + credit; lowest rate.
DSCR
20% down · 8.5% · 30yr
- Down + closing
- —
- Monthly P&I
- —
- Monthly cashflow
- —
- DSCR
- —
- Eligible?
- —
No personal income docs; deal must DSCR.
Hard money
10% down · 12.0% · 12mo
- Down + closing
- —
- Monthly P&I
- —
- Monthly cashflow
- —
- DSCR
- —
- Eligible?
- —
Short-term bridge; refi at stabilization.
Rent comps 1 comps
| Address | Beds | Baths | Sqft | Rent | $/sqft | DOM | Units | Dist |
|---|---|---|---|---|---|---|---|---|
| 10730 Sky Creek Ln Beasley, TX | 3.0–4.0 | 2.0–2.5 | 1869 | $2,965 | $1.59 | 1d | 1 | 0.47mi |
HOA detail
- Monthly dues
- $113 · $1,356/yr
- Likely covers
- waterpoolgym
Listing history 13 events
-
2026-06-18days on market $215,000 Active 69 DOM
-
2026-06-17days on market $215,000 Active 68 DOM
-
2026-06-16days on market $215,000 Active 67 DOM
-
2026-06-15days on market $215,000 Active 66 DOM
-
2026-06-13statusdays on market $215,000 Active 64 DOM
-
2026-06-10days on market $215,000 Pending 60 DOM
-
2026-06-08days on market $215,000 Pending 59 DOM
-
2026-06-07statusdays on market $215,000 Pending 58 DOM
-
2026-05-14price $215,000 452-char remark
Show marketing remark (452 chars)
Great opportunity to purchase in the Master Planned Community of Emberly in Beasley TX 2 Story home with 4 beds and 2.5 bathrooms. Conveniently located off US 59 for ease of commute. The community offers resort-style amenities to include a Clubhouse with Fitness Center, Courtyard, Shade Structures, Resort-style Pool, Water Park/Splash Pad, Event Lawn/Town Square, Playground, Pickleball Courts, Sand Volleyball Court, Dog Park and Hike/Bike Trails.
-
2026-03-31$225,000 Active 452-char remark
Show marketing remark (452 chars)
Great opportunity to purchase in the Master Planned Community of Emberly in Beasley TX 2 Story home with 4 beds and 2.5 bathrooms. Conveniently located off US 59 for ease of commute. The community offers resort-style amenities to include a Clubhouse with Fitness Center, Courtyard, Shade Structures, Resort-style Pool, Water Park/Splash Pad, Event Lawn/Town Square, Playground, Pickleball Courts, Sand Volleyball Court, Dog Park and Hike/Bike Trails.
-
2024-02-18historical
-
2024-02-13price $225,000
-
2024-02-09$250,000 Active
ⓘ Source: listings_history table (triggers on properties + properties_extension) + one-shot
backfill from property_details.listing_events for pre-trigger history.
Tax reassessment forecast TX · Resets to sale price
- Current annual tax
- $8,051 · $671/mo
- Projected year-2 tax
- $8,051 · $671/mo
- Expected delta
- $0/yr ($0/mo · 0.0%)
ⓘ Screening estimate from a state-policy table — verify with the county assessor before closing.
Nearby sold comps map
Loading sold comps map…
Walkable amenities ~0.75 mi
Loading nearby amenities…
Taxation est. · year 1
- Rental income
- $35,580
- − Mortgage interest
- −$12,043
- − Property taxes
- −$8,051
- − Insurance
- −$1,075
- − Repairs & maintenance
- −$2,846
- − Management
- −$2,846
- − HOA
- −$1,356
- − Depreciation
- −$6,255
- Taxable income
- $1,108
- Est. tax owed @ 24.0%
- −$266
- After-tax cash flow
- $3,831/yr
For passive investors: Depreciation is non-cash, so a rental often shows a tax loss while cash-flowing — sheltering income. Rental losses are passive: they offset passive income freely, and up to $25,000/yr can offset ordinary (W-2) income if you actively participate and your MAGI is under $100k (phasing out to $0 by $150k); unused losses carry forward. On sale, claimed depreciation is recaptured at up to 25%, and gains may owe capital-gains tax (a 1031 exchange can defer both). Figures are a year-1 estimate at your 24.0% rate — not tax advice; consult a CPA.
Condition & rehab AI · 1 photo
This 2-story home in Emberly, Kendleton TX, is in good condition with minimal repairs needed. It offers a great opportunity for a cosmetic renovation to enhance its curb appeal and interior aesthetics, increasing its resale and rental value.
Value-add opportunities
- Both Painting exterior and interior — Enhances curb appeal and interior aesthetics
- Both Landscaping improvements — Enhances curb appeal and adds value
- Both New flooring in bathrooms and kitchen — Improves functionality and aesthetics
- Both New paint in interior — Enhances interior aesthetics and value
Renovation cost estimate screening
Value-add ROI direction
- Both Painting exterior and interior — Enhances curb appeal and interior aesthetics ↑
- Both Landscaping improvements — Enhances curb appeal and adds value ↑
- Both New flooring in bathrooms and kitchen — Improves functionality and aesthetics ↑
- Both New paint in interior — Enhances interior aesthetics and value ↑
ⓘ Cost ranges are severity-bucket heuristics (US national rule-of-thumb). Get contractor quotes + a written scope before underwriting a rehab budget.
Schools (NCES district)
- District
- Lamar CISD
- NCES district ID
- 4826580
- Math proficiency
- 50% ▼ -12.00%
- Reading proficiency
- 53% ▼ -4.00%
- Median HH income
- $75,213
- Composite
- 46.43/100
- National rank
- #2452
- State rank
- #116 of 826 in TX
Livability — Kendleton
- Score
- 61/100
- State rank
- #1021
- US rank
- #18149
Category grades
Schools grade is shown separately in the Schools card above.
Census & demographics
- Population (ZIP)
- 3,232
Population outlook (Fort Bend County) Hauer SSP2
- Today (2025)
- 1,004,526 people
- By 2030
- 1,153,104 · +14.8%
- By 2040
- 1,453,718 · +44.7%
- By 2050
- 1,753,781 · +74.6%
- By 2075
- 2,455,772 · +144.5%
- By 2100
- 2,930,528 · +191.7%
Race, ethnicity, and origin ACS 2023
- Neighborhood character
- Predominantly Hispanic (67%)
- Race & ethnicity
- Hispanic / Latino 67% Two or more races 49% White 22% Black 8%
- Hispanic origin (detail)
- Mexican 54%
- Common ancestry
- Italian 2% Romanian 1%
- Foreign-born
- 3% · Canada
- Languages at home
- 76% English-only · Spanish 24%
Political lean MEDSL · Fort Bend
- 2024 margin
- Toss-up / Even · D 49.5% · R 47.9% · Other 2.6%
- 2008→2024 swing
- +4.0pp toward D · 2008: -2.4pp · 2024: 1.6pp
- All cycles
- 2024: D+1.6 2020: D+10.6 2016: D+6.6 2012: R+6.8 2008: R+2.4
Not yet ingested
- Civics
- —
Market trends
- HPI YoY
- ▲ 4.15%
- Current HPI
- 337.8236
- Rent YoY
- —
- Metro
- —
- State GDP YoY
- ▲ 3.95%
- F500 in state
- 110
Industry mix (Fortune 500 HQ in TX)
| Industry | F500 HQs | Revenue |
|---|---|---|
| Energy | 16 | $1,198B |
|
||
| Technology | 5 | $198B |
|
||
| Engineering / Construction | 4 | $72B |
|
||
| Energy Services | 3 | $60B |
|
||
| Utilities | 3 | $41B |
|
||
| Healthcare | 2 | $330B |
|
||
Price history
-14.0% since first listed5 events — show timeline
- 2026-05-14 Price Changed $215,000 HARMLS
- 2026-03-31 Listed $225,000 HARMLS
- 2024-02-18 Listing Removed — HARMLS
- 2024-02-13 Price Changed $225,000 HARMLS
- 2024-02-09 Listed $250,000 HARMLS
Cash-flow waterfall
monthlySold comps — $/sqft
last 12 mo · ≤1 miLoading sold comps…