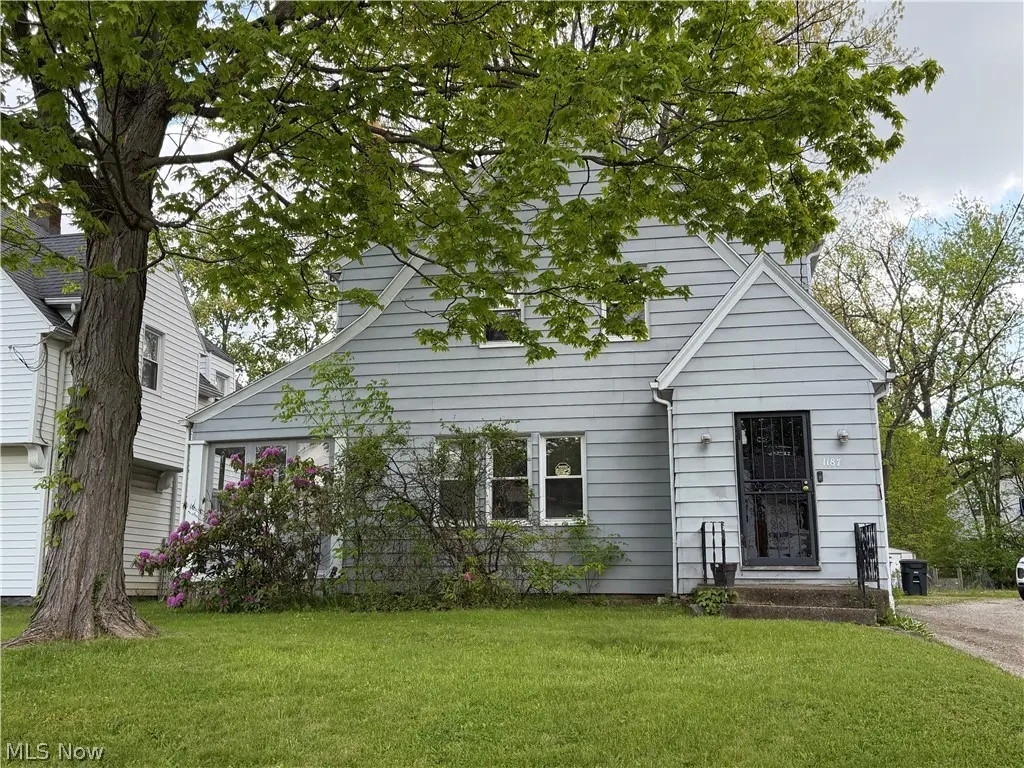
1187 Mercer Ave · Akron, OH
Flood risk 1/10 · Minimal
- FEMA flood zone
- X (unshaded)
- Chance of flooding over 30 yrs
- 0.0%
- Est. flood insurance / yr
- $473 – $860
Fire risk 1/10 · Minimal
- Est. fire insurance / yr
- $713 – $1,323
Heat risk 3/10 · Minor
- Hot days now (above 97°F)
- 7 days/yr
- Hot days in 30 yrs
- 16 days/yr
Wind risk 1/10 · Minimal
- Chance of severe wind over 30 yrs
- —
Air-quality risk 2/10 · Minimal
- Unhealthy air days now
- 1 days/yr
- Unhealthy air days in 30 yrs
- 2 days/yr
Risk factors via First Street. Map © Google.
Why this score? — see what drove the A- grade
The composite is a weighted blend of 9 inputs, each scored 0–100. Each bar is that input's sub-score; the figure is the points it added to the 100-point composite (weight × sub-score).
- Cash flow +30.0/30.0
- ARV discount +15.0/15.0
- 1% rule +10.0/10.0
- DSCR +10.0/10.0
- Appreciation +4.9/10.0
- Livability +4.0/5.0
- Rent growth +2.5/5.0
- Condition / age +2.5/5.0
- Schools +2.1/10.0
$60,000
🖨 Deal sheet 📄 Offer letter ✓ Due diligence
Listing remarks
Don't miss this one! 3 bedrooms, 1 bath home on a quiet street in Akron. Enclosed side porch. Gas fireplace, not currently hooked up. Lots of potential here. Estimated ages of mechanicals & maintenance: HVAC (2017); HWT (2016); Roof (2001); Windows, Doors, Basement steps, Exterior paint all completed about 2008; Priced to sell.
Key facts
- Enclosed side porch
- Quiet street
- Hvac
Tags
Property features AI
Exterior
- Parking: Off-site parking; Shared driveway
- Utilities: Public water; Public sewer
- Home design: 2-story house; Above-grade finished area reported as 1,152 (source: assessor)
- Construction: Aluminum siding; Asphalt/fiberglass roof
- Exterior features: Patio; Porch (including enclosed and side porch)
Interior
- Kitchen: Range; Refrigerator
- Bedrooms: Total of 6 rooms (bedrooms not separately specified)
- Bathrooms: 1 full bathroom
- Heating & cooling: Forced-air gas heating
- Interior features: Full, unfinished basement; Enclosed porch; Side porch; Patio
- Laundry & utility: Laundry in basement
Neighborhood map
What this means for you Summary
Snapshot
- This is a 3-bed/1.0-bath single-family listed at $60k.
Deal economics
- At list price, monthly cash flow is $525 ($6k/yr) — positive.
- The deal already cash-flows at list — no discount required.
- Meets the 1% rule at list price ($1k rent vs $60k).
- Cap rate 16.8% vs local median 6.6% in Akron — top-decile yield for the area; either an underpriced asset or a hidden risk that comps aren't pricing in. Stress-test before assuming the spread holds.
Location & tenants
- Location reads 81/100 on livability (#104 in OH, #1,591 nationally) — a professional / high-income tenant draw. Strengths: amenities A+, commute A+, cost of living A+; Watch: crime F, employment F.
- Akron City (urban): math 22% / reading 30% proficiency, ranked #602 of 656 in OH (top 92%) — low school quality limits family demand, transient renter base, plan for 1-2y turnover; 66% free/reduced lunch — lower-income household profile, screen leases tightly.
- Market conditions: 42 active listings in the ZIP; 40 comparable units currently listed for rent nearby; rentals at typical pace (median 24d on market — plan ~3-4 weeks tenant-placement turnaround); 48% of comp listings sitting > 30 days — soft ceiling on asking rent; lower-income renter base — watch delinquency; 1,114 units permitted in Summit County in 2024 (397 in 5+ unit buildings).
- At $1,241/mo this rent would consume 54% of the median local household income ($28k/yr) (locally 787% of renters already pay >50% of income on rent) — very limited rent-growth headroom before tenants either downsize or default.
Forward outlook
- In year one you build about $297 of equity ($415 loan paydown + $-118 appreciation (-0.2% local appreciation)).
- Summit County population projected to shrink 6% by 2050 — rents likely to lag national; underwrite the cash flow, not the appreciation.
- At projected returns (-0.2% appreciation + 3.0% rent growth), your $17k cash investment doubles in ~3 years — after that, you're playing with house money.
Negotiation context
- Only 4 days on market — expect competitive offers; lowballing is unlikely to land.
Risks & watch-outs
- Watch-outs: built in 1927 — expect roof / HVAC / electrical / plumbing capex.
Questions for the listing agent
- Built in 1927 — when were the roof, HVAC, electrical panel, plumbing, and water heater last replaced?
- Is there a deadline driving the sale (1031 exchange, divorce, estate, relocation)? That informs how much negotiation room exists.
- Crime grade is F in this area — have there been break-ins, vandalism, or insurance claims at this property in the last 3 years? What carrier currently insures it and at what premium?
- What's the average days-on-market for RENTAL listings here right now (not sales)? A rising rental-DOM trend means longer vacancies and softer asking-rent achievability than the comps imply.
- What's the recent tenant-quality profile in this submarket — average credit score on applications, eviction rate, late-payment / NSF rate, and stable-employment percentage? A property-management company in the area should have these aggregated.
- How much new for-sale + rental construction is in the pipeline within 1–3 miles? Heavy new supply typically softens prices + rents 12–24 months out; constrained supply supports both.
Investment metrics
- 1% rule
- 2.07% ✓
- Cap rate
- 16.78%
- Cash-on-cash
- 37.47%
- DSCR
- 2.67
- GRM
- 4.0
CMA / ARV
- ARV (on-the-fly)
- $101,376
- Comps found
- 12
Show comp detail 12 sales within ~0.75 mi
| Address | Dist | Beds/Ba | Sqft | Sold | Price | $/sf | Match |
|---|---|---|---|---|---|---|---|
| 966 La Belle Ave | 0.25mi | 2/1.0 (-1) | 1,170 (+2%) | 5mo | $105,000 | $90 | 77 |
| 815 Longview Ave | 0.45mi | 3/1.0 | 1,152 (0%) | 3mo | $53,701 | $47 | 76 |
| 1194 Diagonal Rd | 0.14mi | 3/1.0 | 1,295 (+12%) | 4mo | $48,650 | $38 | 69 |
| 1037 Hardesty Blvd | 0.52mi | 3/1.0 | 1,109 (-4%) | 1mo | $98,000 | $88 | 68 |
| 1311 Superior Ave | 0.20mi | 3/1.0 | 1,008 (-12%) | 4mo | $50,000 | $50 | 66 |
| 861 Glenn St | 0.27mi | 3/2.0 | 1,300 (+13%) | 5mo | $157,000 | $121 | 58 |
| 1248 Greenwood Ave | 0.53mi | 3/1.0 | 1,008 (-12%) | 1mo | $69,000 | $68 | 54 |
| 923 Russell Ave | 0.70mi | 3/1.0 | 1,244 (+8%) | 1mo | $142,000 | $114 | 53 |
| 1265 Greenwood Ave | 0.49mi | 3/1.5 | 1,008 (-12%) | 2mo | $165,000 | $164 | 53 |
| 994 Moeller Ave | 0.68mi | 3/1.0 | 1,047 (-9%) | 1mo | $105,000 | $100 | 52 |
| 924 Lane St | 0.69mi | 3/1.0 | 1,040 (-10%) | 4mo | $43,070 | $41 | 49 |
| 633 Madison Ave | 0.73mi | 3/1.0 | 1,308 (+14%) | 2mo | $44,000 | $34 | 42 |
Match score weights: distance 35% · size 25% · config 20% · recency 20%. Top-matched comps best support the ARV.
Projected returns pro-forma
-0.2% appreciation · 3.0% rent growth · sell at horizon
- IRR
- 38.1%
- Equity multiple
- 2.85×
- Total profit
- $31,143
- Equity at exit
- $16,835
- IRR
- 41.5%
- Equity multiple
- 5.62×
- Total profit
- $77,568
- Equity at exit
- $19,774
Cash invested: $16,800 (down + closing). Projections, not guarantees.
Landlord ↔ Tenant lean methodology
- Overall (STATE)
- 73 Landlord-Friendly
- State Ohio
- 73 Landlord-Friendly · R+6
- County
- — inherits STATE
- City
- — inherits STATE
ZIP-level market 44307
- Home prices YoY
- -0.2%
- Active inventory
- 42
- Price-to-rent
- 4.0×
Monthly cashflow live
- Estimated rent
- $1,241 high interval (Pro) →
- Mortgage (P&I)
- −$315
- Tax from tax record
- −$116 /mo · $1,393/yr
- Insurance
- −$25
- HOA
- −$0
- Vacancy / Maint / Mgmt
- −$261
- Net cashflow
- $525
Break-even live
UW: 25.0% down · 7.5% · 30yr · 1.5% tax · 5.0% vac · 8.0% maint · 8.0% mgmt
Financing live
Cash to close
- Down payment
- $15,000
- Closing costs
- $1,800
- Reserves months
- —
- Total cash needed
- —
Loan-product check · same deal, 3 products live
Conventional
25% down · 7.5% · 30yr
- Down + closing
- —
- Monthly P&I
- —
- Monthly cashflow
- —
- DSCR
- —
- Eligible?
- —
Personal DTI + credit; lowest rate.
DSCR
20% down · 8.5% · 30yr
- Down + closing
- —
- Monthly P&I
- —
- Monthly cashflow
- —
- DSCR
- —
- Eligible?
- —
No personal income docs; deal must DSCR.
Hard money
10% down · 12.0% · 12mo
- Down + closing
- —
- Monthly P&I
- —
- Monthly cashflow
- —
- DSCR
- —
- Eligible?
- —
Short-term bridge; refi at stabilization.
Rent comps 40 comps
| Address | Beds | Baths | Sqft | Rent | $/sqft | DOM | Units | Dist |
|---|---|---|---|---|---|---|---|---|
| 783 Leonard St Akron, OH | 3.0 | 1.0 | 1040 | $1,250 | $1.20 | 43d | 1 | 0.13mi |
| 991 Diana Ave Akron, OH | 3.0 | 2.0 | 1264 | $1,325 | $1.05 | 43d | 1 | 0.20mi |
| 1092 Peerless Ave Akron, OH | 3.0 | 1.0 | 998 | $1,200 | $1.20 | 43d | 1 | 0.25mi |
| 1040 Mercer Ave Akron, OH | 3.0 | 1.0 | 850 | $1,400 | $1.65 | 21d | 1 | 0.29mi |
| 1494 Diagonal Rd Akron, OH | 3.0 | 1.0 | 1064 | $1,495 | $1.41 | 43d | 1 | 0.46mi |
| 730 Noble Ave Akron, OH | 3.0 | 1.0 | 1092 | $1,200 | $1.10 | 23d | 1 | 0.48mi |
| 1069 Fess Ave Akron, OH | 2.0 | 1.0 | 940 | $1,095 | $1.16 | 43d | 1 | 0.56mi |
| 1090 Hartford Ave Akron, OH | 4.0 | 1.0 | 1328 | $1,125 | $0.85 | 43d | 1 | 0.59mi |
| 685 Longview Ave Akron, OH | 3.0 | 1.0 | 1100 | $1,150 | $1.05 | 43d | 1 | 0.60mi |
| 961 Lawton St Akron, OH | 3.0 | 1.0 | 1144 | $1,450 | $1.27 | 14d | 1 | 0.61mi |
| 844 Lawton St Akron, OH | 4.0 | 2.0 | 1240 | $1,175 | $0.95 | 43d | 1 | 0.65mi |
| 1313 Manchester Rd Akron, OH | 3.0 | 1.0 | 1221 | $1,200 | $0.98 | 21d | 1 | 0.65mi |
| 1310 Bellevue Ave Unit Right Akron, OH | 2.0 | 1.0 | 800 | $990 | $1.24 | 43d | 1 | 0.69mi |
| 1032 Andrew St Akron, OH | 3.0 | 1.0 | 960 | $1,097 | $1.14 | 43d | 1 | 0.70mi |
| 1161 La Croix Ave Akron, OH | 3.0 | 1.0 | 1452 | $1,200 | $0.83 | 23d | 1 | 0.71mi |
| 1171 La Croix Ave Unit 2 Akron, OH | 2.0 | 1.0 | 1267 | $975 | $0.77 | 43d | 1 | 0.72mi |
| 899 Rosamond Ave Akron, OH | 1.0–2.0 | 1.0 | 690 | $825 | $1.20 | 23d | 1 | 0.72mi |
| 575 Noble Ave Akron, OH | 3.0 | 1.0 | 1300 | $1,350 | $1.04 | 14d | 1 | 0.77mi |
| 1328 Thurston St Unit 1328 Akron, OH | 3.0 | 1.0 | 900 | $925 | $1.03 | 23d | 1 | 0.77mi |
| 1326 Thurston St Unit 1326 Akron, OH | 3.0 | 1.0 | 900 | $925 | $1.03 | 23d | 1 | 0.78mi |
| 1331 Thurston St Unit 1326 Akron, OH | 3.0 | 1.0 | 900 | $925 | $1.03 | 43d | 1 | 0.80mi |
| 1335 Thurston St Unit 1335 Akron, OH | 2.0 | 1.0 | 700 | $825 | $1.18 | 14d | 1 | 0.81mi |
| 1339 Thurston St Unit 1339 Akron, OH | 2.0 | 1.0 | 700 | $825 | $1.18 | 43d | 1 | 0.81mi |
| 1161 Seward Ave Akron, OH | 3.0 | 1.5 | 1000 | $1,200 | $1.20 | 14d | 1 | 0.88mi |
| 384 W Bartges St Akron, OH | 2.0 | 1.0 | 1024 | $1,100 | $1.07 | 43d | 1 | 0.88mi |
| 637 Storer Ave Akron, OH | 3.0 | 1.5 | 1322 | $1,250 | $0.95 | 14d | 1 | 0.97mi |
| 465 Grace Ave Akron, OH | 2.0 | 1.0 | 850 | $850 | $1.00 | 43d | 1 | 0.99mi |
| 677 Crossings Ln Akron, OH | 3.0 | 2.5 | 1440 | $1,950 | $1.35 | 23d | 1 | 1.00mi |
| 760 Lakewood Blvd Akron, OH | 3.0 | 2.0 | 1398 | $1,150 | $0.82 | 23d | 1 | 1.07mi |
| 405 Noah Ave Akron, OH | 2.0 | 1.0 | 1000 | $1,050 | $1.05 | 21d | 1 | 1.07mi |
| 781 Saxon Ave Akron, OH | 2.0 | 1.0 | 800 | $900 | $1.12 | 43d | 1 | 1.09mi |
| 1128 Cordova Ave Akron, OH | 2.0 | 1.0 | 840 | $795 | $0.95 | 14d | 1 | 1.09mi |
| 847 Jason Ave Unit 1 Akron, OH | 2.0 | 1.0 | 798 | $825 | $1.03 | 23d | 1 | 1.13mi |
| 960 Jason Ave Akron, OH | 3.0 | 1.5 | 935 | $1,095 | $1.17 | 21d | 1 | 1.17mi |
| 916 Peckham St Akron, OH | 2.0 | 1.0 | 936 | $850 | $0.91 | 43d | 1 | 1.19mi |
| 783 Boulevard St Akron, OH | 4.0 | 1.0 | 1440 | $999 | $0.69 | 23d | 1 | 1.20mi |
| 931 Trimble Dr Akron, OH | 2.0 | 1.5 | 1448 | $1,495 | $1.03 | 23d | 1 | 1.21mi |
| 924 Hamlin St Akron, OH | 3.0 | 1.0 | 1106 | $1,300 | $1.18 | 43d | 1 | 1.24mi |
| 321 Grace Ave Akron, OH | 3.0 | 2.0 | 1484 | $1,175 | $0.79 | 14d | 1 | 1.26mi |
| 601 Glendora Ave Akron, OH | 3.0 | 1.0 | 1310 | $1,200 | $0.92 | 43d | 1 | 1.29mi |
Listing history 6 events
-
2026-05-20status Pending
-
2026-05-16$60,000 Active
-
2001-05-02soldstatus $57,000
-
1997-07-23soldstatus $22,000
-
1997-06-30soldstatus $15,000
-
1991-08-09soldstatus $15,000
ⓘ Source: listings_history table (triggers on properties + properties_extension) + one-shot
backfill from property_details.listing_events for pre-trigger history.
Tax reassessment forecast OH · Partial reset (capped growth)
- Current annual tax
- $1,393 · $116/mo
- Projected year-2 tax
- $1,393 · $116/mo
- Expected delta
- $0/yr ($0/mo · 0.0%)
ⓘ Screening estimate from a state-policy table — verify with the county assessor before closing.
Climate risk First Street
- Flood 1/10 Low FEMA zone X (unshaded) · 0% chance over 30 yrs
- Wildfire 1/10 Low
- Heat 3/10 Moderate 7 d/yr ≥97°F today · 16 d/yr by 30 yrs out
- Wind 1/10 Low
- Air quality 2/10 Low 1 unhealthy d/yr today · 2 by 30 yrs out
Nearby sold comps map
Loading sold comps map…
Walkable amenities ~0.75 mi
Loading nearby amenities…
Taxation est. · year 1
- Rental income
- $14,890
- − Mortgage interest
- −$3,361
- − Property taxes
- −$1,393
- − Insurance
- −$300
- − Repairs & maintenance
- −$1,191
- − Management
- −$1,191
- − Depreciation
- −$1,745
- Taxable income
- $5,708
- Est. tax owed @ 24.0%
- −$1,370
- After-tax cash flow
- $4,924/yr
For passive investors: Depreciation is non-cash, so a rental often shows a tax loss while cash-flowing — sheltering income. Rental losses are passive: they offset passive income freely, and up to $25,000/yr can offset ordinary (W-2) income if you actively participate and your MAGI is under $100k (phasing out to $0 by $150k); unused losses carry forward. On sale, claimed depreciation is recaptured at up to 25%, and gains may owe capital-gains tax (a 1031 exchange can defer both). Figures are a year-1 estimate at your 24.0% rate — not tax advice; consult a CPA.
Schools (NCES district)
- District
- Akron City
- NCES district ID
- 3904348
- Math proficiency
- 22% ▼ -17.00%
- Reading proficiency
- 30% ▼ -12.00%
- Median HH income
- $33,811
- Composite
- 21.31/100
- National rank
- #8383
- State rank
- #602 of 656 in OH
Livability — Akron
- Score
- 81/100
- State rank
- #104
- US rank
- #1591
Category grades
Schools grade is shown separately in the Schools card above.
Census & demographics
- Census place
- Akron, OH
- County
- Summit County · 440,783 people
- City population
- 174,375
- Metro
- Akron, OH
- Population (ZIP)
- 6,653
- Household income
- $27,697
- Rent vs Own
- Severe rent burden
- 787.0
Population outlook (Summit County) Hauer SSP2
- Today (2025)
- 546,583 people
- By 2030
- 544,028 · -0.5%
- By 2040
- 531,363 · -2.8%
- By 2050
- 514,923 · -5.8%
- By 2075
- 481,765 · -11.9%
- By 2100
- 432,265 · -20.9%
Race, ethnicity, and origin ACS 2023
- Neighborhood character
- Predominantly Black (73%)
- Race & ethnicity
- Black 73% White 17% Two or more races 5% Hispanic / Latino 5%
- Common ancestry
- Slovak 1% Romanian 1% Iranian 1%
- Foreign-born
- 2% · Canada
- Languages at home
- 98% English-only · Spanish 2% French/Haitian/Cajun 1%
Political lean MEDSL · Summit
- 2024 margin
- Lean D (+7.0) · D 53.0% · R 46.0%
- 2008→2024 swing
- -9.6pp toward R · 2008: 16.6pp · 2024: 7.0pp
- All cycles
- 2024: D+7.0 2020: D+9.6 2016: D+8.2 2012: D+14.8 2008: D+16.6
Not yet ingested
- Civics
- —
Market trends
- HPI YoY
- ▼ -0.20%
- Current HPI
- 81.3728
- Rent YoY
- —
- Metro
- Akron, OH
- State GDP YoY
- ▲ 1.98%
- F500 in state
- 48
Industry mix (Fortune 500 HQ in OH)
| Industry | F500 HQs | Revenue |
|---|---|---|
| Insurance | 3 | $145B |
|
||
| Industrial Machinery | 3 | $49B |
|
||
| Financial Services | 3 | $24B |
|
||
| Consumer Goods | 2 | $93B |
|
||
| Aerospace / Defense | 2 | $47B |
|
||
| Utilities | 2 | $33B |
|
||
Price history
+300.0% since first listed6 events — show timeline
- 2026-05-20 Pending — MLSNOW
- 2026-05-16 Listed $60,000 MLSNOW
- 2001-05-02 Sold (Public Records) $57,000 Public Records
- 1997-07-23 Sold (Public Records) $22,000 Public Records
- 1997-06-30 Sold (Public Records) $15,000 Public Records
- 1991-08-09 Sold (Public Records) $15,000 Public Records
Property tax history
+2.0%/yrLatest (2025): $1,393 · +0.2% YoY. Source: county tax records.
Cash-flow waterfall
monthlySold comps — $/sqft
last 12 mo · ≤1 miLoading sold comps…