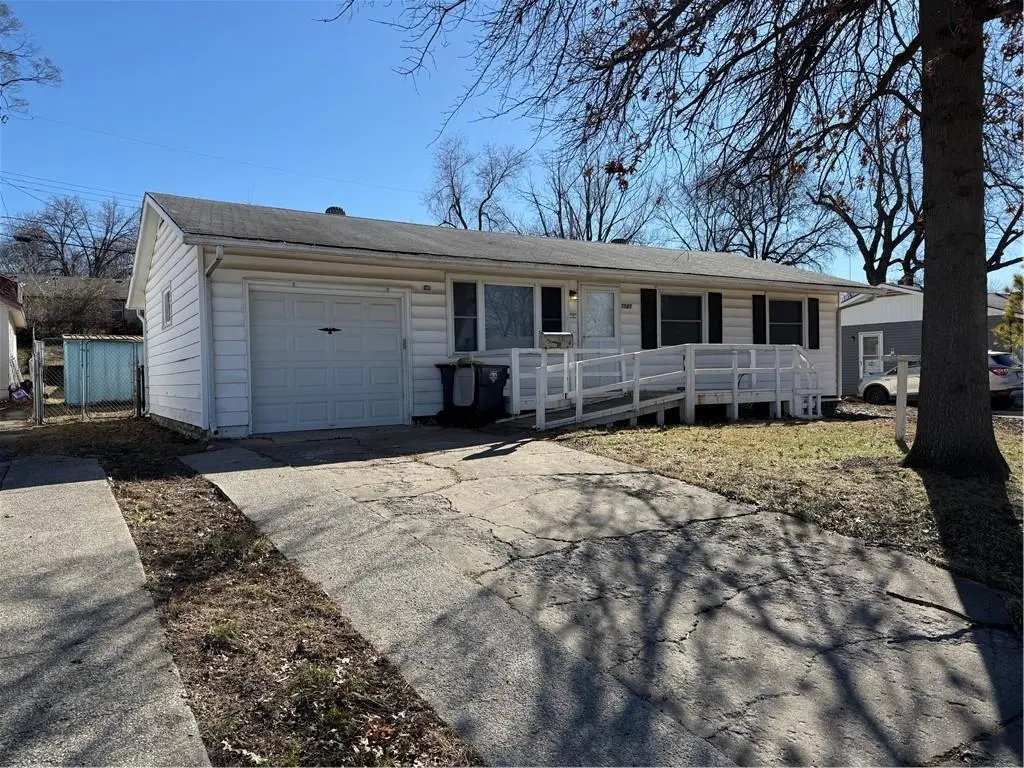
7525 E 52nd St · Kansas City, MO
Flood risk 1/10 · Minimal
- FEMA flood zone
- X (unshaded)
- Chance of flooding over 30 yrs
- 0.0%
- Est. flood insurance / yr
- $473 – $860
Fire risk 2/10 · Minimal
- Est. fire insurance / yr
- $1,054 – $1,958
Heat risk 4/10 · Minor
- Hot days now (above 107°F)
- 7 days/yr
- Hot days in 30 yrs
- 17 days/yr
Wind risk 2/10 · Minimal
- Chance of severe wind over 30 yrs
- —
Air-quality risk 3/10 · Minor
- Unhealthy air days now
- 3 days/yr
- Unhealthy air days in 30 yrs
- 5 days/yr
Risk factors via First Street. Map © Google.
Why this score? — see what drove the F grade
The composite is a weighted blend of 9 inputs, each scored 0–100. Each bar is that input's sub-score; the figure is the points it added to the 100-point composite (weight × sub-score).
- Cash flow +10.6/30.0
- ARV discount +7.5/15.0
- Livability +3.9/5.0
- DSCR +3.1/10.0
- Rent growth +2.5/5.0
- Condition / age +2.5/5.0
- 1% rule +2.2/10.0
- Schools +1.8/10.0
- Appreciation +0.0/10.0
$197,000
🖨 Deal sheet (PDF) 📄 Offer letter ✓ Due diligence
Listing remarks
4-bedroom, 2-bathroom newly updated home in the Raytown C-2 School District. Large lot with fully fenced backyard. Detached 2-story barn (600 sq. ft) with electricity. ADU zoning variance application in process. Will replace roof if purchased.
Key facts
- 7,788 sq ft lot
- Garage
- Built 1960
Tags
Property features AI
Finance
- Other: Property is not in a flood plain
- HOA & community: No association fees; Some maintenance provided
Exterior
- Parking: Has garage; 1 garage space; Combination of attached and detached parking; access to basement parking
- Utilities: Public water; Public sewer
- Home design: Single-family residence; Residential property; Attached property; North-facing; 2 stories
- Construction: Shingle siding exterior; Shingle roof; Above-grade living area estimated at 1,000; Below-grade finished area estimated at 400; Home age approximately 51–75 years
- Exterior features: Metal fencing; Barn(s), detached garage(s), and shed(s) on the property; Lot approximately 7,788 square feet (public records)
Interior
- Bedrooms: 4 bedrooms (three on the main level, one in the basement)
- Bathrooms: 2 full bathrooms (one on the main level, one in the basement)
- Heating & cooling: Natural gas heating; Multiple electric cooling units
- Interior features: 6 total rooms; Workshop in the home; Basement present (partial and full areas)
- Laundry & utility: Laundry located in the basement
Neighborhood map
What this means for you Summary
Snapshot
- This is a 3-bed/2.0-bath single-family listed at $197k.
Deal economics
- At list price, monthly cash flow is $-96 ($-1k/yr) — negative.
- To cash-flow at today's rent, offer at most $180k (8.6% below list).
- To meet the 1% rule (rent ≥ 1% of price), the offer needs to be $143k (27.5% below list).
- Recommended offer: $143k (27.5% below list) — sets the bar for 1% rule.
- Cap rate 5.7% vs local median 3.9% in Kansas City — top-decile yield for the area; either an underpriced asset or a hidden risk that comps aren't pricing in. Stress-test before assuming the spread holds.
Location & tenants
- Location reads 78/100 on livability (#28 in MO, #2,671 nationally) — a middle-class / working-renter tenant base. Strengths: amenities A+, commute A+, cost of living A+; Watch: crime F.
- Raytown C-2 (suburban): math 12% / reading 28% proficiency, ranked #302 of 324 in MO (top 93%) — low school quality limits family demand, transient renter base, plan for 1-2y turnover.
- Zoned schools: Eastwood Hills Elem. (math 8% / reading 22%, grade F, #982 of 1,115 statewide, top 89%, 329 students, 82% FRL); Raytown Middle (math 11% / reading 25%, grade F, #349 of 391 statewide, top 89%, 731 students, 73% FRL); Raytown Sr. High (math 7% / reading 29%, grade F, #482 of 521 statewide, top 92%, 1,365 students, 65% FRL) — zoned schools average 74% FRL vs 54% district-wide (20 pts higher); higher-poverty schools than district average — tighter screening recommended.
- Market conditions: 53 active listings in the ZIP; 8 comparable units currently listed for rent nearby; rentals lingering (median 46d on market — plan ~5-8 weeks vacancy on turnover, expect pricing pressure); 50% of comp listings sitting > 30 days — soft ceiling on asking rent; 4,002 units permitted in Jackson County in 2024 (2,271 in 5+ unit buildings).
- This rent runs 33% of the median local income ($51k/yr) — at the standard rent-burdened threshold; future hikes will face affordability resistance.
Forward outlook
- Local home prices are declining (-3.0%/yr); year-one equity from $1k of loan paydown is wiped out by about $6k of value loss. Plan a longer hold.
- Jackson County population projected at +4% by 2050 — modest demand growth; plan on rents tracking national, not racing it.
Negotiation context
- It's been on market 24 days — a 2% lower offer ($194k) is reasonable based on typical stale-listing flexibility.
- 3 sale attempts; this cycle's ask has dropped $26k (12%) from the opening price — seller is motivated, your offer sets the floor, not the list.
Questions for the listing agent
- What do current leases actually rent for vs. the listed asking? Can we see a recent rent roll and the last 12 months of T-12 income?
- Built in 1960 — when were the roof, HVAC, electrical panel, plumbing, and water heater last replaced?
- Is there a deadline driving the sale (1031 exchange, divorce, estate, relocation)? That informs how much negotiation room exists.
- Crime grade is F in this area — have there been break-ins, vandalism, or insurance claims at this property in the last 3 years? What carrier currently insures it and at what premium?
- The area grade is low — what's the realistic commute time and amenity access for the typical tenant pool here? Any planned neighborhood developments (good or bad) we should know about?
- What's the average days-on-market for RENTAL listings here right now (not sales)? A rising rental-DOM trend means longer vacancies and softer asking-rent achievability than the comps imply.
- What's the recent tenant-quality profile in this submarket — average credit score on applications, eviction rate, late-payment / NSF rate, and stable-employment percentage? A property-management company in the area should have these aggregated.
- How much new for-sale + rental construction is in the pipeline within 1–3 miles? Heavy new supply typically softens prices + rents 12–24 months out; constrained supply supports both.
Investment metrics
- 1% rule
- 0.72% ✗
- Cap rate
- 5.71%
- Cash-on-cash
- -2.08%
- DSCR
- 0.91
- GRM
- 11.5
CMA / ARV
- ARV (on-the-fly)
- $127,008
- Comps found
- 12
Show comp detail 12 sales within ~0.75 mi
| Address | Dist | Beds/Ba | Sqft | Sold | Price | $/sf | Match |
|---|---|---|---|---|---|---|---|
| 5130 Palmer St | 0.14mi | 3/1.0 | 864 (0%) | 1mo | $124,900 | $145 | 88 |
| 7803 E 50th Ter | 0.26mi | 3/1.5 | 864 (0%) | 6mo | $174,900 | $202 | 81 |
| 7405 E 49th St | 0.34mi | 3/1.0 | 864 (0%) | 2mo | $82,000 | $95 | 78 |
| 7409 E 49th St | 0.34mi | 3/1.0 | 864 (0%) | 8mo | $36,000 | $42 | 73 |
| 7610 E 49th Ter | 0.36mi | 2/1.0 (-1) | 864 (0%) | 5mo | $59,999 | $69 | 70 |
| 4834 Eastern Ave | 0.37mi | 3/1.0 | 912 (+6%) | 4mo | $155,000 | $170 | 66 |
| 7719 E 47th Ter | 0.59mi | 3/1.0 | 840 (-3%) | 9mo | $125,000 | $149 | 56 |
| 7407 E 56th Ter | 0.55mi | 2/1.0 (-1) | 844 (-2%) | 8mo | $95,000 | $113 | 55 |
| 7726 Sni A Bar Rd | 0.38mi | 3/1.0 | 984 (+14%) | 1mo | $145,000 | $147 | 54 |
| 5002 Skiles Ave | 0.42mi | 3/1.0 | 984 (+14%) | 1mo | $150,000 | $152 | 52 |
| 7801 Ozark Rd | 0.66mi | 3/1.0 | 816 (-6%) | 8mo | $110,000 | $135 | 50 |
| 7819 E 58th St | 0.72mi | 3/2.0 | 986 (+14%) | 2mo | $172,200 | $175 | 41 |
Match score weights: distance 35% · size 25% · config 20% · recency 20%. Top-matched comps best support the ARV.
Projected returns pro-forma
-3.0% appreciation · 3.0% rent growth · sell at horizon
- IRR
- -19.8%
- Equity multiple
- 0.31×
- Total profit
- $-38,088
- Equity at exit
- $29,373
- IRR
- -12.8%
- Equity multiple
- 0.25×
- Total profit
- $-41,282
- Equity at exit
- $17,033
Cash invested: $55,160 (down + closing). Projections, not guarantees.
Landlord ↔ Tenant lean methodology
- Overall (STATE)
- 81 Strongly Landlord-Friendly
- State Missouri
- 81 Strongly Landlord-Friendly · R+10
- County
- — inherits STATE
- City
- — inherits STATE
ZIP-level market 64129
- Home prices YoY
- -9.8%
- Active inventory
- 53
- Price-to-rent
- 11.5×
Monthly cashflow live
- Estimated rent
- $1,427 high interval (Pro) →
- Mortgage (P&I)
- −$1,033
- Tax from tax record
- −$108 /mo · $1,299/yr
- Insurance
- −$82
- HOA
- −$0
- Vacancy / Maint / Mgmt
- −$300
- Net cashflow
- $-96
Break-even live
Sensitivity live
| Price | -10% $16 | -5% $-40 | +0% $-96 | +5% $-152 | +10% $-207 |
|---|---|---|---|---|---|
| Rent | -10% $-209 | -5% $-152 | +0% $-96 | +5% $-39 | +10% $17 |
| Rate | -1.0pp $3 | -0.5pp $-46 | base $-96 | +0.5pp $-147 | +1.0pp $-199 |
UW: 25.0% down · 7.5% · 30yr · 1.5% tax · 5.0% vac · 8.0% maint · 8.0% mgmt
Financing live
Cash to close
- Down payment
- $49,250
- Closing costs
- $5,910
- Reserves months
- —
- Total cash needed
- —
Loan-product check · same deal, 3 products live
Conventional
25% down · 7.5% · 30yr
- Down + closing
- —
- Monthly P&I
- —
- Monthly cashflow
- —
- DSCR
- —
- Eligible?
- —
Personal DTI + credit; lowest rate.
DSCR
20% down · 8.5% · 30yr
- Down + closing
- —
- Monthly P&I
- —
- Monthly cashflow
- —
- DSCR
- —
- Eligible?
- —
No personal income docs; deal must DSCR.
Hard money
10% down · 12.0% · 12mo
- Down + closing
- —
- Monthly P&I
- —
- Monthly cashflow
- —
- DSCR
- —
- Eligible?
- —
Short-term bridge; refi at stabilization.
Rent comps 8 comps
| Address | Beds | Baths | Sqft | Rent | $/sqft | DOM | Units | Dist |
|---|---|---|---|---|---|---|---|---|
| 7615 E 49th St Kansas City, MO | 2.0 | 1.0 | 888 | $1,095 | $1.23 | 45d | 1 | 0.46mi |
| 7601 Sni a Bar Ter Kansas City, MO | 2.0 | 1.0 | 827 | $1,099 | $1.33 | 45d | 1 | 0.46mi |
| 5126 Booth Ave Kansas City, MO | 2.0 | 1.0 | 950 | $1,149 | $1.21 | 14d | 1 | 0.58mi |
| 4730 Richmond Ave Kansas City, MO | 3.0 | 1.0 | 821 | $1,395 | $1.70 | 45d | 1 | 0.60mi |
| 7611 E 47th Ter Kansas City, MO | 3.0 | 1.0 | 840 | $1,276 | $1.52 | 9d | 1 | 0.62mi |
| 5312 Hunter St Raytown, MO | 3.0 | 1.5 | 912 | $1,450 | $1.59 | 3d | 1 | 1.04mi |
| 5312 Hunter St Raytown, MO | 3.0 | 1.5 | 912 | $1,450 | $1.59 | 4d | 1 | 1.04mi |
| 8855 E 59th St Raytown, MO | 3.0 | 1.5 | 864 | $1,396 | $1.62 | 45d | 1 | 1.28mi |
Listing history 25 events
-
2026-06-21days on market $197,000 Active 24 DOM
-
2026-06-18days on market $197,000 Active 21 DOM
-
2026-06-17days on market $197,000 Active 20 DOM
-
2026-06-16days on market $197,000 Active 19 DOM
-
2026-06-15days on market $197,000 Active 18 DOM
-
2026-06-13days on market $197,000 Active 16 DOM
-
2026-06-13days on market $197,000 Active 15 DOM
-
2026-06-09days on market $197,000 Active 12 DOM
-
2026-06-08days on market $197,000 Active 11 DOM
-
2026-06-07remarks 243-char remark
-
2026-06-07days on market $197,000 Active 10 DOM
-
2026-06-03days on market $197,000 Active 6 DOM
-
2026-06-02days on market $197,000 Active 5 DOM
-
2026-06-02price $197,000 Active 4 DOM
-
2026-06-01days on market $223,000 Active 4 DOM
-
2026-05-31days on market $223,000 Active 3 DOM
-
2026-05-28$223,000 Active
-
2025-12-08historical
-
2025-11-19price $129,000
-
2025-11-11status Active
-
2025-10-22status Pending
-
2025-10-14price $139,000
-
2025-10-07$149,000 Active
-
2025-09-23soldstatus
-
1962-11-01soldstatus
ⓘ Source: listings_history table (triggers on properties + properties_extension) + one-shot
backfill from property_details.listing_events for pre-trigger history.
Tax reassessment forecast MO · Resets to sale price
- Current annual tax
- $1,299 · $108/mo
- Projected year-2 tax
- $1,911 · $159/mo
- Expected delta
- +$612/yr (+$51/mo · 47.1%)
ⓘ Screening estimate from a state-policy table — verify with the county assessor before closing.
Climate risk First Street
- Flood 1/10 Low FEMA zone X (unshaded) · 0% chance over 30 yrs
- Wildfire 2/10 Low
- Heat 4/10 Moderate 7 d/yr ≥107°F today · 17 d/yr by 30 yrs out
- Wind 2/10 Low
- Air quality 3/10 Moderate 3 unhealthy d/yr today · 5 by 30 yrs out
Nearby sold comps map
Loading sold comps map…
Walkable amenities ~0.75 mi
Loading nearby amenities…
Taxation est. · year 1
- Rental income
- $17,128
- − Mortgage interest
- −$11,035
- − Property taxes
- −$1,299
- − Insurance
- −$985
- − Repairs & maintenance
- −$1,370
- − Management
- −$1,370
- − Depreciation
- −$5,731
- Taxable loss
- −$4,662
- Est. tax savings @ 24.0%
- +$1,119
- After-tax cash flow
- $-31/yr
For passive investors: Depreciation is non-cash, so a rental often shows a tax loss while cash-flowing — sheltering income. Rental losses are passive: they offset passive income freely, and up to $25,000/yr can offset ordinary (W-2) income if you actively participate and your MAGI is under $100k (phasing out to $0 by $150k); unused losses carry forward. On sale, claimed depreciation is recaptured at up to 25%, and gains may owe capital-gains tax (a 1031 exchange can defer both). Figures are a year-1 estimate at your 24.0% rate — not tax advice; consult a CPA.
Schools (NCES district)
- District
- Raytown C-2
- NCES district ID
- 2926070
- Math proficiency
- 12% ▼ -11.00%
- Reading proficiency
- 28% ▼ -9.00%
- Median HH income
- $47,215
- Composite
- 17.59/100
- National rank
- #9039
- State rank
- #302 of 324 in MO
Livability — Kansas City
- Score
- 78/100
- State rank
- #28
- US rank
- #2671
Category grades
Schools grade is shown separately in the Schools card above.
Census & demographics
- Census place
- Kansas City, MO
- County
- Jackson County · 687,798 people
- City population
- 439,467
- Metro
- Kansas City, MO-KS
- Population (ZIP)
- 9,267
- Household income
- $51,310
- Rent vs Own
- Severe rent burden
- 349.0
Population outlook (Jackson County) Hauer SSP2
- Today (2025)
- 719,589 people
- By 2030
- 731,456 · +1.6%
- By 2040
- 746,689 · +3.8%
- By 2050
- 749,289 · +4.1%
- By 2075
- 736,227 · +2.3%
- By 2100
- 668,210 · -7.1%
Race, ethnicity, and origin ACS 2023
- Neighborhood character
- Diverse neighborhood (Simpson 0.65)
- Race & ethnicity
- Black 45% White 37% Hispanic / Latino 11% Two or more races 9%
- Hispanic origin (detail)
- Mexican 6%
- Common ancestry
- Lithuanian 4% Italian 2% Armenian 1%
- Foreign-born
- 8% · Canada
- Languages at home
- 87% English-only · Spanish 8% Arabic 1%
Political lean MEDSL · Jackson
- 2024 margin
- D (+19.3) · D 58.9% · R 39.5% · Other 1.6%
- 2008→2024 swing
- -6.1pp toward R · 2008: 25.4pp · 2024: 19.3pp
- All cycles
- 2024: D+19.3 2020: D+22.0 2016: D+16.6 2012: D+19.0 2008: D+25.4
Not yet ingested
- Civics
- —
Market trends
- HPI YoY
- ▼ -32.25%
- Current HPI
- 297.5233
- Rent YoY
- —
- Metro
- Kansas City, MO-KS
- State GDP YoY
- ▲ 1.84%
- F500 in state
- 20
Industry mix (Fortune 500 HQ in MO)
| Industry | F500 HQs | Revenue |
|---|---|---|
| Healthcare | 1 | $163B |
|
||
| Insurance | 1 | $21B |
|
||
| Industrial Technology | 1 | $17B |
|
||
| Retail | 1 | $16B |
|
||
| Industrial Distribution | 1 | $10B |
|
||
| Utilities | 1 | $9B |
|
||
Price history
+49.7% since first listed9 events — show timeline
- 2026-05-28 Listed $223,000 Heartland MLS as Distributed by MLS Grid
- 2025-12-08 Listing Removed — Heartland MLS as Distributed by MLS Grid
- 2025-11-19 Price Changed $129,000 Heartland MLS as Distributed by MLS Grid
- 2025-11-11 Relisted — Heartland MLS as Distributed by MLS Grid
- 2025-10-22 Pending — Heartland MLS as Distributed by MLS Grid
- 2025-10-14 Price Changed $139,000 Heartland MLS as Distributed by MLS Grid
- 2025-10-07 Listed $149,000 Heartland MLS as Distributed by MLS Grid
- 2025-09-23 Sold (Public Records) — Public Records
- 1962-11-01 Sold (Public Records) — Public Records
Property tax history
+2.2%/yrLatest (2025): $1,299 · +1.9% YoY. Source: county tax records.
Cash-flow waterfall
monthlySold comps — $/sqft
last 12 mo · ≤1 miLoading sold comps…