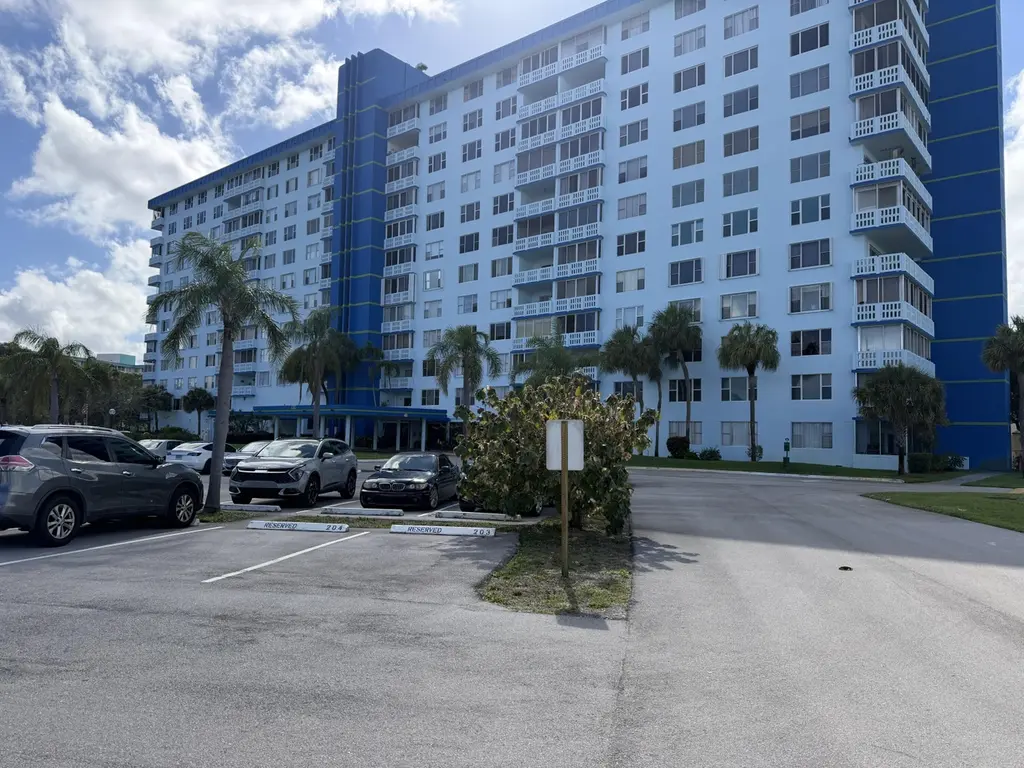
4001 Hillcrest Dr #510 · Hollywood, FL
Flood risk 1/10 · Minimal
- FEMA flood zone
- AH
- Chance of flooding over 30 yrs
- 0.0%
- Est. flood insurance / yr
- $1,142 – $2,507
Fire risk 1/10 · Minimal
- Est. fire insurance / yr
- $947 – $1,759
Heat risk 10/10 · Severe
- Hot days now (above 105°F)
- 6 days/yr
- Hot days in 30 yrs
- 22 days/yr
Wind risk 10/10 · Severe
- Chance of severe wind over 30 yrs
- 99.0%
Air-quality risk 2/10 · Minimal
- Unhealthy air days now
- 2 days/yr
- Unhealthy air days in 30 yrs
- 2 days/yr
Risk factors via First Street. Map © Google.
Why this score? — see what drove the B- grade
The composite is a weighted blend of 9 inputs, each scored 0–100. Each bar is that input's sub-score; the figure is the points it added to the 100-point composite (weight × sub-score).
- Cash flow +28.9/30.0
- 1% rule +10.0/10.0
- DSCR +10.0/10.0
- ARV discount +7.5/15.0
- Schools +4.1/10.0
- Livability +3.8/5.0
- Rent growth +3.1/5.0
- Condition / age +2.5/5.0
- Appreciation +0.0/10.0
$183,000
🖨 Deal sheet (PDF) 📄 Offer letter ✓ Due diligence
Listing remarks
Established condominium community with strong HOA rules, has 24 hr security with great access to major roads, close to shopping, hospitals etc. Unit is located in close proximity to elevators and laundry room. Desireable location on the 5th floor green area views and pond.
Key facts
- Desireable location
- City views
- 24 hr security
Tags
Property features AI
Finance
- Financial info: Pets not allowed
- HOA & community: Association amenities include pool, security, and maintenance; Monthly HOA fee of $659 covering common areas; Has association; Senior community
Exterior
- Parking: Assigned parking on asphalt; 1 open parking space total
- Security: Community security
- Utilities: Public water; Public sewer; Cable available; Electricity available; Sewer connected; Water connected
- Home design: Condominium; 12-story building; Resale condition; Faces east
- Construction: Block/CBS construction; Built-Up roof; Slab foundation; Building area approximately 1,132 (source: assessor)
- Exterior features: No waterfront; City street and private road frontage
Interior
- Kitchen: Refrigerator; Electric cooktop
- Bedrooms: 2 bedrooms on the main level
- Flooring: Laminate; Other
- Bathrooms: 2 full bathrooms on the main level
- Heating & cooling: Central heating; Central electric air conditioning
- Interior features: Furnished; Accessible doors and common area accessibility
- Laundry & utility: Washer/dryer hookup not specified
Neighborhood map
What this means for you Summary
Snapshot
- This is a 2-bed/2.0-bath condo listed at $183k.
Deal economics
- At list price, monthly cash flow is $467 ($6k/yr) — positive.
- The deal already cash-flows at list — no discount required.
- Meets the 1% rule at list price ($3k rent vs $183k).
- Recommended offer: $172k (6.0% below list) — sets the bar for market timing.
- Cap rate 10.4% vs local median 3.2% in Hollywood — top-decile yield for the area; either an underpriced asset or a hidden risk that comps aren't pricing in. Stress-test before assuming the spread holds.
Location & tenants
- Location reads 76/100 on livability (#232 in FL, #3,548 nationally) — a middle-class / working-renter tenant base. Strengths: commute A+, housing A+, crime B+; Watch: amenities D.
- Broward (suburban): math 42% / reading 53% proficiency, ranked #46 of 73 in FL (top 63%) — families likely to look elsewhere, expect single-tenant / working-renter base with shorter leases.
- Zoned schools: Orange Brook Elementary School (math 27% / reading 34%, grade F, #1,862 of 2,144 statewide, top 88%, 679 students, 80% FRL); Mcnicol Middle School (math 25% / reading 31%, grade F, #486 of 571 statewide, top 86%, 643 students, 80% FRL); Hallandale High School (math 10% / reading 24%, grade F, #597 of 667 statewide, top 90%, 1,104 students, 70% FRL) — zoned schools average 77% FRL vs 51% district-wide (25 pts higher); higher-poverty schools than district average — tighter screening recommended.
- Zoned-school proficiency averages 25% at this address vs 48% district-wide (-22 pts) — the specific schools serving this property underperform the Broward average; the district grade overstates school quality for this exact location.
- Market conditions: Rents rising (+2.4%/yr); 538 active listings in the ZIP; 40 comparable units currently listed for rent nearby; rentals at typical pace (median 26d on market — plan ~3-4 weeks tenant-placement turnaround); 2,111 units permitted in Broward County in 2024 (1,265 in 5+ unit buildings).
- At $3,002/mo this rent would consume 51% of the median local household income ($71k/yr) (locally 2151% of renters already pay >50% of income on rent) — very limited rent-growth headroom before tenants either downsize or default.
Forward outlook
- Local home prices are declining (-3.0%/yr); year-one equity from $1k of loan paydown is wiped out by about $5k of value loss. Plan a longer hold.
- Broward County population projected at +34% by 2050 — long-run rental-demand tailwind backs the buy-and-hold thesis.
Negotiation context
- It's been on market 68 days — a 6% lower offer ($172k) is reasonable based on typical stale-listing flexibility.
Risks & watch-outs
- Watch-outs: flood insurance adds $152/mo; HOA is 22% of rent.
- Climate carrying-cost: in FEMA flood zone AH (mandatory federal flood insurance); severe wind risk, 99% chance of damaging wind over 30y; extreme-heat days projected 6→22/yr by 2055 (HVAC capex compounding) — expect insurance premiums to compound above CPI over the hold.
Questions for the listing agent
- It's been on market 68 days. Have you received any prior offers? Is the seller open to a 6% concession, seller financing, or rate buy-down credit?
- Built in 1979 — when were the roof, HVAC, electrical panel, plumbing, and water heater last replaced?
- What's the actual annual flood-insurance premium (NFIP or private), and is the property in a SFHA with mandatory coverage?
- What does the HOA fee cover, when was the last increase, and are there any pending special assessments or reserve-fund shortfalls?
- Any open or pending special assessments — roof, HVAC, plumbing, elevator, façade? What's the per-unit balance and payoff schedule, and is the seller paying it off at close or rolling it to the buyer?
- Why hasn't it sold? Are there any deal-killer items the seller is aware of (foundation, flood, title, zoning, code violations)?
- Is there a deadline driving the sale (1031 exchange, divorce, estate, relocation)? That informs how much negotiation room exists.
- What's the average days-on-market for RENTAL listings here right now (not sales)? A rising rental-DOM trend means longer vacancies and softer asking-rent achievability than the comps imply.
- What's the recent tenant-quality profile in this submarket — average credit score on applications, eviction rate, late-payment / NSF rate, and stable-employment percentage? A property-management company in the area should have these aggregated.
- How much new apartment / multifamily construction is in the pipeline within 1–3 miles? Heavy new supply (>2% of stock underway) typically softens rents 12–24 months out; light construction supports rent growth.
Investment metrics
- 1% rule
- 1.64% ✓
- Cap rate
- 10.35%
- Cash-on-cash
- 14.49%
- DSCR
- 1.64
- GRM
- 5.1
CMA / ARV
No comps found within radius.
Projected returns pro-forma
-3.0% appreciation · 2.41% rent growth · sell at horizon
- IRR
- -0.7%
- Equity multiple
- 0.98×
- Total profit
- $-1,259
- Equity at exit
- $27,286
- IRR
- 8.4%
- Equity multiple
- 1.62×
- Total profit
- $31,781
- Equity at exit
- $15,822
Cash invested: $51,240 (down + closing). Projections, not guarantees.
Landlord ↔ Tenant lean methodology
- Overall (STATE)
- 87 Strongly Landlord-Friendly
- State Florida
- 87 Strongly Landlord-Friendly · R+3
- County
- — inherits STATE
- City
- — inherits STATE
ZIP-level market 33021
- Rents YoY
- 2.4%
- Active inventory
- 538
- Price-to-rent
- 5.1×
Monthly cashflow live
- Estimated rent
- $3,002 high interval (Pro) →
- Mortgage (P&I)
- −$960
- Tax from tax record
- −$58 /mo · $695/yr
- Insurance
- −$76
- Flood insurance flood zone
- −$152 /mo · $1,824/yr
- HOA
- −$659
- Vacancy / Maint / Mgmt
- −$630
- Net cashflow
- $467
Break-even live
Sensitivity live
| Price | -10% $570 | -5% $519 | +0% $467 | +5% $415 | +10% $363 |
|---|---|---|---|---|---|
| Rent | -10% $230 | -5% $348 | +0% $467 | +5% $585 | +10% $704 |
| Rate | -1.0pp $559 | -0.5pp $513 | base $467 | +0.5pp $419 | +1.0pp $371 |
UW: 25.0% down · 7.5% · 30yr · 1.5% tax · 5.0% vac · 8.0% maint · 8.0% mgmt
Financing live
Cash to close
- Down payment
- $45,750
- Closing costs
- $5,490
- Reserves months
- —
- Total cash needed
- —
Loan-product check · same deal, 3 products live
Conventional
25% down · 7.5% · 30yr
- Down + closing
- —
- Monthly P&I
- —
- Monthly cashflow
- —
- DSCR
- —
- Eligible?
- —
Personal DTI + credit; lowest rate.
DSCR
20% down · 8.5% · 30yr
- Down + closing
- —
- Monthly P&I
- —
- Monthly cashflow
- —
- DSCR
- —
- Eligible?
- —
No personal income docs; deal must DSCR.
Hard money
10% down · 12.0% · 12mo
- Down + closing
- —
- Monthly P&I
- —
- Monthly cashflow
- —
- DSCR
- —
- Eligible?
- —
Short-term bridge; refi at stabilization.
Rent comps 40 comps
| Address | Beds | Baths | Sqft | Rent | $/sqft | DOM | Units | Dist |
|---|---|---|---|---|---|---|---|---|
| 3932 Long Leaf Ln #1 Hollywood, FL | 3.0 | 2.5 | 1675 | $3,400 | $2.03 | 25d | 1 | 0.09mi |
| 1101 Banyan Dr Hollywood, FL | 3.0 | 2.0 | 1768 | $4,100 | $2.32 | 25d | 1 | 0.12mi |
| 4200 Hillcrest Dr #503 Hollywood, FL | 2.0 | 2.0 | 1132 | $2,300 | $2.03 | 25d | 1 | 0.13mi |
| 839 S Highland Dr Hollywood, FL | 2.0 | 2.0 | 1748 | $2,500 | $1.43 | 9d | 1 | 0.27mi |
| 839 S Highland Dr Hollywood, FL | 2.0 | 2.0 | 1748 | $3,000 | $1.72 | 25d | 1 | 0.27mi |
| 919 Hillcrest Dr #303 Hollywood, FL | 2.0 | 2.0 | 1100 | $2,000 | $1.82 | 25d | 1 | 0.31mi |
| 4209 Jefferson St Unit 4209 Hollywood, FL | 3.0 | 2.0 | 1697 | $7,200 | $4.24 | 3d | 1 | 0.32mi |
| 632 S Crescent Dr Unit 1533630P Hollywood, FL | 3.0 | 2.0 | 1743 | $7,380 | $4.23 | 9d | 1 | 0.35mi |
| 632 S Crescent Dr Hollywood, FL | 3.0 | 2.0 | 1744 | $6,500 | $3.73 | 25d | 1 | 0.35mi |
| 911 S Park Rd Hollywood, FL | 1.0–3.0 | 1.0–2.0 | 1123 | $2,715 | $2.42 | 0d | 25 | 0.38mi |
| 555 S Luna Ct Hollywood, FL | 2.0 | 2.0 | 1036 | $2,120 | $2.05 | 6d | 2 | 0.44mi |
| 812 S Park Rd Hollywood, FL | 1.0–3.0 | 1.0–2.0 | 999 | $2,353 | $2.36 | 0d | 23 | 0.45mi |
| 400 S Luna Ct #2 Hollywood, FL | 2.0 | 1.0 | 960 | $2,300 | $2.40 | 25d | 1 | 0.48mi |
| 3624 Jackson St Unit 21 Hollywood, FL | 2.0 | 2.0 | 1100 | $1,900 | $1.73 | 4d | 1 | 0.49mi |
| 570 S Park Rd Unit 13-6 Hollywood, FL | 2.0 | 2.0 | 1060 | $2,400 | $2.26 | 25d | 1 | 0.50mi |
| 530 S Park Rd Hollywood, FL | 2.0 | 2.0 | 1060 | $2,375 | $2.24 | 20d | 1 | 0.52mi |
| 640 S Park Rd Unit 34-4 Hollywood, FL | 2.0 | 2.0 | 1060 | $2,250 | $2.12 | 25d | 1 | 0.52mi |
| 640 S Park Rd Unit 14-4 Hollywood, FL | 2.0 | 2.0 | 1060 | $2,300 | $2.17 | 25d | 1 | 0.52mi |
| 640 S Park Rd Unit 12-4 Hollywood, FL | 3.0 | 2.0 | 1236 | $2,950 | $2.39 | 25d | 1 | 0.52mi |
| 640 S Park Rd Unit 14-4 Hollywood, FL | 2.0 | 2.0 | 1060 | $2,200 | $2.08 | 18d | 1 | 0.52mi |
| 3500 Jackson St Unit 203 Hollywood, FL | 2.0 | 2.0 | 875 | $1,995 | $2.28 | 25d | 1 | 0.53mi |
| 1455 Silk Oak Dr #1455 Hollywood, FL | 3.0 | 2.5 | 1800 | $4,100 | $2.28 | 25d | 1 | 0.55mi |
| 1455 Silk Oak Dr #1455 Hollywood, FL | 3.0 | 2.5 | 1800 | $4,250 | $2.36 | 9d | 1 | 0.55mi |
| 4802 Washington St #5 Hollywood, FL | 2.0 | 2.0 | 1080 | $2,500 | $2.31 | 25d | 1 | 0.55mi |
| 3600 Van Buren St Hollywood, FL | 1.0–2.0 | 1.0–2.0 | 1055 | $2,350 | $2.23 | 0d | 5 | 0.56mi |
| 450 S Park Rd Unit 5-307 Hollywood, FL | 3.0 | 2.0 | 1084 | $2,800 | $2.58 | 25d | 1 | 0.56mi |
| 470 S Park Rd Unit 7-307 Hollywood, FL | 3.0 | 2.0 | 1084 | $3,250 | $3.00 | 25d | 1 | 0.56mi |
| 3501 Jackson St #309 Hollywood, FL | 2.0 | 2.0 | 1170 | $2,500 | $2.14 | 25d | 1 | 0.56mi |
| 4764 Eucalyptus Dr Hollywood, FL | 3.0 | 2.5 | 1780 | $3,950 | $2.22 | 25d | 1 | 0.56mi |
| 4764 Eucalyptus Dr Hollywood, FL | 3.0 | 2.5 | 1780 | $3,950 | $2.22 | 15d | 1 | 0.56mi |
| 4812 Washington St #7 Hollywood, FL | 2.0 | 2.0 | 1080 | $2,200 | $2.04 | 20d | 1 | 0.57mi |
| 4812 Washington St Unit 147 Hollywood, FL | 2.0 | 2.0 | 1080 | $2,200 | $2.04 | 9d | 1 | 0.58mi |
| 460 S Park Rd Unit 6-304 Hollywood, FL | 2.0 | 1.0 | 918 | $1,950 | $2.12 | 6d | 1 | 0.58mi |
| 981 Hillcrest Ct #114 Hollywood, FL | 2.0 | 2.0 | 899 | $2,000 | $2.22 | 25d | 1 | 0.59mi |
| 3601 Van Buren St Hollywood, FL | 2.0 | 2.0 | 1107 | $2,195 | $1.98 | 0d | 2 | 0.59mi |
| 4810 Eucalyptus Dr #3 Hollywood, FL | 3.0 | 2.5 | 1421 | $3,200 | $2.25 | 22d | 1 | 0.60mi |
| 530 S Park Rd Unit 17-11 Hollywood, FL | 2.0 | 2.0 | 1060 | $2,300 | $2.17 | 23d | 1 | 0.60mi |
| 530 S Park Rd Unit 12-11 Hollywood, FL | 2.0 | 2.0 | 1060 | $2,375 | $2.24 | 16d | 1 | 0.60mi |
| 4901 Washington St Hollywood, FL | 3.0 | 3.0 | 1397 | $4,850 | $3.47 | 25d | 1 | 0.60mi |
| 4901 Washington St Hollywood, FL | 3.0 | 3.0 | 1397 | $4,850 | $3.47 | 6d | 1 | 0.60mi |
HOA detail condo
- Monthly dues
- $659 · $7,908/yr
- Likely covers
- security
- Assessments
- None detected in remarks — confirm with the listing agent.
Listing history 20 events
-
2026-06-21days on market $183,000 Active 68 DOM
-
2026-06-18days on market $183,000 Active 65 DOM
-
2026-06-17days on market $183,000 Active 64 DOM
-
2026-06-16days on market $183,000 Active 63 DOM
-
2026-06-15price $183,000 Active 62 DOM
-
2026-06-15days on market $188,000 Active 62 DOM
-
2026-06-13days on market $188,000 Active 60 DOM
-
2026-06-09days on market $188,000 Active 56 DOM
-
2026-06-08days on market $188,000 Active 55 DOM
-
2026-06-07days on market $188,000 Active 54 DOM
-
2026-06-04days on market $188,000 Active 51 DOM
-
2026-06-03days on market $188,000 Active 50 DOM
-
2026-06-02days on market $188,000 Active 49 DOM
-
2026-06-01days on market $188,000 Active 48 DOM
-
2026-05-31days on market $188,000 Active 47 DOM
-
2026-05-11price $188,000
-
2026-04-14$192,000 Active
-
2005-10-03soldstatus $190,000
-
1999-12-01soldstatus $53,000
-
1989-11-08soldstatus $50,000
ⓘ Source: listings_history table (triggers on properties + properties_extension) + one-shot
backfill from property_details.listing_events for pre-trigger history.
Tax reassessment forecast FL · Resets to sale price
- Current annual tax
- $695 · $58/mo
- Projected year-2 tax
- $1,519 · $127/mo
- Expected delta
- +$824/yr (+$69/mo · 118.5%)
ⓘ Screening estimate from a state-policy table — verify with the county assessor before closing.
Climate risk First Street
- Flood 1/10 Low FEMA zone AH · 0% chance over 30 yrs
- Wildfire 1/10 Low
- Heat 10/10 Extreme 6 d/yr ≥105°F today · 22 d/yr by 30 yrs out
- Wind 10/10 Extreme 99% chance of damaging wind over 30 yrs
- Air quality 2/10 Low 2 unhealthy d/yr today · 2 by 30 yrs out
Nearby sold comps map
Loading sold comps map…
Walkable amenities ~0.75 mi
Loading nearby amenities…
Taxation est. · year 1
- Rental income
- $36,025
- − Mortgage interest
- −$10,251
- − Property taxes
- −$695
- − Insurance
- −$2,740
- − Repairs & maintenance
- −$2,882
- − Management
- −$2,882
- − HOA
- −$7,908
- − Depreciation
- −$5,324
- Taxable income
- $3,344
- Est. tax owed @ 24.0%
- −$803
- After-tax cash flow
- $4,799/yr
For passive investors: Depreciation is non-cash, so a rental often shows a tax loss while cash-flowing — sheltering income. Rental losses are passive: they offset passive income freely, and up to $25,000/yr can offset ordinary (W-2) income if you actively participate and your MAGI is under $100k (phasing out to $0 by $150k); unused losses carry forward. On sale, claimed depreciation is recaptured at up to 25%, and gains may owe capital-gains tax (a 1031 exchange can defer both). Figures are a year-1 estimate at your 24.0% rate — not tax advice; consult a CPA.
Schools (NCES district)
- District
- Broward
- NCES district ID
- 1200180
- Math proficiency
- 42% ▼ -18.00%
- Reading proficiency
- 53% ▼ -5.00%
- Median HH income
- $52,139
- Composite
- 40.88/100
- National rank
- #3621
- State rank
- #46 of 73 in FL
Livability — Hollywood
- Score
- 76/100
- State rank
- #232
- US rank
- #3548
Category grades
Schools grade is shown separately in the Schools card above.
Census & demographics
- Census place
- Hollywood, FL
- County
- Broward County · 1,963,430 people
- City population
- 109,079
- Metro
- Miami-Fort Lauderdale-Pompano Beach, FL
- Population (ZIP)
- 48,464
- Household income
- $71,318
- Rent vs Own
- Severe rent burden
- 2151.0
Population outlook (Broward County) Hauer SSP2
- Today (2025)
- 2,207,033 people
- By 2030
- 2,360,704 · +7.0%
- By 2040
- 2,661,208 · +20.6%
- By 2050
- 2,946,698 · +33.5%
- By 2075
- 3,602,273 · +63.2%
- By 2100
- 3,970,984 · +79.9%
Race, ethnicity, and origin ACS 2023
- Neighborhood character
- Diverse neighborhood (Simpson 0.65)
- Race & ethnicity
- White 45% Hispanic / Latino 37% Two or more races 17% Black 13% Asian 3%
- Hispanic origin (detail)
- Puerto Rican 5% Cuban 10% Dominican 2%
- Common ancestry
- Romanian 3% Scotch-Irish 2% Hispanic 2%
- Foreign-born
- 35% · Canada, Jamaica, Dominican Republic
- Languages at home
- 53% English-only · Spanish 33% French/Haitian/Cajun 4% Russian/Polish/Slavic 2%
Political lean MEDSL · Broward
- 2024 margin
- D (+17.0) · D 58.0% · R 41.0%
- 2008→2024 swing
- -17.8pp toward R · 2008: 34.7pp · 2024: 17.0pp
- All cycles
- 2024: D+17.0 2020: D+29.8 2016: D+35.0 2012: D+34.9 2008: D+34.7
Not yet ingested
- Civics
- —
Market trends
- HPI YoY
- ▼ -404.28%
- Current HPI
- 429.7129
- Rent YoY
- ▲ 2.41%
- Metro
- Miami-Fort Lauderdale-Pompano Beach, FL
- State GDP YoY
- ▲ 3.28%
- F500 in state
- 36
Industry mix (Fortune 500 HQ in FL)
| Industry | F500 HQs | Revenue |
|---|---|---|
| Industrial Technology | 2 | $29B |
|
||
| Insurance | 2 | $17B |
|
||
| Retail | 1 | $60B |
|
||
| Technology Distribution | 1 | $58B |
|
||
| Homebuilding | 1 | $35B |
|
||
| Technology Manufacturing | 1 | $35B |
|
||
Price history
+276.0% since first listed5 events — show timeline
- 2026-05-11 Price Changed $188,000 Beaches MLS
- 2026-04-14 Listed $192,000 Beaches MLS
- 2005-10-03 Sold (Public Records) $190,000 Public Records
- 1999-12-01 Sold (Public Records) $53,000 Public Records
- 1989-11-08 Sold (Public Records) $50,000 Public Records
Property tax history
+3.2%/yrLatest (2025): $695 · +3.4% YoY. Source: county tax records.
Cash-flow waterfall
monthlySold comps — $/sqft
last 12 mo · ≤1 miLoading sold comps…