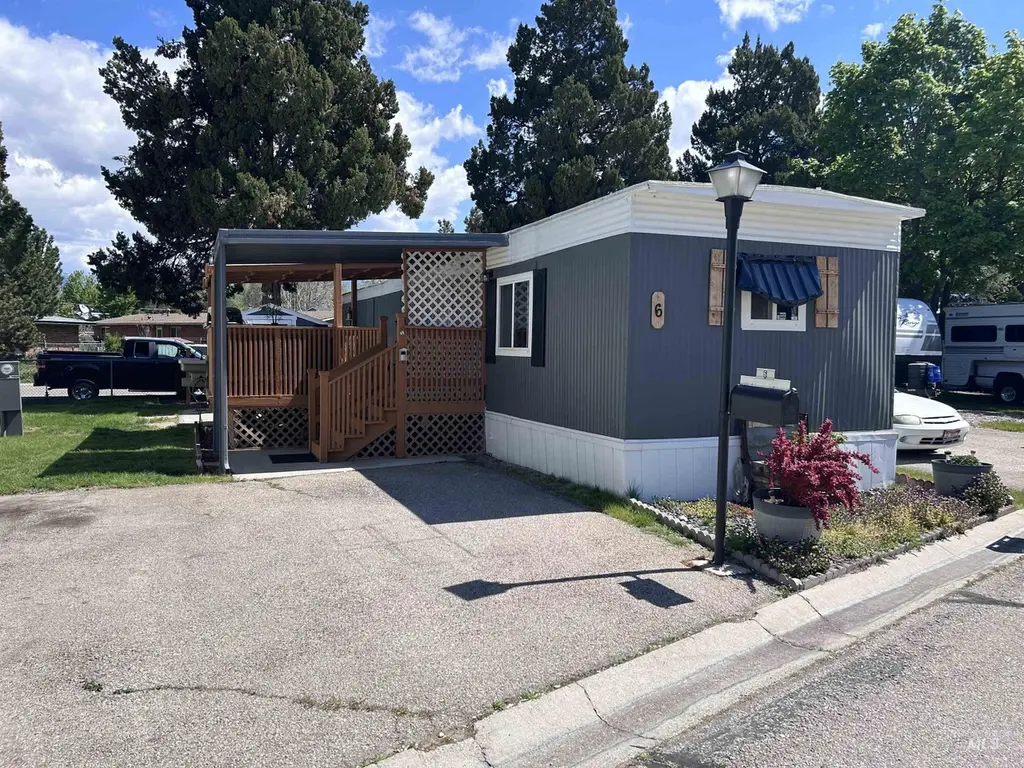
790 N Riviera #6 #6 · Boise City, ID
Flood risk 1/10 · Minimal
- FEMA flood zone
- AE
- Chance of flooding over 30 yrs
- 0.0%
- Est. flood insurance / yr
- $1,737 – $8,500
Fire risk 8/10 · Major
- Est. fire insurance / yr
- $584 – $1,086
Heat risk 4/10 · Minor
- Hot days now (above 96°F)
- 7 days/yr
- Hot days in 30 yrs
- 18 days/yr
Wind risk 1/10 · Minimal
- Chance of severe wind over 30 yrs
- —
Air-quality risk 8/10 · Major
- Unhealthy air days now
- 14 days/yr
- Unhealthy air days in 30 yrs
- 19 days/yr
Risk factors via First Street. Map © Google.
Why this score? — see what drove the B grade
The composite is a weighted blend of 9 inputs, each scored 0–100. Each bar is that input's sub-score; the figure is the points it added to the 100-point composite (weight × sub-score).
- Cash flow +30.0/30.0
- 1% rule +10.0/10.0
- DSCR +10.0/10.0
- ARV discount +7.5/15.0
- Schools +4.2/10.0
- Condition / age +3.8/5.0
- Rent growth +3.0/5.0
- Livability +2.5/5.0
- Appreciation +0.0/10.0
$80,500
🖨 Deal sheet 📄 Offer letter ✓ Due diligence
Listing remarks
Live by the river, ride along the Boise Greenbelt, Party and relax at Veterans Memorial Park. This is a fantastic location! Close to downtown, this updated and recently improved 2 bedroom 1 bath home has the relaxed country feeling. Great covered entry and oversized 10x12 beautiful covered deck area for Summer time BBQ's and relax in the new 4 person jetted hot tub. New paint inside and outside, newer windows, HVAC & central air upgraded in 2023, LVP flooring. Kitchen has tons of cupboard space, upgraded kitchen faucet, stainless gas stove, microwave and new Hisense refrigerator. New Whirlpool washer and dryer in bathroom, new shower surround. master has a Samsung TV mounted on the wa
Key facts
- Jetted hot tub
- Covered deck area
- New paint
Tags
Property features AI
Exterior
- Utilities: City water; Sewer connected
- Home design: Mobile/manufactured home on a rented lot; Built in 1970
- Construction: Metal siding; Other roof type
- Exterior features: Covered patio/deck; Wire fencing; Manual sprinkler system; Located in a mobile home park; Paved road access
Interior
- Kitchen: 12 x 11 kitchen on main level; Microwave; Oven/Range (freestanding); Gas range
- Bedrooms: 2 bedrooms — both on the main level (Primary ~11 x 9; Second ~9 x 9)
- Flooring: Carpet
- Bathrooms: 1 bathroom
- Heating & cooling: Forced-air heating (natural gas); Central air conditioning
- Interior features: Tile counters
- Laundry & utility: Washer; Dryer; Gas water heater
Neighborhood map
What this means for you Summary
Snapshot
- This is a 2-bed/1.0-bath manufactured listed at $80k. Condition is rated good.
Deal economics
- At list price, monthly cash flow is $231 ($3k/yr) — positive.
- The deal already cash-flows at list — no discount required.
- Meets the 1% rule at list price ($2k rent vs $80k).
- Recommended offer: $78k (3.0% below list) — sets the bar for market timing.
- Cap rate 16.1% vs local median 2.6% in Boise City — top-decile yield for the area; either an underpriced asset or a hidden risk that comps aren't pricing in. Stress-test before assuming the spread holds.
Location & tenants
- Location reads: area grade B — affects rentability + tenant quality, not the cash-flow math above.
- Boise Independent District (urban): math 42% / reading 56% proficiency, ranked #36 of 92 in ID (top 39%) — families likely to look elsewhere, expect single-tenant / working-renter base with shorter leases.
- Zoned schools: Lowell Elementary School (math 42% / reading 62%, grade C-, #130 of 357 statewide, top 38%, 295 students, 24% FRL); Boise Senior High School (math 58% / reading 75%, grade B, #9 of 169 statewide, top 5%, 1,588 students, 15% FRL).
- Market conditions: Rents rising (+2.2%/yr); 109 active listings in the ZIP; 23 comparable units currently listed for rent nearby; rentals at typical pace (median 19d on market — plan ~3-4 weeks tenant-placement turnaround); solid renter incomes; 5,129 units permitted in Ada County in 2024 (414 in 5+ unit buildings).
Forward outlook
- Local home prices are declining (-3.0%/yr); year-one equity from $557 of loan paydown is wiped out by about $2k of value loss. Plan a longer hold.
- Ada County population projected at +45% by 2050 — long-run rental-demand tailwind backs the buy-and-hold thesis.
Negotiation context
- It's been on market 48 days — a 3% lower offer ($78k) is reasonable based on typical stale-listing flexibility.
Risks & watch-outs
- Watch-outs: flood insurance adds $427/mo.
- Climate carrying-cost: in FEMA flood zone AE (mandatory federal flood insurance); severe wildfire risk — expect insurance premiums to compound above CPI over the hold.
Questions for the listing agent
- It's been on market 48 days. Have you received any prior offers? Is the seller open to a 3% concession, seller financing, or rate buy-down credit?
- Built in 1970 — when were the roof, HVAC, electrical panel, plumbing, and water heater last replaced?
- What's the actual annual flood-insurance premium (NFIP or private), and is the property in a SFHA with mandatory coverage?
- Is there a deadline driving the sale (1031 exchange, divorce, estate, relocation)? That informs how much negotiation room exists.
- What's the average days-on-market for RENTAL listings here right now (not sales)? A rising rental-DOM trend means longer vacancies and softer asking-rent achievability than the comps imply.
- What's the recent tenant-quality profile in this submarket — average credit score on applications, eviction rate, late-payment / NSF rate, and stable-employment percentage? A property-management company in the area should have these aggregated.
- How much new for-sale + rental construction is in the pipeline within 1–3 miles? Heavy new supply typically softens prices + rents 12–24 months out; constrained supply supports both.
Investment metrics
- 1% rule
- 1.91% ✓
- Cap rate
- 16.09%
- Cash-on-cash
- 34.99%
- DSCR
- 2.56
- GRM
- 4.4
CMA / ARV
- ARV (on-the-fly)
- $41,808
- Comps found
- 2
Show comp detail 2 sales within ~0.75 mi
| Address | Dist | Beds/Ba | Sqft | Sold | Price | $/sf | Match |
|---|---|---|---|---|---|---|---|
| 3929 Reed St #3 | 0.35mi | 2/1.0 | 672 (+8%) | 14mo | $29,000 | $43 | 60 |
| 301 E 40th St #17 | 0.53mi | 2/1.0 | 640 (+3%) | 20mo | $43,000 | $67 | 54 |
Match score weights: distance 35% · size 25% · config 20% · recency 20%. Top-matched comps best support the ARV.
Projected returns pro-forma
-3.0% appreciation · 2.18% rent growth · sell at horizon
- IRR
- 0.8%
- Equity multiple
- 1.03×
- Total profit
- $678
- Equity at exit
- $12,003
- IRR
- 9.4%
- Equity multiple
- 1.69×
- Total profit
- $15,597
- Equity at exit
- $6,960
Cash invested: $22,540 (down + closing). Projections, not guarantees.
Landlord ↔ Tenant lean methodology
- Overall (STATE)
- 91 Strongly Landlord-Friendly
- State Idaho
- 91 Strongly Landlord-Friendly · R+18
- County
- — inherits STATE
- City
- — inherits STATE
ZIP-level market 83703
- Home prices YoY
- -32.9%
- Rents YoY
- 2.2%
- Active inventory
- 109
- Price-to-rent
- 4.4×
Monthly cashflow live
- Estimated rent
- $1,536 high interval (Pro) →
- Mortgage (P&I)
- −$422
- Tax est. 1.5%
- −$101 /mo · $1,208/yr
- Insurance
- −$34
- Flood insurance flood zone
- −$427 /mo · $5,118/yr
- HOA
- −$0
- Vacancy / Maint / Mgmt
- −$323
- Net cashflow
- $231
Break-even live
UW: 25.0% down · 7.5% · 30yr · 1.5% tax · 5.0% vac · 8.0% maint · 8.0% mgmt
Financing live
Cash to close
- Down payment
- $20,125
- Closing costs
- $2,415
- Reserves months
- —
- Total cash needed
- —
Loan-product check · same deal, 3 products live
Conventional
25% down · 7.5% · 30yr
- Down + closing
- —
- Monthly P&I
- —
- Monthly cashflow
- —
- DSCR
- —
- Eligible?
- —
Personal DTI + credit; lowest rate.
DSCR
20% down · 8.5% · 30yr
- Down + closing
- —
- Monthly P&I
- —
- Monthly cashflow
- —
- DSCR
- —
- Eligible?
- —
No personal income docs; deal must DSCR.
Hard money
10% down · 12.0% · 12mo
- Down + closing
- —
- Monthly P&I
- —
- Monthly cashflow
- —
- DSCR
- —
- Eligible?
- —
Short-term bridge; refi at stabilization.
Rent comps 23 comps
| Address | Beds | Baths | Sqft | Rent | $/sqft | DOM | Units | Dist |
|---|---|---|---|---|---|---|---|---|
| 1901 N 32nd St Boise, ID | 2.0 | 1.0 | 616 | $1,245 | $2.02 | 23d | 1 | 0.41mi |
| 521 E 41st St Garden City, ID | 2.0 | 1.0–2.0 | 814 | $5,000 | $6.14 | 23d | 18 | 0.46mi |
| 331 E 40th St Garden City, ID | 2.0 | 2.0 | 678 | $1,875 | $2.77 | 2d | 1 | 0.51mi |
| 385 E 42nd St Garden City, ID | 1.0–2.0 | 1.0–2.0 | 832 | $1,495 | $1.80 | 3d | 1 | 0.63mi |
| 4220 N Adams St Garden City, ID | 2.0 | 1.0–2.0 | 767 | $2,333 | $3.04 | 2d | 7 | 0.67mi |
| 2815 Madison Ave Boise, ID | 1.0 | 1.0 | 423 | $1,240 | $2.93 | 3d | 3 | 0.68mi |
| 820 N 25th St Unit 1324051P Boise, ID | 1.0 | 1.0 | 592 | $2,361 | $3.99 | 2d | 1 | 0.73mi |
| 2407 W State St Unit 6 Boise, ID | 1.0 | 1.0 | 450 | $1,195 | $2.66 | 3d | 1 | 0.77mi |
| 603 N 23rd St Unit 6015 Boise, ID | 1.0 | 1.0 | 500 | $1,100 | $2.20 | 3d | 1 | 0.89mi |
| 2419 W Fairview Ave Boise, ID | 1.0–3.0 | 1.0–2.0 | 826 | $1,363 | $1.65 | 23d | 1 | 1.11mi |
| 1680 N Phillippi St Boise, ID | 1.0 | 1.0 | 450 | $1,145 | $2.54 | 23d | 1 | 1.14mi |
| 4632 N Iota Ln Unit 300 Garden City, ID | 1.0 | 1.0 | 563 | $1,375 | $2.44 | 23d | 1 | 1.16mi |
| 4632 N Iota Ln Unit 200 Garden City, ID | 1.0 | 1.0 | 563 | $1,375 | $2.44 | 18d | 1 | 1.16mi |
| 4633 N Iota Ln Unit 201 Garden City, ID | 1.0 | 1.0 | 563 | $1,375 | $2.44 | 23d | 1 | 1.16mi |
| 1689 Shoreline Dr Boise, ID | 1.0 | 1.0 | 711 | $1,574 | $2.21 | 2d | 1 | 1.23mi |
| 3115 Sycamore Dr Boise, ID | 1.0 | 1.0 | 454 | $1,520 | $3.35 | 23d | 1 | 1.27mi |
| 1705 W Bannock St Boise, ID | 1.0 | 1.0 | 650 | $1,195 | $1.84 | 23d | 1 | 1.27mi |
| 337 N 17th St Unit 315 Boise, ID | 1.0 | 1.0 | 500 | $1,051 | $2.10 | 23d | 1 | 1.28mi |
| 1605 W Hays St Boise, ID | 1.0 | 1.0 | 433 | $995 | $2.30 | 11d | 1 | 1.38mi |
| 1605 W Hays St Boise, ID | 1.0 | 1.0 | 515 | $995 | $1.93 | 23d | 1 | 1.38mi |
| 1603 W Hays St Boise, ID | 1.0 | 1.0 | 433 | $995 | $2.30 | 23d | 1 | 1.39mi |
| 3304 N Lakeharbor Ln Boise, ID | 1.0–3.0 | 1.0–2.0 | 1000 | $1,935 | $1.94 | 2d | 16 | 1.43mi |
| 1401 W Idaho St Boise, ID | 1.0–2.0 | 1.0–2.0 | 710 | $2,000 | $2.81 | 3d | 3 | 1.49mi |
Listing history 16 events
-
2026-06-18days on market $80,500 Active 48 DOM
-
2026-06-17days on market $80,500 Active 47 DOM
-
2026-06-16days on market $80,500 Active 46 DOM
-
2026-06-15days on market $80,500 Active 45 DOM
-
2026-06-13days on market $80,500 Active 43 DOM
-
2026-06-10days on market $80,500 Active 40 DOM
-
2026-06-09days on market $80,500 Active 39 DOM
-
2026-06-08days on market $80,500 Active 38 DOM
-
2026-06-07days on market $80,500 Active 37 DOM
-
2026-06-05days on market $80,500 Active 34 DOM
-
2026-06-03days on market $80,500 Active 33 DOM
-
2026-06-03days on market $80,500 Active 32 DOM
-
2026-06-01days on market $80,500 Active 31 DOM
-
2026-05-31days on market $80,500 Active 30 DOM
-
2026-05-18price $80,500
-
2026-05-01$85,000 Active
ⓘ Source: listings_history table (triggers on properties + properties_extension) + one-shot
backfill from property_details.listing_events for pre-trigger history.
Climate risk First Street
- Flood 1/10 Low FEMA zone AE · 0% chance over 30 yrs
- Wildfire 8/10 Severe
- Heat 4/10 Moderate 7 d/yr ≥96°F today · 18 d/yr by 30 yrs out
- Wind 1/10 Low
- Air quality 8/10 Severe 14 unhealthy d/yr today · 19 by 30 yrs out
Nearby sold comps map
Loading sold comps map…
Walkable amenities ~0.75 mi
Loading nearby amenities…
Taxation est. · year 1
- Rental income
- $18,434
- − Mortgage interest
- −$4,509
- − Property taxes
- −$1,208
- − Insurance
- −$5,521
- − Repairs & maintenance
- −$1,475
- − Management
- −$1,475
- − Depreciation
- −$2,342
- Taxable income
- $1,905
- Est. tax owed @ 24.0%
- −$457
- After-tax cash flow
- $2,311/yr
For passive investors: Depreciation is non-cash, so a rental often shows a tax loss while cash-flowing — sheltering income. Rental losses are passive: they offset passive income freely, and up to $25,000/yr can offset ordinary (W-2) income if you actively participate and your MAGI is under $100k (phasing out to $0 by $150k); unused losses carry forward. On sale, claimed depreciation is recaptured at up to 25%, and gains may owe capital-gains tax (a 1031 exchange can defer both). Figures are a year-1 estimate at your 24.0% rate — not tax advice; consult a CPA.
Condition & rehab AI · 12 photos
This updated and recently improved 2-bedroom 1-bath home is in good condition with a good condition score of 75. It has a good curb appeal and is move-in ready. The home has a good condition rating and is in good condition with a good condition score of 75. It has a good curb appeal and is move-in ready.
Value-add opportunities
- Both Landscaping and curb appeal — Enhances curb appeal and adds value for both resale and rental.
- Resale Interior paint touch-ups — Fresh paint can make a home more appealing to potential buyers.
- Both Replace outdoor furniture — Worn or damaged furniture can detract from the home's appeal and comfort level.
- Both Install new outdoor lighting — New lighting can improve safety and enhance curb appeal.
- Resale Upgrade kitchen appliances — Upgrading to more modern or energy-efficient appliances can increase the home's value.
- Resale Install new shower curtain and fixtures — A new shower curtain and fixtures can make the bathroom more appealing and functional.
- Both Replace old shed door and window — A new shed door and window can improve the home's curb appeal and functionality.
Renovation cost estimate screening
Value-add ROI direction
- Both Landscaping and curb appeal — Enhances curb appeal and adds value for both resale and rental. ↑
- Resale Interior paint touch-ups — Fresh paint can make a home more appealing to potential buyers. ↑
- Both Replace outdoor furniture — Worn or damaged furniture can detract from the home's appeal and comfort level. ↑
- Both Install new outdoor lighting — New lighting can improve safety and enhance curb appeal. ↑
- Resale Upgrade kitchen appliances — Upgrading to more modern or energy-efficient appliances can increase the home's value. ↑
- Resale Install new shower curtain and fixtures — A new shower curtain and fixtures can make the bathroom more appealing and functional. ↑
- Both Replace old shed door and window — A new shed door and window can improve the home's curb appeal and functionality. ↑
ⓘ Cost ranges are severity-bucket heuristics (US national rule-of-thumb). Get contractor quotes + a written scope before underwriting a rehab budget.
Schools (NCES district)
- District
- Boise Independent District
- NCES district ID
- 1600360
- Math proficiency
- 42% ▼ -5.00%
- Reading proficiency
- 56% ▼ -1.00%
- Median HH income
- $49,135
- Composite
- 41.82/100
- National rank
- #3388
- State rank
- #36 of 92 in ID
Livability — Boise City
No livability data for this city. (Only ~50 U.S. cities are tracked.)
Census & demographics
- Census place
- Boise City, ID
- County
- Ada County · 522,161 people
- City population
- 152,689
- Metro
- Boise City, ID
- Population (ZIP)
- 17,583
- Household income
- $76,910
- Rent vs Own
- Severe rent burden
- 743.0
Population outlook (Ada County) Hauer SSP2
- Today (2025)
- 535,818 people
- By 2030
- 585,751 · +9.3%
- By 2040
- 682,435 · +27.4%
- By 2050
- 775,818 · +44.8%
- By 2075
- 994,458 · +85.6%
- By 2100
- 1,148,884 · +114.4%
Race, ethnicity, and origin ACS 2023
- Neighborhood character
- Predominantly White (89%)
- Race & ethnicity
- White 89% Two or more races 5% Hispanic / Latino 4% Asian 2%
- Common ancestry
- Slovak 6% Italian 5% Portuguese 3%
- Foreign-born
- 4% · Canada, South Korea, Philippines
- Languages at home
- 95% English-only · Spanish 2% Other Asian/Pacific 1% Other Indo-European 1%
Political lean MEDSL · Ada
- 2024 margin
- R (+10.3) · D 43.4% · R 53.8% · Other 2.8%
- 2008→2024 swing
- -4.2pp toward R · 2008: -6.2pp · 2024: -10.3pp
- All cycles
- 2024: R+10.3 2020: R+3.9 2016: R+9.2 2012: R+11.3 2008: R+6.2
Not yet ingested
- Civics
- —
Market trends
- HPI YoY
- ▼ -191.16%
- Current HPI
- 390.3581
- Rent YoY
- ▲ 2.18%
- Metro
- Boise City, ID
- State GDP YoY
- ▲ 4.51%
- F500 in state
- 6
Industry mix (Fortune 500 HQ in ID)
| Industry | F500 HQs | Revenue |
|---|---|---|
| Retail | 1 | $79B |
|
||
| Technology | 1 | $25B |
|
||
| Food / Agriculture | 1 | $6B |
|
||
Price history
-5.3% since first listed2 events — show timeline
- 2026-05-18 Price Changed $80,500 IMLS
- 2026-05-01 Listed $85,000 IMLS
Cash-flow waterfall
monthlySold comps — $/sqft
last 12 mo · ≤1 miLoading sold comps…