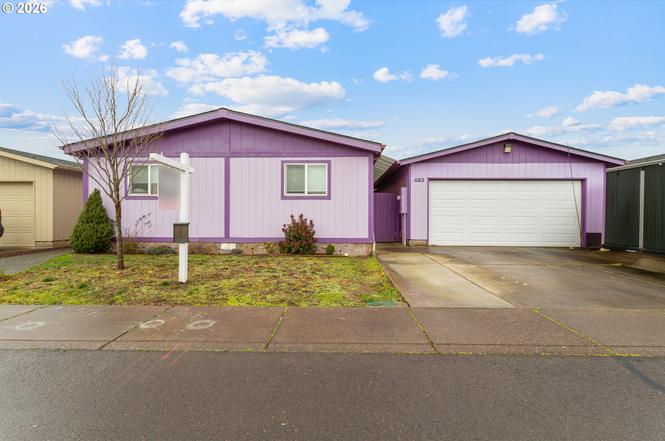
483 Rye St · Woodburn, OR
Flood risk 1/10 · Minimal
- FEMA flood zone
- X (unshaded)
- Chance of flooding over 30 yrs
- 0.0%
- Est. flood insurance / yr
- $507 – $1,088
Fire risk 1/10 · Minimal
- Est. fire insurance / yr
- $498 – $926
Heat risk 3/10 · Minor
- Hot days now (above 92°F)
- 7 days/yr
- Hot days in 30 yrs
- 14 days/yr
Wind risk 1/10 · Minimal
- Chance of severe wind over 30 yrs
- —
Air-quality risk 10/10 · Severe
- Unhealthy air days now
- 14 days/yr
- Unhealthy air days in 30 yrs
- 14 days/yr
Risk factors via First Street. Map © Google.
Why this score? — see what drove the B- grade
The composite is a weighted blend of 9 inputs, each scored 0–100. Each bar is that input's sub-score; the figure is the points it added to the 100-point composite (weight × sub-score).
- Cash flow +27.0/30.0
- ARV discount +13.6/15.0
- DSCR +9.3/10.0
- 1% rule +7.3/10.0
- Livability +3.7/5.0
- Rent growth +3.2/5.0
- Schools +2.5/10.0
- Condition / age +2.5/5.0
- Appreciation +0.0/10.0
$199,900
🖨 Deal sheet (PDF) 📄 Offer letter ✓ Due diligence
Listing remarks
1997 Doublewide manufactured home in park features 1512SF, 3 bedrooms + den, laundry room, owner suite w/ full bath and office/nursery area, tile and laminate floors throughout, large kitchen updated with newer cabinets, SS appliances. Bathroom 2 has been updated. Roof is 1-2 years old. Electric furnace and heat pump for efficient heating and cooling. Fenced yard, tool/storage shed, 2 car garage w/ room for storage. Park approval required to purchase. Parr Acres is an all ages park. Space rent $553/mo.
Key facts
- Updated cabinets
- Fenced yard
- Large kitchen
Tags
Property features AI
Finance
- Other: Unit dimensions: 56 ft by 14 ft; Main level area approximately 1,512
- HOA & community: Park name: Parr Acres; Land lease (monthly lot rent of $553) — lease expires December 31, 2026; Pet restrictions: yes (number and type restricted)
Exterior
- Parking: Driveway and on-street parking; Detached oversized 2-car garage
- Utilities: Electricity (fuel); Public water; Public sewer
- Home design: Manufactured home in a park (residential); One-level entry; Guerdon manufacturer; Built in 1997
- Construction: Composition roof; Foundation: block, other, with skirting
- Exterior features: Fenced yard; Tool shed; T-111 siding; Paved road access; Level lot; Territorial view
Interior
- Kitchen: Dishwasher; Free-standing range; Microwave; Pantry; Stainless steel appliances; Updated/remodeled kitchen; Tile floor; Vaulted ceiling
- Bedrooms: Primary bedroom on main level with ensuite, dressing room, ceiling fan, laminate and tile flooring; Second bedroom on main level with ceiling fan, closet, laminate flooring; Third bedroom on main level with ceiling fan, closet, laminate flooring; Den (main level)
- Flooring: Laminate flooring; Tile flooring
- Bathrooms: Two full bathrooms (both on the main level)
- Heating & cooling: Forced air heating; Heat pump for heating and cooling
- Interior features: Garage door opener; Laminate flooring; Tile flooring; Vaulted ceilings; Laundry area; Double pane windows with vinyl frames; Main-floor bedroom with bath (accessible); One-level living; Crawl space basement
- Laundry & utility: Main-level laundry with exterior entry; Hot water: electric tank
Neighborhood map
What this means for you Summary
Snapshot
- This is a 3-bed/2.0-bath manufactured listed at $200k.
Deal economics
- At list price, monthly cash flow is $560 ($7k/yr) — positive.
- The deal already cash-flows at list — no discount required.
- Meets the 1% rule at list price ($2k rent vs $200k).
- Recommended offer: $188k (6.0% below list) — sets the bar for market timing.
- Cap rate 9.7% vs local median 3.1% in Woodburn — top-decile yield for the area; either an underpriced asset or a hidden risk that comps aren't pricing in. Stress-test before assuming the spread holds.
Location & tenants
- Location reads 74/100 on livability (#91 in OR, #4,490 nationally) — a middle-class / working-renter tenant base. Strengths: housing A+, health & safety A+, cost of living B; Watch: crime D+, commute D, amenities F.
- Woodburn SD 103 (town): math 20% / reading 31% proficiency, ranked #169 of 183 in OR (top 92%) — low school quality limits family demand, transient renter base, plan for 1-2y turnover; 71% free/reduced lunch — lower-income household profile, screen leases tightly.
- Zoned schools: Heritage Elementary (618 students, 72% FRL); Valor Middle School (630 students, 72% FRL); Woodburn Success (79 students, 68% FRL) — zoned schools at 71% FRL track the district average.
- Market conditions: Rents rising (+2.9%/yr); 306 active listings in the ZIP; 7 comparable units currently listed for rent nearby; rentals at typical pace (median 24d on market — plan ~3-4 weeks tenant-placement turnaround); 43% of comp listings sitting > 30 days — soft ceiling on asking rent; 1,591 units permitted in Marion County in 2024 (716 in 5+ unit buildings).
- This rent runs 42% of the median local income ($71k/yr) — at the standard rent-burdened threshold; future hikes will face affordability resistance.
Forward outlook
- Local home prices are declining (-3.0%/yr); year-one equity from $1k of loan paydown is wiped out by about $6k of value loss. Plan a longer hold.
- Marion County population projected at +17% by 2050 — long-run rental-demand tailwind backs the buy-and-hold thesis.
- At projected returns (-3.0% appreciation + 2.9% rent growth), your $56k cash investment doubles in ~10 years — after that, you're playing with house money.
Negotiation context
- It's been on market 67 days — a 6% lower offer ($188k) is reasonable based on typical stale-listing flexibility.
- 2 sale attempts; this cycle's ask has dropped $12k (6%) from the opening price — seller is motivated, your offer sets the floor, not the list.
Questions for the listing agent
- It's been on market 67 days. Have you received any prior offers? Is the seller open to a 6% concession, seller financing, or rate buy-down credit?
- Why hasn't it sold? Are there any deal-killer items the seller is aware of (foundation, flood, title, zoning, code violations)?
- Is there a deadline driving the sale (1031 exchange, divorce, estate, relocation)? That informs how much negotiation room exists.
- Schools are D-rated, which usually means shorter tenancies and higher turnover. Who's the typical renter profile here, and what's been the actual vacancy rate?
- Crime grade is D in this area — have there been break-ins, vandalism, or insurance claims at this property in the last 3 years? What carrier currently insures it and at what premium?
- What's the average days-on-market for RENTAL listings here right now (not sales)? A rising rental-DOM trend means longer vacancies and softer asking-rent achievability than the comps imply.
- What's the recent tenant-quality profile in this submarket — average credit score on applications, eviction rate, late-payment / NSF rate, and stable-employment percentage? A property-management company in the area should have these aggregated.
- How much new for-sale + rental construction is in the pipeline within 1–3 miles? Heavy new supply typically softens prices + rents 12–24 months out; constrained supply supports both.
Investment metrics
- 1% rule
- 1.23% ✓
- Cap rate
- 9.66%
- Cash-on-cash
- 12.01%
- DSCR
- 1.53
- GRM
- 6.8
CMA / ARV
- ARV (on-the-fly)
- $231,336
- Comps found
- 4
Show comp detail 4 sales within ~0.75 mi
| Address | Dist | Beds/Ba | Sqft | Sold | Price | $/sf | Match |
|---|---|---|---|---|---|---|---|
| 597 Barley St | 0.09mi | 3/2.0 | 1,296 (-14%) | 5mo | $198,000 | $153 | 68 |
| 597 Barley St #28 | 0.09mi | 3/2.0 | 1,296 (-14%) | 5mo | $198,000 | $153 | 68 |
| 436 Oats St #104 | 0.11mi | 2/2.0 (-1) | 1,296 (-14%) | 19mo | $249,900 | $193 | 50 |
| 612 N Cascade Dr #22 | 0.62mi | 3/2.0 | 1,296 (-14%) | 22mo | $82,500 | $64 | 29 |
Match score weights: distance 35% · size 25% · config 20% · recency 20%. Top-matched comps best support the ARV.
Projected returns pro-forma
-3.0% appreciation · 2.94% rent growth · sell at horizon
- IRR
- 1.5%
- Equity multiple
- 1.06×
- Total profit
- $3,179
- Equity at exit
- $29,806
- IRR
- 11.1%
- Equity multiple
- 1.86×
- Total profit
- $48,259
- Equity at exit
- $17,284
Cash invested: $55,972 (down + closing). Projections, not guarantees.
Landlord ↔ Tenant lean methodology
- Overall (STATE)
- 28 Tenant-Leaning
- State Oregon
- 28 Tenant-Leaning · D+6
- County
- — inherits STATE
- City
- — inherits STATE
ZIP-level market 97071
- Rents YoY
- 2.9%
- Active inventory
- 306
- Price-to-rent
- 6.8×
Monthly cashflow live
- Estimated rent
- $2,458 high interval (Pro) →
- Mortgage (P&I)
- −$1,048
- Tax est. 1.5%
- −$250 /mo · $2,998/yr
- Insurance
- −$83
- HOA
- −$0
- Vacancy / Maint / Mgmt
- −$516
- Net cashflow
- $560
Break-even live
Sensitivity live
| Price | -10% $698 | -5% $629 | +0% $560 | +5% $491 | +10% $422 |
|---|---|---|---|---|---|
| Rent | -10% $366 | -5% $463 | +0% $560 | +5% $657 | +10% $754 |
| Rate | -1.0pp $661 | -0.5pp $611 | base $560 | +0.5pp $508 | +1.0pp $456 |
UW: 25.0% down · 7.5% · 30yr · 1.5% tax · 5.0% vac · 8.0% maint · 8.0% mgmt
Financing live
Cash to close
- Down payment
- $49,975
- Closing costs
- $5,997
- Reserves months
- —
- Total cash needed
- —
Loan-product check · same deal, 3 products live
Conventional
25% down · 7.5% · 30yr
- Down + closing
- —
- Monthly P&I
- —
- Monthly cashflow
- —
- DSCR
- —
- Eligible?
- —
Personal DTI + credit; lowest rate.
DSCR
20% down · 8.5% · 30yr
- Down + closing
- —
- Monthly P&I
- —
- Monthly cashflow
- —
- DSCR
- —
- Eligible?
- —
No personal income docs; deal must DSCR.
Hard money
10% down · 12.0% · 12mo
- Down + closing
- —
- Monthly P&I
- —
- Monthly cashflow
- —
- DSCR
- —
- Eligible?
- —
Short-term bridge; refi at stabilization.
Rent comps 7 comps
| Address | Beds | Baths | Sqft | Rent | $/sqft | DOM | Units | Dist |
|---|---|---|---|---|---|---|---|---|
| 2269 Livesay Ln Woodburn, OR | 3.0 | 2.5 | 1622 | $2,495 | $1.54 | 24d | 1 | 0.24mi |
| 862 Sifuentez Ct Woodburn, OR | 3.0 | 2.5 | 1400 | $2,495 | $1.78 | 21d | 1 | 0.26mi |
| 610 Pickering Ln Woodburn, OR | 4.0 | 2.5 | 1829 | $2,595 | $1.42 | 44d | 1 | 0.38mi |
| 555 Stoller St Woodburn, OR | 4.0 | 2.5 | 1837 | $2,695 | $1.47 | 14d | 1 | 0.43mi |
| 555 Stoller St Woodburn, OR | 4.0 | 2.5 | 1837 | $2,750 | $1.50 | 44d | 1 | 0.43mi |
| 1400 Dahlia St Woodburn, OR | 3.0 | 2.0 | 1329 | $2,395 | $1.80 | 44d | 1 | 0.58mi |
| 398 Stacy Allison Way Woodburn, OR | 1.0–3.0 | 1.0–2.0 | 1008 | $2,604 | $2.58 | 3d | 108 | 0.91mi |
Listing history 8 events
-
2026-06-01status $199,900 Pending 67 DOM
-
2026-05-31days on market $199,900 Active 67 DOM
-
2026-05-30days on market $199,900 Active 66 DOM
-
2026-05-21status Active
-
2026-04-03status Pending
-
2026-03-20price $199,900
-
2026-03-13price $209,900
-
2026-02-05$212,000 Active
ⓘ Source: listings_history table (triggers on properties + properties_extension) + one-shot
backfill from property_details.listing_events for pre-trigger history.
Climate risk First Street
- Flood 1/10 Low FEMA zone X (unshaded) · 0% chance over 30 yrs
- Wildfire 1/10 Low
- Heat 3/10 Moderate 7 d/yr ≥92°F today · 14 d/yr by 30 yrs out
- Wind 1/10 Low
- Air quality 10/10 Extreme 14 unhealthy d/yr today · 14 by 30 yrs out
Nearby sold comps map
Loading sold comps map…
Walkable amenities ~0.75 mi
Loading nearby amenities…
Taxation est. · year 1
- Rental income
- $29,494
- − Mortgage interest
- −$11,198
- − Property taxes
- −$2,998
- − Insurance
- −$1,000
- − Repairs & maintenance
- −$2,360
- − Management
- −$2,360
- − Depreciation
- −$5,815
- Taxable income
- $3,765
- Est. tax owed @ 24.0%
- −$903
- After-tax cash flow
- $5,820/yr
For passive investors: Depreciation is non-cash, so a rental often shows a tax loss while cash-flowing — sheltering income. Rental losses are passive: they offset passive income freely, and up to $25,000/yr can offset ordinary (W-2) income if you actively participate and your MAGI is under $100k (phasing out to $0 by $150k); unused losses carry forward. On sale, claimed depreciation is recaptured at up to 25%, and gains may owe capital-gains tax (a 1031 exchange can defer both). Figures are a year-1 estimate at your 24.0% rate — not tax advice; consult a CPA.
Schools (NCES district)
- District
- Woodburn SD 103
- NCES district ID
- 4113530
- Math proficiency
- 20% ▬ 0.00%
- Reading proficiency
- 31% ▼ -1.00%
- Median HH income
- $44,033
- Composite
- 24.9/100
- National rank
- #12993
- State rank
- #169 of 183 in OR
Livability — Woodburn
- Score
- 74/100
- State rank
- #91
- US rank
- #4490
Category grades
Schools grade is shown separately in the Schools card above.
Census & demographics
- Census place
- Woodburn, OR
- County
- Marion County · 258,219 people
- City population
- 33,123
- Metro
- Salem, OR
- Population (ZIP)
- 33,123
- Household income
- $70,938
- Rent vs Own
- Severe rent burden
- 1039.0
Population outlook (Marion County) Hauer SSP2
- Today (2025)
- 360,940 people
- By 2030
- 375,178 · +3.9%
- By 2040
- 400,914 · +11.1%
- By 2050
- 422,187 · +17.0%
- By 2075
- 460,305 · +27.5%
- By 2100
- 464,025 · +28.6%
Race, ethnicity, and origin ACS 2023
- Neighborhood character
- Majority Hispanic (61%)
- Race & ethnicity
- Hispanic / Latino 61% White 34% Two or more races 22% Native American 2% Asian 1%
- Hispanic origin (detail)
- Mexican 51%
- Common ancestry
- Scotch-Irish 2% Lithuanian 2% Romanian 2%
- Foreign-born
- 30% · Canada, China
- Languages at home
- 43% English-only · Spanish 53% Russian/Polish/Slavic 2%
Political lean MEDSL · Marion
- 2024 margin
- Toss-up / Even · D 47.5% · R 49.5% · Other 3.0%
- 2008→2024 swing
- -4.2pp toward R · 2008: 2.2pp · 2024: -2.0pp
- All cycles
- 2024: R+2.0 2020: D+1.1 2016: R+5.0 2012: R+3.5 2008: D+2.2
Not yet ingested
- Civics
- —
Market trends
- HPI YoY
- ▼ -353.43%
- Current HPI
- 297.3113
- Rent YoY
- ▲ 2.94%
- Metro
- Salem, OR
- State GDP YoY
- ▲ 2.05%
- F500 in state
- 2
Industry mix (Fortune 500 HQ in OR)
| Industry | F500 HQs | Revenue |
|---|---|---|
| Consumer Goods | 1 | $51B |
|
||
Price history
-5.7% since first listed5 events — show timeline
- 2026-05-21 Relisted — RMLS
- 2026-04-03 Pending — RMLS
- 2026-03-20 Price Changed $199,900 RMLS
- 2026-03-13 Price Changed $209,900 RMLS
- 2026-02-05 Listed $212,000 RMLS
Cash-flow waterfall
monthlySold comps — $/sqft
last 12 mo · ≤1 miLoading sold comps…