2405 Greenbelt Rd · Celina, TX
Flood risk No data
- FEMA flood zone
- —
- Chance of flooding over 30 yrs
- —
- Est. flood insurance / yr
- —
Fire risk No data
- Est. fire insurance / yr
- —
Heat risk No data
- Hot days now (above threshold)
- —
- Hot days in 30 yrs
- —
Wind risk No data
- Chance of severe wind over 30 yrs
- —
Air-quality risk No data
- Unhealthy air days now
- —
- Unhealthy air days in 30 yrs
- —
Risk factors via First Street. Map © Google.
Why this score? — see what drove the D- grade
The composite is a weighted blend of 9 inputs, each scored 0–100. Each bar is that input's sub-score; the figure is the points it added to the 100-point composite (weight × sub-score).
- Cash flow +12.6/30.0
- ARV discount +6.2/15.0
- Schools +5.0/10.0
- 1% rule +4.0/10.0
- DSCR +3.7/10.0
- Livability +3.4/5.0
- Rent growth +1.3/5.0
- Condition / age +1.0/5.0
- Appreciation +0.0/10.0
$316,999
🖨 Deal sheet (PDF) 📄 Offer letter ✓ Due diligence
Listing remarks
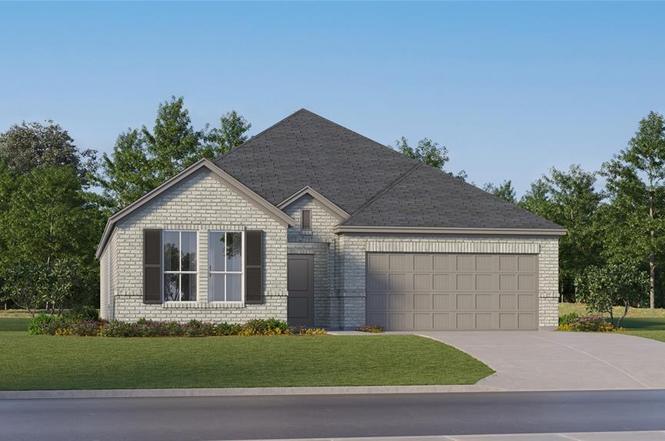
LENNAR - Legacy Hills - Nash Floorplan This single-story home shares an open layout between the kitchen, nook and family room for easy entertaining, along with access to the covered patio for year-round outdoor lounging. A luxe owner's suite is in a rear of the home and comes complete with an en-suite bathroom and walk-in closet, while two secondary bedrooms are near the front of the home, ideal for household members and overnight guests.
Key facts
- Walk-in closet
- Open layout
- Covered patio
Tags
Neighborhood map
What this means for you Summary
Snapshot
- This is a 3-bed/2.0-bath single-family listed at $317k. Condition is rated poor.
Deal economics
- At list price, monthly cash flow is $-42 ($-501/yr) — negative.
- To cash-flow at today's rent, offer at most $311k (1.9% below list).
- To meet the 1% rule (rent ≥ 1% of price), the offer needs to be $285k (10.0% below list).
- Recommended offer: $285k (10.0% below list) — sets the bar for 1% rule.
- Cap rate 6.1% vs local median 2.8% in Celina — top-decile yield for the area; either an underpriced asset or a hidden risk that comps aren't pricing in. Stress-test before assuming the spread holds.
Location & tenants
- Location reads 68/100 on livability (#450 in TX) — a middle-class / working-renter tenant base. Strengths: employment A+, housing A+, crime A; Watch: cost of living C-, amenities F, commute F.
- Celina ISD (rural): math 50% / reading 61% proficiency, ranked #71 of 826 in TX (top 9%) — acceptable for families but not a draw, mixed tenant base, ~2y average lease.
- Zoned schools: Marcy B Lykins El (math 38% / reading 50%, grade F, #1,243 of 4,322 statewide, top 29%, 708 students, 22% FRL); Jerry & Linda Moore Middle (math 56% / reading 60%, grade B, #197 of 1,662 statewide, top 12%, 903 students, 20% FRL); Celina H S (math 44% / reading 72%, grade C, #320 of 1,632 statewide, top 20%, 1,074 students, 18% FRL).
- Market conditions: Rents falling (-4.6%/yr); 2927 active listings in the ZIP; 6 comparable units currently listed for rent nearby; rentals lingering (median 46d on market — plan ~5-8 weeks vacancy on turnover, expect pricing pressure); 50% of comp listings sitting > 30 days — soft ceiling on asking rent; high-income renter base; 19,194 units permitted in Collin County in 2024 (3,988 in 5+ unit buildings).
Forward outlook
- Local home prices are declining (-3.0%/yr); year-one equity from $2k of loan paydown is wiped out by about $10k of value loss. Plan a longer hold.
- Collin County population projected at +60% by 2050 — long-run rental-demand tailwind backs the buy-and-hold thesis.
Negotiation context
- It's been on market 23 days — a 2% lower offer ($312k) is reasonable based on typical stale-listing flexibility.
Questions for the listing agent
- What do current leases actually rent for vs. the listed asking? Can we see a recent rent roll and the last 12 months of T-12 income?
- Have any recent inspections been done? Can we get a copy of the seller's disclosures and any deferred-maintenance estimates?
- What does the HOA fee cover, when was the last increase, and are there any pending special assessments or reserve-fund shortfalls?
- Is there a deadline driving the sale (1031 exchange, divorce, estate, relocation)? That informs how much negotiation room exists.
- Schools are A-rated — typically a magnet for longer-tenancy family renters. What's the average tenant stay here, and is there a school-zone premium baked into asking?
- The area grade is low — what's the realistic commute time and amenity access for the typical tenant pool here? Any planned neighborhood developments (good or bad) we should know about?
- What's the average days-on-market for RENTAL listings here right now (not sales)? A rising rental-DOM trend means longer vacancies and softer asking-rent achievability than the comps imply.
- What's the recent tenant-quality profile in this submarket — average credit score on applications, eviction rate, late-payment / NSF rate, and stable-employment percentage? A property-management company in the area should have these aggregated.
- How much new for-sale + rental construction is in the pipeline within 1–3 miles? Heavy new supply typically softens prices + rents 12–24 months out; constrained supply supports both.
Investment metrics
- 1% rule
- 0.90% ✗
- Cap rate
- 6.13%
- Cash-on-cash
- -0.56%
- DSCR
- 0.97
- GRM
- 9.3
CMA / ARV
- ARV (on-the-fly)
- $307,918
- Comps found
- 12
Show comp detail 12 sales within ~0.75 mi
| Address | Dist | Beds/Ba | Sqft | Sold | Price | $/sf | Match |
|---|---|---|---|---|---|---|---|
| 2405 Greenbelt Rd | 0.00mi | 3/2.0 | 1,822 (0%) | 0mo | $316,999 | $174 | 100 |
| 2409 Greenbelt Rd | 0.01mi | 4/2.0 (+1) | 1,924 (+6%) | 2mo | $324,999 | $169 | 84 |
| 2509 Greenbelt Rd | 0.05mi | 4/2.0 (+1) | 1,924 (+6%) | 3mo | $325,999 | $169 | 81 |
| 2401 Greenbelt Rd | 0.01mi | 4/2.0 (+1) | 2,083 (+14%) | 1mo | $352,999 | $169 | 70 |
| 2417 Lost Creek Ln | 0.06mi | 4/2.0 (+1) | 2,083 (+14%) | 2mo | $329,399 | $158 | 67 |
| 2508 Lost Creek Way | 0.06mi | 4/2.0 (+1) | 2,083 (+14%) | 3mo | $326,399 | $157 | 66 |
| 3100 Arthurdale St | 0.61mi | 3/2.0 | 1,782 (-2%) | 3mo | $330,990 | $186 | 66 |
| 1413 Buchanan Way | 0.42mi | 4/2.0 (+1) | 1,924 (+6%) | 1mo | $336,999 | $175 | 66 |
| 2605 Lost Creek Way | 0.10mi | 4/2.0 (+1) | 2,083 (+14%) | 2mo | $335,224 | $161 | 64 |
| 2601 Lost Creek Ln | 0.09mi | 4/2.0 (+1) | 2,083 (+14%) | 3mo | $327,824 | $157 | 64 |
| 2020 Beeflower St | 0.68mi | 3/2.0 | 2,032 (+12%) | 2mo | $359,990 | $177 | 47 |
| 1439 Florence Ln | 0.71mi | 3/2.0 | 2,041 (+12%) | 3mo | $449,970 | $220 | 45 |
Match score weights: distance 35% · size 25% · config 20% · recency 20%. Top-matched comps best support the ARV.
Projected returns pro-forma
-3.0% appreciation · 0.0% rent growth · sell at horizon
- IRR
- -20.8%
- Equity multiple
- 0.30×
- Total profit
- $-62,279
- Equity at exit
- $47,266
- IRR
- -23.5%
- Equity multiple
- -0.01×
- Total profit
- $-89,529
- Equity at exit
- $27,408
Cash invested: $88,760 (down + closing). Projections, not guarantees.
Landlord ↔ Tenant lean methodology
- Overall (STATE)
- 87 Strongly Landlord-Friendly
- State Texas
- 87 Strongly Landlord-Friendly · R+5
- County
- — inherits STATE
- City
- — inherits STATE
ZIP-level market 75009
- Home prices YoY
- -23.1%
- Rents YoY
- -4.6%
- Active inventory
- 2927
- Price-to-rent
- 9.3×
Monthly cashflow live
- Estimated rent
- $2,853 high interval (Pro) →
- Mortgage (P&I)
- −$1,662
- Tax est. 1.5%
- −$396 /mo · $4,755/yr
- Insurance
- −$132
- HOA
- −$105
- Vacancy / Maint / Mgmt
- −$599
- Net cashflow
- $-42
Break-even live
Sensitivity live
| Price | -10% $177 | -5% $68 | +0% $-42 | +5% $-151 | +10% $-261 |
|---|---|---|---|---|---|
| Rent | -10% $-267 | -5% $-154 | +0% $-42 | +5% $71 | +10% $184 |
| Rate | -1.0pp $118 | -0.5pp $39 | base $-42 | +0.5pp $-124 | +1.0pp $-207 |
UW: 25.0% down · 7.5% · 30yr · 1.5% tax · 5.0% vac · 8.0% maint · 8.0% mgmt
Financing live
Cash to close
- Down payment
- $79,250
- Closing costs
- $9,510
- Reserves months
- —
- Total cash needed
- —
Loan-product check · same deal, 3 products live
Conventional
25% down · 7.5% · 30yr
- Down + closing
- —
- Monthly P&I
- —
- Monthly cashflow
- —
- DSCR
- —
- Eligible?
- —
Personal DTI + credit; lowest rate.
DSCR
20% down · 8.5% · 30yr
- Down + closing
- —
- Monthly P&I
- —
- Monthly cashflow
- —
- DSCR
- —
- Eligible?
- —
No personal income docs; deal must DSCR.
Hard money
10% down · 12.0% · 12mo
- Down + closing
- —
- Monthly P&I
- —
- Monthly cashflow
- —
- DSCR
- —
- Eligible?
- —
Short-term bridge; refi at stabilization.
Rent comps 6 comps
| Address | Beds | Baths | Sqft | Rent | $/sqft | DOM | Units | Dist |
|---|---|---|---|---|---|---|---|---|
| 2212 W J Fred Smith Pkwy Celina, TX | 3.0 | 2.0 | 1594 | $3,500 | $2.20 | 0d | 1 | 0.46mi |
| 3100 Arthurdale St Celina, TX | 4.0 | 2.0 | 2184 | $2,399 | $1.10 | 45d | 1 | 0.61mi |
| 2417 Blackwell St Celina, TX | 4.0 | 2.5 | 2098 | $3,300 | $1.57 | 0d | 1 | 0.66mi |
| 2020 Beeflower St Celina, TX | 3.0 | 2.0 | 2032 | $2,399 | $1.18 | 45d | 1 | 0.69mi |
| 7592 Rawhide Rd Celina, TX | 2.0 | 2.0 | 2360 | $4,950 | $2.10 | 45d | 1 | 1.01mi |
| 1712 Goodnight Trl Celina, TX | 3.0 | 2.5 | 2231 | $2,450 | $1.10 | 0d | 1 | 1.10mi |
HOA detail
- Monthly dues
- $105 · $1,260/yr
Listing history 5 events
-
2026-03-09status Pending
-
2026-03-07price $316,999
-
2026-03-04price $318,999
-
2026-02-25price $325,999
-
2026-02-14$329,999 Active
ⓘ Source: listings_history table (triggers on properties + properties_extension) + one-shot
backfill from property_details.listing_events for pre-trigger history.
Nearby sold comps map
Loading sold comps map…
Walkable amenities ~0.75 mi
Loading nearby amenities…
Taxation est. · year 1
- Rental income
- $34,238
- − Mortgage interest
- −$17,757
- − Property taxes
- −$4,755
- − Insurance
- −$1,585
- − Repairs & maintenance
- −$2,739
- − Management
- −$2,739
- − HOA
- −$1,260
- − Depreciation
- −$9,222
- Taxable loss
- −$5,819
- Est. tax savings @ 24.0%
- +$1,397
- After-tax cash flow
- $896/yr
For passive investors: Depreciation is non-cash, so a rental often shows a tax loss while cash-flowing — sheltering income. Rental losses are passive: they offset passive income freely, and up to $25,000/yr can offset ordinary (W-2) income if you actively participate and your MAGI is under $100k (phasing out to $0 by $150k); unused losses carry forward. On sale, claimed depreciation is recaptured at up to 25%, and gains may owe capital-gains tax (a 1031 exchange can defer both). Figures are a year-1 estimate at your 24.0% rate — not tax advice; consult a CPA.
Condition & rehab AI · 1 photo
This home requires extensive repairs and updates, including major work on the exterior and interior walls, flooring, and HVAC. Significant improvements in these areas would substantially increase its resale and rental value.
Repairs flagged
- Major exterior walls — Significant discoloration and potential water damage.
- Major interior walls — Severe discoloration and potential water damage.
- Major flooring — Visible wear and tear requiring replacement or repair.
Value-add opportunities
- Both exterior painting — Improves curb appeal and overall appearance.
- Both HVAC replacement — Enhances comfort and energy efficiency, attracting more tenants or buyers.
- Both interior painting — Restores a fresh look and improves the home's overall condition.
- Both flooring replacement — Enhances the home's aesthetic and functionality, making it more attractive to buyers or renters.
Renovation cost estimate screening
| Repair item | Severity | Est. cost |
|---|---|---|
| exterior walls · Significant discoloration and potential water damage. | Major | $15,000–50,000 |
| interior walls · Severe discoloration and potential water damage. | Major | $15,000–50,000 |
| flooring · Visible wear and tear requiring replacement or repair. | Major | $15,000–50,000 |
| Total estimated repair cost · 3 items | $45,000–150,000 |
Value-add ROI direction
- Both exterior painting — Improves curb appeal and overall appearance. ↑
- Both HVAC replacement — Enhances comfort and energy efficiency, attracting more tenants or buyers. ↑
- Both interior painting — Restores a fresh look and improves the home's overall condition. ↑
- Both flooring replacement — Enhances the home's aesthetic and functionality, making it more attractive to buyers or renters. ↑
ⓘ Cost ranges are severity-bucket heuristics (US national rule-of-thumb). Get contractor quotes + a written scope before underwriting a rehab budget.
Schools (NCES district)
- District
- Celina ISD
- NCES district ID
- 4813290
- Math proficiency
- 50% ▼ -15.00%
- Reading proficiency
- 61% ▼ -5.00%
- Median HH income
- $83,282
- Composite
- 50.49/100
- National rank
- #1853
- State rank
- #71 of 826 in TX
Livability — Celina
- Score
- 68/100
- State rank
- #450
- US rank
- #9135
Category grades
Schools grade is shown separately in the Schools card above.
Census & demographics
- Census place
- Celina, TX
- County
- Collin County · 1,159,394 people
- City population
- 34,260
- Metro
- Dallas-Fort Worth-Arlington, TX
- Population (ZIP)
- 34,260
- Household income
- $168,250
- Rent vs Own
- Severe rent burden
- 152.0
Population outlook (Collin County) Hauer SSP2
- Today (2025)
- 1,210,074 people
- By 2030
- 1,358,201 · +12.2%
- By 2040
- 1,654,061 · +36.7%
- By 2050
- 1,937,359 · +60.1%
- By 2075
- 2,567,039 · +112.1%
- By 2100
- 2,952,048 · +144.0%
Race, ethnicity, and origin ACS 2023
- Neighborhood character
- Diverse neighborhood (Simpson 0.56)
- Race & ethnicity
- White 64% Two or more races 11% Hispanic / Latino 11% Asian 11% Black 8%
- Hispanic origin (detail)
- Mexican 9%
- Common ancestry
- Slovak 5% Lithuanian 4% Romanian 1%
- Foreign-born
- 14% · China, Canada, Vietnam
- Languages at home
- 83% English-only · Spanish 6% Chinese 3% Other Asian/Pacific 3%
Political lean MEDSL · Collin
- 2024 margin
- R (+11.1) · D 43.1% · R 54.3% · Other 2.6%
- 2008→2024 swing
- +14.4pp toward D · 2008: -25.6pp · 2024: -11.1pp
- All cycles
- 2024: R+11.1 2020: R+4.3 2016: R+17.0 2012: R+31.6 2008: R+25.6
Not yet ingested
- Civics
- —
Market trends
- HPI YoY
- ▼ -83.07%
- Current HPI
- 276.6307
- Rent YoY
- ▼ -4.62%
- Metro
- Dallas-Fort Worth-Arlington, TX
- State GDP YoY
- ▲ 3.95%
- F500 in state
- 110
Industry mix (Fortune 500 HQ in TX)
| Industry | F500 HQs | Revenue |
|---|---|---|
| Energy | 16 | $1,198B |
|
||
| Technology | 5 | $198B |
|
||
| Engineering / Construction | 4 | $72B |
|
||
| Energy Services | 3 | $60B |
|
||
| Utilities | 3 | $41B |
|
||
| Healthcare | 2 | $330B |
|
||
Price history
-3.9% since first listed5 events — show timeline
- 2026-03-09 Pending — NTREIS
- 2026-03-07 Price Changed $316,999 NTREIS
- 2026-03-04 Price Changed $318,999 NTREIS
- 2026-02-25 Price Changed $325,999 NTREIS
- 2026-02-14 Listed $329,999 NTREIS
Cash-flow waterfall
monthlySold comps — $/sqft
last 12 mo · ≤1 miLoading sold comps…