103 Egret Ln · Everglades, FL
Flood risk No data
- FEMA flood zone
- —
- Chance of flooding over 30 yrs
- —
- Est. flood insurance / yr
- —
Fire risk No data
- Est. fire insurance / yr
- —
Heat risk No data
- Hot days now (above threshold)
- —
- Hot days in 30 yrs
- —
Wind risk No data
- Chance of severe wind over 30 yrs
- —
Air-quality risk No data
- Unhealthy air days now
- —
- Unhealthy air days in 30 yrs
- —
Risk factors via First Street. Map © Google.
Why this score? — see what drove the C- grade
The composite is a weighted blend of 9 inputs, each scored 0–100. Each bar is that input's sub-score; the figure is the points it added to the 100-point composite (weight × sub-score).
- Cash flow +16.5/30.0
- ARV discount +7.5/15.0
- DSCR +5.1/10.0
- Appreciation +5.0/10.0
- Schools +5.0/10.0
- 1% rule +4.5/10.0
- Livability +3.7/5.0
- Rent growth +2.5/5.0
- Condition / age +2.5/5.0
$164,000
🖨 Deal sheet 📄 Offer letter ✓ Due diligence
Listing remarks
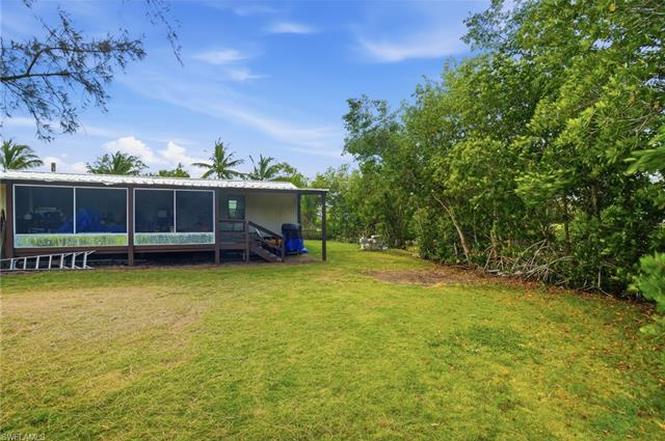
103 Egret Ln. , Everglades City, FL 34139 Plantation Island | Waterfront Lot with Renovated Trailer This waterfront Plantation Island property includes an existing 2-bedroom, 2-bathroom trailer with a new roof installed in 2024 and multiple recent renovations, including new drywall walls and ceilings. The lot offers water access with space to build a private dock, making it ideal for boating and fishing enthusiasts. Enjoy island living just minutes from Everglades City while maintaining flexibility for future improvements or redevelopment. Updated local building codes now allow new residential construction on Plantation Island. The City has approved a grant to bring city sewer service
Key facts
- Private dock
- Waterfront lot
- Renovated trailer
Tags
Property features AI
Finance
- Other: Gulf access with no bridges (canal); Canal width approximately 31–80 feet; Waterfront: canal with canal/mangrove view; Lot area approximately 0.09 acres (lot unit 103)
- HOA & community: No HOA maintenance; Boating community
Exterior
- Utilities: Central water; Septic sewer; Cable available
- Home design: Manufactured residential property; Single-story; Rear (west) exposure; Located in Plantation Island development
- Construction: Built in 1988
- Exterior features: Deck; Patio; Aluminum siding exterior; Metal roof; Windows/storm protection details listed in remarks
Interior
- Kitchen: Electric cooktop; Refrigerator/Freezer
- Bedrooms: 2 bedrooms
- Bathrooms: 2 full bathrooms; No master bath
- Heating & cooling: Window unit heat; Window unit cooling
- Interior features: High speed internet available; Unfurnished; Open or nonstandard floor plan
- Laundry & utility: Washer; Dryer
Neighborhood map
What this means for you Summary
Snapshot
- This is a 2-bed/2.0-bath single-family listed at $164k.
Deal economics
- At list price, monthly cash flow is $97 ($1k/yr) — positive.
- The deal already cash-flows at list — no discount required.
- To meet the 1% rule (rent ≥ 1% of price), the offer needs to be $156k (5.0% below list).
- Recommended offer: $144k (12.0% below list) — sets the bar for market timing.
Location & tenants
- Location reads 73/100 on livability (#299 in FL) — a middle-class / working-renter tenant base. Strengths: crime A+, employment A+, housing A+; Watch: health & safety D, amenities F, commute F.
- Collier (suburban): math 60% / reading 56% proficiency, ranked #16 of 73 in FL (top 22%) — acceptable for families but not a draw, mixed tenant base, ~2y average lease.
- Market conditions: 32 active listings in the ZIP; 3,520 units permitted in Collier County in 2024 (959 in 5+ unit buildings).
Forward outlook
- In year one you build about $6k of equity ($1k loan paydown + $5k appreciation (3.0% local appreciation)).
- Collier County population projected at +30% by 2050 — long-run rental-demand tailwind backs the buy-and-hold thesis.
- At projected returns (3.0% appreciation + 3.0% rent growth), your $46k cash investment doubles in ~6 years — after that, you're playing with house money.
- By year 6, paydown + projected appreciation supports a ~$32k cash-out refi (75% LTV) — recoverable capital for the next deal without selling this one.
Negotiation context
- It's been on market 171 days — a 12% lower offer ($144k) is reasonable based on typical stale-listing flexibility.
Questions for the listing agent
- It's been on market 171 days. Have you received any prior offers? Is the seller open to a 12% concession, seller financing, or rate buy-down credit?
- Why hasn't it sold? Are there any deal-killer items the seller is aware of (foundation, flood, title, zoning, code violations)?
- Is there a deadline driving the sale (1031 exchange, divorce, estate, relocation)? That informs how much negotiation room exists.
- Schools are B-rated — typically a magnet for longer-tenancy family renters. What's the average tenant stay here, and is there a school-zone premium baked into asking?
- What's the average days-on-market for RENTAL listings here right now (not sales)? A rising rental-DOM trend means longer vacancies and softer asking-rent achievability than the comps imply.
- What's the recent tenant-quality profile in this submarket — average credit score on applications, eviction rate, late-payment / NSF rate, and stable-employment percentage? A property-management company in the area should have these aggregated.
- How much new for-sale + rental construction is in the pipeline within 1–3 miles? Heavy new supply typically softens prices + rents 12–24 months out; constrained supply supports both.
Investment metrics
- 1% rule
- 0.95% ✗
- Cap rate
- 7.00%
- Cash-on-cash
- 2.53%
- DSCR
- 1.11
- GRM
- 8.8
CMA / ARV
No comps found within radius.
Projected returns pro-forma
3.0% appreciation · 3.0% rent growth · sell at horizon
- IRR
- 9.9%
- Equity multiple
- 1.57×
- Total profit
- $25,954
- Equity at exit
- $73,742
- IRR
- 12.2%
- Equity multiple
- 2.82×
- Total profit
- $83,799
- Equity at exit
- $113,644
Cash invested: $45,920 (down + closing). Projections, not guarantees.
Landlord ↔ Tenant lean methodology
- Overall (STATE)
- 87 Strongly Landlord-Friendly
- State Florida
- 87 Strongly Landlord-Friendly · R+3
- County
- — inherits STATE
- City
- — inherits STATE
ZIP-level market 34139
- Active inventory
- 32
- Price-to-rent
- 8.8×
Monthly cashflow live
- Estimated rent
- $1,557 medium interval (Pro) →
- Mortgage (P&I)
- −$860
- Tax est. 1.5%
- −$205 /mo · $2,460/yr
- Insurance
- −$68
- HOA
- −$0
- Vacancy / Maint / Mgmt
- −$327
- Net cashflow
- $97
Break-even live
UW: 25.0% down · 7.5% · 30yr · 1.5% tax · 5.0% vac · 8.0% maint · 8.0% mgmt
Financing live
Cash to close
- Down payment
- $41,000
- Closing costs
- $4,920
- Reserves months
- —
- Total cash needed
- —
Loan-product check · same deal, 3 products live
Conventional
25% down · 7.5% · 30yr
- Down + closing
- —
- Monthly P&I
- —
- Monthly cashflow
- —
- DSCR
- —
- Eligible?
- —
Personal DTI + credit; lowest rate.
DSCR
20% down · 8.5% · 30yr
- Down + closing
- —
- Monthly P&I
- —
- Monthly cashflow
- —
- DSCR
- —
- Eligible?
- —
No personal income docs; deal must DSCR.
Hard money
10% down · 12.0% · 12mo
- Down + closing
- —
- Monthly P&I
- —
- Monthly cashflow
- —
- DSCR
- —
- Eligible?
- —
Short-term bridge; refi at stabilization.
Listing history 15 events
-
2026-06-18days on market $164,000 Active 171 DOM
-
2026-06-17days on market $164,000 Active 170 DOM
-
2026-06-16days on market $164,000 Active 169 DOM
-
2026-06-15days on market $164,000 Active 168 DOM
-
2026-06-10days on market $164,000 Active 163 DOM
-
2026-06-09days on market $164,000 Active 162 DOM
-
2026-06-08days on market $164,000 Active 161 DOM
-
2026-06-07days on market $164,000 Active 160 DOM
-
2026-06-03days on market $164,000 Active 156 DOM
-
2026-06-02days on market $164,000 Active 155 DOM
-
2026-06-01days on market $164,000 Active 154 DOM
-
2026-05-31days on market $164,000 Active 153 DOM
-
2026-05-30days on market $164,000 Active 152 DOM
-
2026-01-31price $164,000
-
2025-12-29$165,000 Active
ⓘ Source: listings_history table (triggers on properties + properties_extension) + one-shot
backfill from property_details.listing_events for pre-trigger history.
Nearby sold comps map
Loading sold comps map…
Walkable amenities ~0.75 mi
Loading nearby amenities…
Taxation est. · year 1
- Rental income
- $18,688
- − Mortgage interest
- −$9,187
- − Property taxes
- −$2,460
- − Insurance
- −$820
- − Repairs & maintenance
- −$1,495
- − Management
- −$1,495
- − Depreciation
- −$4,771
- Taxable loss
- −$1,539
- Est. tax savings @ 24.0%
- +$369
- After-tax cash flow
- $1,533/yr
For passive investors: Depreciation is non-cash, so a rental often shows a tax loss while cash-flowing — sheltering income. Rental losses are passive: they offset passive income freely, and up to $25,000/yr can offset ordinary (W-2) income if you actively participate and your MAGI is under $100k (phasing out to $0 by $150k); unused losses carry forward. On sale, claimed depreciation is recaptured at up to 25%, and gains may owe capital-gains tax (a 1031 exchange can defer both). Figures are a year-1 estimate at your 24.0% rate — not tax advice; consult a CPA.
Schools (NCES district)
- District
- Collier
- NCES district ID
- 1200330
- Math proficiency
- 60% ▼ -4.00%
- Reading proficiency
- 56% ▼ -2.00%
- Median HH income
- $58,275
- Composite
- 50.23/100
- National rank
- #1892
- State rank
- #16 of 73 in FL
Livability — Everglades
- Score
- 73/100
- State rank
- #299
- US rank
- #5108
Category grades
Schools grade is shown separately in the Schools card above.
Census & demographics
- Census place
- Everglades, FL
- City population
- 248
- Population (ZIP)
- 248
Population outlook (Collier County) Hauer SSP2
- Today (2025)
- 420,858 people
- By 2030
- 450,054 · +6.9%
- By 2040
- 502,232 · +19.3%
- By 2050
- 544,932 · +29.5%
- By 2075
- 627,203 · +49.0%
- By 2100
- 659,015 · +56.6%
Race, ethnicity, and origin ACS 2023
- Neighborhood character
- Predominantly White (82%)
- Race & ethnicity
- White 82% Hispanic / Latino 16% Two or more races 16% Native American 2%
- Hispanic origin (detail)
- Common ancestry
- Slovak 3% Romanian 1%
- Foreign-born
- 10% · Canada
- Languages at home
- 81% English-only · Spanish 13% Other Indo-European 5%
Political lean MEDSL · Collier
- 2024 margin
- Solid R (+33.1) · D 33.1% · R 66.2%
- 2008→2024 swing
- -10.6pp toward R · 2008: -22.5pp · 2024: -33.1pp
- All cycles
- 2024: R+33.1 2020: R+24.7 2016: R+26.0 2012: R+30.1 2008: R+22.5
Not yet ingested
- Civics
- —
Market trends
- HPI YoY
- —
- Current HPI
- —
- Rent YoY
- —
- Metro
- —
- State GDP YoY
- ▲ 3.28%
- F500 in state
- 36
Industry mix (Fortune 500 HQ in FL)
| Industry | F500 HQs | Revenue |
|---|---|---|
| Industrial Technology | 2 | $29B |
|
||
| Insurance | 2 | $17B |
|
||
| Retail | 1 | $60B |
|
||
| Technology Distribution | 1 | $58B |
|
||
| Homebuilding | 1 | $35B |
|
||
| Technology Manufacturing | 1 | $35B |
|
||
Price history
-0.6% since first listed2 events — show timeline
- 2026-01-31 Price Changed $164,000 NAPLESMLS
- 2025-12-29 Listed $165,000 NAPLESMLS
Cash-flow waterfall
monthlySold comps — $/sqft
last 12 mo · ≤1 miLoading sold comps…