35436 Knoll Way #14535 · Long Neck, DE
Flood risk 9/10 · Severe
- FEMA flood zone
- AE
- Chance of flooding over 30 yrs
- 0.99%
- Est. flood insurance / yr
- $2,026 – $9,024
Fire risk 1/10 · Minimal
- Est. fire insurance / yr
- $476 – $884
Heat risk 9/10 · Severe
- Hot days now (above 100°F)
- 7 days/yr
- Hot days in 30 yrs
- 19 days/yr
Wind risk 8/10 · Major
- Chance of severe wind over 30 yrs
- 80.0%
Air-quality risk 2/10 · Minimal
- Unhealthy air days now
- 1 days/yr
- Unhealthy air days in 30 yrs
- 1 days/yr
Risk factors via First Street. Map © Google.
Why this score? — see what drove the B+ grade
The composite is a weighted blend of 9 inputs, each scored 0–100. Each bar is that input's sub-score; the figure is the points it added to the 100-point composite (weight × sub-score).
- Cash flow +30.0/30.0
- ARV discount +15.0/15.0
- 1% rule +10.0/10.0
- DSCR +10.0/10.0
- Livability +3.5/5.0
- Schools +2.9/10.0
- Rent growth +2.5/5.0
- Condition / age +2.2/5.0
- Appreciation +0.0/10.0
$89,999
🖨 Deal sheet 📄 Offer letter ✓ Due diligence
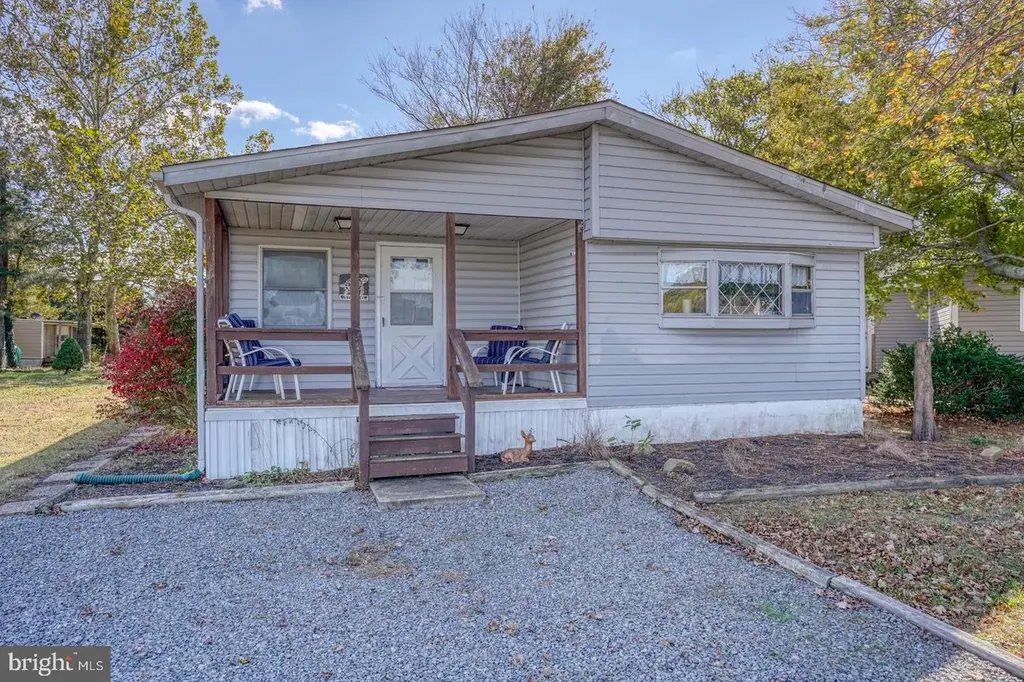
Listing remarks
Experience coastal living in Mariner’s Cove, a sought-after waterfront community in Long Neck offering a pool, clubhouse, boat docks, boat ramp, and year-round community events and activities. This home offers a peaceful and private setting within walking distance to the water. Inside, you’ll love the generous open-concept layout designed for easy everyday living and entertaining. The living room, dining area, and kitchen flow seamlessly into the enclosed porch, creating an expansive “great room” perfect for gathering with family and friends year-round. Recent improvements include all new flooring/subfloor, bathroom update, panel box and breakers, and re-painted kitc
Key facts
- Boat docks
- Waterfront community
- Pool
Tags
Property features AI
Finance
- Other: Property manager present; Located outside city limits; Pets allowed (cats and dogs OK); Community pool
- Financial info: Land lease: $829.08 per month; Land lease years remaining: 100
- HOA & community: Annual HOA fee includes pool access; Community amenities: outdoor pool and club house; Annual HOA fee: $25
Exterior
- Parking: Stone driveway; Driveway parking; Off-street parking; On-street parking
- Utilities: Public water; Public sewer; Electric available; Propane available; Cable TV
- Home design: Manufactured home; Single-story; Main entrance faces northwest; Water-oriented (bay frontage on Indian River); Bayblock location
- Construction: Modular/manufactured construction; Assessor-provided year built
- Exterior features: Outbuilding(s); Enclosed porch; Screened porch; Deck(s)
Interior
- Kitchen: Microwave; Self-cleaning oven; Refrigerator
- Bedrooms: Three bedrooms on the main level
- Flooring: Carpet; Vinyl
- Bathrooms: One full bathroom on the main level
- Heating & cooling: Central heating (propane - leased); Central air conditioning; Ceiling fan cooling; Electric hot water
- Interior features: Ceiling fans; Combination dining/living area; Family room off the kitchen; Entry-level bedroom; Window treatments; No basement
- Laundry & utility: Washer and dryer; Electric hot water
Neighborhood map
What this means for you Summary
Snapshot
- This is a 3-bed/1.0-bath single-family listed at $90k. Condition is rated fair.
Deal economics
- At list price, monthly cash flow is $693 ($8k/yr) — positive.
- The deal already cash-flows at list — no discount required.
- Meets the 1% rule at list price ($2k rent vs $90k).
- Recommended offer: $89k (1.5% below list) — sets the bar for market timing.
- Cap rate 21.7% vs local median 3.2% in Long Neck — top-decile yield for the area; either an underpriced asset or a hidden risk that comps aren't pricing in. Stress-test before assuming the spread holds.
Location & tenants
- Location reads 69/100 on livability (#30 in DE) — a middle-class / working-renter tenant base. Strengths: cost of living A+, housing A+, crime A-; Watch: employment D+, schools F, amenities F.
- Indian River School District (rural): math 25% / reading 41% proficiency, ranked #14 of 26 in DE (top 54%) — families likely to look elsewhere, expect single-tenant / working-renter base with shorter leases.
- Market conditions: 865 active listings in the ZIP; 1 comparable units currently listed for rent nearby; solid renter incomes; 4,354 units permitted in Sussex County in 2024 (344 in 5+ unit buildings).
- This rent runs 34% of the median local income ($78k/yr) — at the standard rent-burdened threshold; future hikes will face affordability resistance.
Forward outlook
- Local home prices are declining (-3.0%/yr); year-one equity from $622 of loan paydown is wiped out by about $3k of value loss. Plan a longer hold.
- Sussex County population projected at +25% by 2050 — long-run rental-demand tailwind backs the buy-and-hold thesis.
- At projected returns (-3.0% appreciation + 3.0% rent growth), your $25k cash investment doubles in ~4 years — after that, you're playing with house money.
Negotiation context
- It's been on market 20 days — a 2% lower offer ($89k) is reasonable based on typical stale-listing flexibility.
- 2 sale attempts since 3y ago; this cycle's ask has dropped $10k (10%) from the opening price — seller is motivated, your offer sets the floor, not the list.
Risks & watch-outs
- Watch-outs: flood insurance adds $460/mo.
- Climate carrying-cost: in FEMA flood zone AE (mandatory federal flood insurance); severe wind risk, 80% chance of damaging wind over 30y; extreme-heat days projected 7→19/yr by 2055 (HVAC capex compounding) — expect insurance premiums to compound above CPI over the hold.
Questions for the listing agent
- Have any recent inspections been done? Can we get a copy of the seller's disclosures and any deferred-maintenance estimates?
- What's the actual annual flood-insurance premium (NFIP or private), and is the property in a SFHA with mandatory coverage?
- What does the HOA fee cover, when was the last increase, and are there any pending special assessments or reserve-fund shortfalls?
- Is there a deadline driving the sale (1031 exchange, divorce, estate, relocation)? That informs how much negotiation room exists.
- Schools are F-rated, which usually means shorter tenancies and higher turnover. Who's the typical renter profile here, and what's been the actual vacancy rate?
- What's the average days-on-market for RENTAL listings here right now (not sales)? A rising rental-DOM trend means longer vacancies and softer asking-rent achievability than the comps imply.
- What's the recent tenant-quality profile in this submarket — average credit score on applications, eviction rate, late-payment / NSF rate, and stable-employment percentage? A property-management company in the area should have these aggregated.
- How much new for-sale + rental construction is in the pipeline within 1–3 miles? Heavy new supply typically softens prices + rents 12–24 months out; constrained supply supports both.
Investment metrics
- 1% rule
- 2.50% ✓
- Cap rate
- 21.67%
- Cash-on-cash
- 54.92%
- DSCR
- 3.44
- GRM
- 3.3
CMA / ARV
- ARV (on-the-fly)
- $114,492
- Comps found
- 12
Show comp detail 12 sales within ~0.75 mi
| Address | Dist | Beds/Ba | Sqft | Sold | Price | $/sf | Match |
|---|---|---|---|---|---|---|---|
| 26221 Cove Dr | 0.26mi | 3/2.0 | 1,296 (-2%) | 4mo | $205,000 | $158 | 78 |
| 35434 Pine Dr | 0.18mi | 3/2.0 | 1,396 (+6%) | 3mo | $106,500 | $76 | 75 |
| 35539 Pine Dr | 0.10mi | 3/2.0 | 1,216 (-8%) | 4mo | $93,500 | $77 | 75 |
| 26013 Seagull Ln #48469 | 0.43mi | 3/2.0 | 1,344 (+2%) | 1mo | $90,000 | $67 | 72 |
| 35518 Joann Dr #137 | 0.07mi | 2/— (-1) | 1,484 (+13%) | 3mo | $138,000 | $93 | 68 |
| 25861 Mahogany St | 0.53mi | 4/2.0 (+1) | 1,360 (+3%) | 2mo | $107,500 | $79 | 59 |
| 34995 Keelson St Unit E-274 | 0.55mi | 3/2.0 | 1,232 (-6%) | 3mo | $158,500 | $129 | 58 |
| 25950 S Maple St | 0.39mi | 4/1.5 (+1) | 1,216 (-8%) | 6mo | $51,000 | $42 | 57 |
| 25841 N Cherry St #4382 | 0.48mi | 3/1.0 | 1,176 (-11%) | 4mo | $52,250 | $44 | 56 |
| 35262 7th St | 0.28mi | 2/2.0 (-1) | 1,132 (-14%) | 0mo | $98,000 | $87 | 54 |
| 34848 Halyard St Unit E-431 | 0.69mi | 3/2.0 | 1,366 (+4%) | 5mo | $273,176 | $200 | 53 |
| 35547 E Harbor Dr | 0.65mi | 2/2.0 (-1) | 1,184 (-10%) | 1mo | $165,000 | $139 | 43 |
Match score weights: distance 35% · size 25% · config 20% · recency 20%. Top-matched comps best support the ARV.
Projected returns pro-forma
-3.0% appreciation · 3.0% rent growth · sell at horizon
- IRR
- 28.4%
- Equity multiple
- 2.18×
- Total profit
- $29,862
- Equity at exit
- $13,419
- IRR
- 35.9%
- Equity multiple
- 4.34×
- Total profit
- $84,116
- Equity at exit
- $7,781
Cash invested: $25,200 (down + closing). Projections, not guarantees.
Landlord ↔ Tenant lean methodology
- Overall (STATE)
- 70 Landlord-Friendly
- State Delaware
- 70 Landlord-Friendly · D+7
- County
- — inherits STATE
- City
- — inherits STATE
ZIP-level market 19966
- Home prices YoY
- -6.4%
- Active inventory
- 865
- Price-to-rent
- 3.3×
Monthly cashflow live
- Estimated rent
- $2,250 medium interval (Pro) →
- Mortgage (P&I)
- −$472
- Tax est. 1.5%
- −$112 /mo · $1,350/yr
- Insurance
- −$37
- Flood insurance flood zone
- −$460 /mo · $5,525/yr
- HOA
- −$2
- Vacancy / Maint / Mgmt
- −$472
- Net cashflow
- $693
Break-even live
UW: 25.0% down · 7.5% · 30yr · 1.5% tax · 5.0% vac · 8.0% maint · 8.0% mgmt
Financing live
Cash to close
- Down payment
- $22,500
- Closing costs
- $2,700
- Reserves months
- —
- Total cash needed
- —
Loan-product check · same deal, 3 products live
Conventional
25% down · 7.5% · 30yr
- Down + closing
- —
- Monthly P&I
- —
- Monthly cashflow
- —
- DSCR
- —
- Eligible?
- —
Personal DTI + credit; lowest rate.
DSCR
20% down · 8.5% · 30yr
- Down + closing
- —
- Monthly P&I
- —
- Monthly cashflow
- —
- DSCR
- —
- Eligible?
- —
No personal income docs; deal must DSCR.
Hard money
10% down · 12.0% · 12mo
- Down + closing
- —
- Monthly P&I
- —
- Monthly cashflow
- —
- DSCR
- —
- Eligible?
- —
Short-term bridge; refi at stabilization.
Rent comps 1 comps
| Address | Beds | Baths | Sqft | Rent | $/sqft | DOM | Units | Dist |
|---|---|---|---|---|---|---|---|---|
| 35829 S Gloucester Cir Unit 35829 Long Neck, DE | 3.0 | 2.5 | 1500 | $1,995 | $1.33 | 13d | 1 | 0.28mi |
HOA detail
- Monthly dues
- $2 · $24/yr
- Likely covers
- waterpool
Listing history 15 events
-
2026-06-18days on market $89,999 Active 20 DOM
-
2026-06-17days on market $89,999 Active 19 DOM
-
2026-06-16days on market $89,999 Active 18 DOM
-
2026-06-15days on market $89,999 Active 17 DOM
-
2026-06-14days on market $89,999 Active 15 DOM
-
2026-06-13days on market $89,999 Active 14 DOM
-
2026-06-10days on market $89,999 Active 12 DOM
-
2026-06-09days on market $89,999 Active 11 DOM
-
2026-06-08pricedays on market $89,999 Active 10 DOM
-
2026-06-07days on market $100,000 Active 9 DOM
-
2026-06-02days on market $100,000 Active 4 DOM
-
2026-06-01days on market $100,000 Active 3 DOM
-
2026-05-31days on market $100,000 Active 2 DOM
-
2026-05-30remarks 675-char remark
-
2026-05-30$100,000 Active 1 DOM
ⓘ Source: listings_history table (triggers on properties + properties_extension) + one-shot
backfill from property_details.listing_events for pre-trigger history.
Climate risk First Street
- Flood 9/10 Extreme FEMA zone AE · 99% chance over 30 yrs
- Wildfire 1/10 Low
- Heat 9/10 Extreme 7 d/yr ≥100°F today · 19 d/yr by 30 yrs out
- Wind 8/10 Severe 80% chance of damaging wind over 30 yrs
- Air quality 2/10 Low 1 unhealthy d/yr today · 1 by 30 yrs out
Nearby sold comps map
Loading sold comps map…
Walkable amenities ~0.75 mi
Loading nearby amenities…
Taxation est. · year 1
- Rental income
- $26,996
- − Mortgage interest
- −$5,041
- − Property taxes
- −$1,350
- − Insurance
- −$5,975
- − Repairs & maintenance
- −$2,160
- − Management
- −$2,160
- − HOA
- −$24
- − Depreciation
- −$2,618
- Taxable income
- $7,668
- Est. tax owed @ 24.0%
- −$1,840
- After-tax cash flow
- $6,474/yr
For passive investors: Depreciation is non-cash, so a rental often shows a tax loss while cash-flowing — sheltering income. Rental losses are passive: they offset passive income freely, and up to $25,000/yr can offset ordinary (W-2) income if you actively participate and your MAGI is under $100k (phasing out to $0 by $150k); unused losses carry forward. On sale, claimed depreciation is recaptured at up to 25%, and gains may owe capital-gains tax (a 1031 exchange can defer both). Figures are a year-1 estimate at your 24.0% rate — not tax advice; consult a CPA.
Condition & rehab AI · 12 photos
This home requires a moderate level of rehabilitation, focusing on painting and minor repairs. It offers a good opportunity for an investor to increase its value through cosmetic updates.
Repairs flagged
- Major paint — paint appears faded and needs touch-up
- Minor kitchen cabinets — slight wear
Value-add opportunities
- Resale paint job — enhances curb appeal and interior
- Rental HVAC maintenance — improves comfort and tenant satisfaction
Renovation cost estimate screening
| Repair item | Severity | Est. cost |
|---|---|---|
| paint · paint appears faded and needs touch-up | Major | $15,000–50,000 |
| kitchen cabinets · slight wear | Minor | $500–3,000 |
| Total estimated repair cost · 2 items | $15,500–53,000 |
Value-add ROI direction
- Resale paint job — enhances curb appeal and interior ↑
- Rental HVAC maintenance — improves comfort and tenant satisfaction ↑
ⓘ Cost ranges are severity-bucket heuristics (US national rule-of-thumb). Get contractor quotes + a written scope before underwriting a rehab budget.
Schools (NCES district)
- District
- Indian River School District
- NCES district ID
- 1000680
- Math proficiency
- 25% ▼ -27.00%
- Reading proficiency
- 41% ▼ -17.00%
- Median HH income
- $53,838
- Composite
- 28.99/100
- National rank
- #6620
- State rank
- #14 of 26 in DE
Livability — Long Neck
- Score
- 69/100
- State rank
- #30
- US rank
- #8720
Category grades
Schools grade is shown separately in the Schools card above.
Census & demographics
- County
- Sussex County · 82,708 people
- Metro
- Salisbury, MD-DE
- Population (ZIP)
- 35,884
- Household income
- $78,305
- Rent vs Own
- Severe rent burden
- 464.0
Population outlook (Sussex County) Hauer SSP2
- Today (2025)
- 248,853 people
- By 2030
- 264,464 · +6.3%
- By 2040
- 290,980 · +16.9%
- By 2050
- 311,259 · +25.1%
- By 2075
- 352,488 · +41.6%
- By 2100
- 367,406 · +47.6%
Race, ethnicity, and origin ACS 2023
- Neighborhood character
- Predominantly White (74%)
- Race & ethnicity
- White 74% Hispanic / Latino 11% Black 8% Two or more races 7% Native American 3% Asian 1%
- Hispanic origin (detail)
- Mexican 3%
- Common ancestry
- Romanian 4% Slovak 2% Serbian 1%
- Foreign-born
- 8% · Canada, China
- Languages at home
- 88% English-only · Spanish 9% Other Indo-European 1%
Political lean MEDSL · Sussex
- 2024 margin
- R (+11.0) · D 43.9% · R 54.9% · Other 1.2%
- 2008→2024 swing
- -2.4pp toward R · 2008: -8.6pp · 2024: -11.0pp
- All cycles
- 2024: R+11.0 2020: R+11.2 2016: R+22.0 2012: R+13.0 2008: R+8.6
Not yet ingested
- Civics
- —
Market trends
- HPI YoY
- ▼ -18.26%
- Current HPI
- 268.5609
- Rent YoY
- —
- Metro
- Salisbury, MD-DE
- State GDP YoY
- —
- F500 in state
- 0
Price history
+14.9% since first listed4 events — show timeline
- 2026-05-29 Listed $100,000 BRIGHT MLS
- 2023-11-28 Listing Removed — BRIGHT MLS
- 2023-11-12 Price Changed $85,000 BRIGHT MLS
- 2023-10-31 Listed $87,000 BRIGHT MLS
Cash-flow waterfall
monthlySold comps — $/sqft
last 12 mo · ≤1 miLoading sold comps…