 Duplex
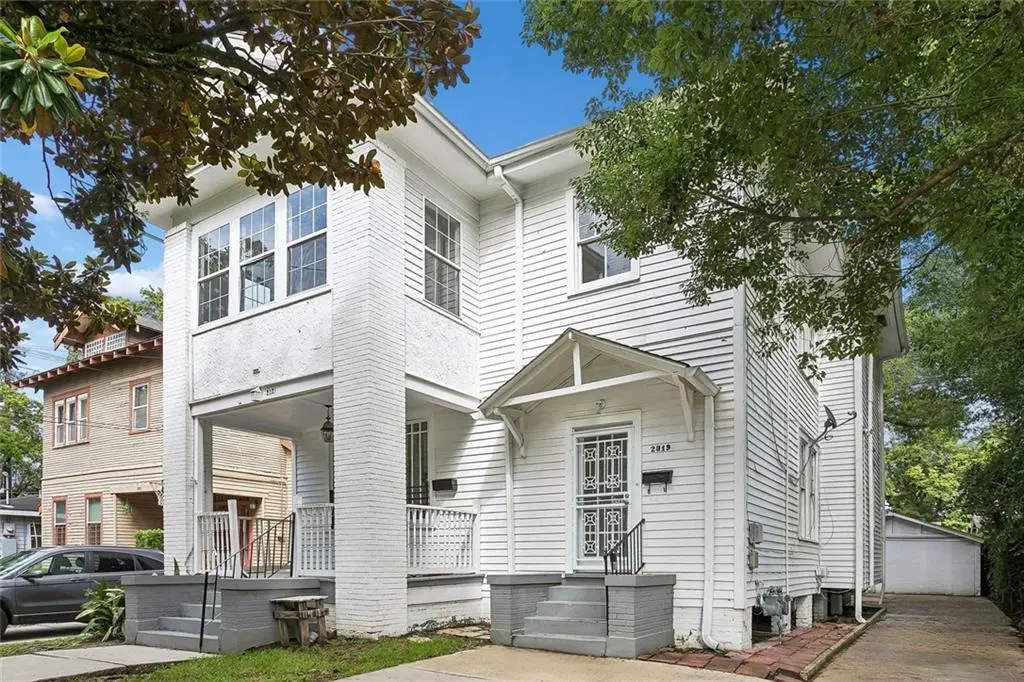
2319 21 Lowerline St · New Orleans, LA
Flood risk 7/10 · Major
- FEMA flood zone
- X
- Chance of flooding over 30 yrs
- 0.6%
- Est. flood insurance / yr
- $507 – $1,088
Fire risk 1/10 · Minimal
- Est. fire insurance / yr
- $1,269 – $2,357
Heat risk 10/10 · Severe
- Hot days now (above 108°F)
- 7 days/yr
- Hot days in 30 yrs
- 21 days/yr
Wind risk 10/10 · Severe
- Chance of severe wind over 30 yrs
- 99.0%
Air-quality risk 4/10 · Minor
- Unhealthy air days now
- 4 days/yr
- Unhealthy air days in 30 yrs
- 4 days/yr
Risk factors via First Street. Map © Google.
Why this score? — see what drove the D+ grade
The composite is a weighted blend of 9 inputs, each scored 0–100. Each bar is that input's sub-score; the figure is the points it added to the 100-point composite (weight × sub-score).
- Cash flow +21.6/30.0
- DSCR +6.9/10.0
- 1% rule +5.5/10.0
- Livability +4.0/5.0
- Rent growth +2.7/5.0
- Condition / age +2.5/5.0
- ARV discount +2.2/15.0
- Schools +1.6/10.0
- Appreciation +0.0/10.0
$525,000
🖨 Deal sheet 📄 Offer letter ✓ Due diligence
Multi-family units
County records classify this as Multi-Family (2-4 Unit). Listing-text estimate: 2 units. confirmed
Listing remarks
Located in the University Area, just minutes from Tulane University, Loyola University, Audubon Park, and the shops and restaurants along Maple Street, this freshly updated duplex offers a unique opportunity in one of New Orleans' most desirable neighborhoods. Situated on a large lot in Flood Zone X, each unit occupies its own level, providing added privacy and flexibility for a variety of living arrangements. Gorgeous wood floors flow throughout both residences, while central air and heat provide year-round comfort. Both units feature open floor plans filled with natural light, creating bright and inviting living spaces. Laundry hookups for each unit add convenience, and the driveway prov
Key facts
- Wood floors
- Central air and heat
- Large lot
Tags
Property features AI
Finance
- Other: Lot is a city, rectangular lot (approx. 45 x 114 x 47 x 115)
- Financial info: Two total units (multifamily); Tenants are responsible for electricity and gas
- HOA & community: No HOA information provided
Exterior
- Parking: Driveway
- Security: No security features provided
- Utilities: Public water; Public sewer
- Home design: Two-story building; Raised foundation
- Construction: Wood siding exterior; Asphalt roof; Built condition: Very good
- Exterior features: Front porch
Interior
- Kitchen: No kitchen appliance details provided
- Bedrooms: 2-unit property (unit-level bedroom counts not provided)
- Flooring: No flooring details provided
- Bathrooms: 3 full bathrooms; 2 half bathrooms
- Heating & cooling: Central heating; Central air conditioning
- Interior features: Very good overall condition
- Laundry & utility: Tenant(s) pay electricity and gas
Neighborhood map
What this means for you Summary
Snapshot
- This is a 2 × 4-bed/2.0-bath units multifamily listed at $525k.
Deal economics
- At list price, monthly cash flow is $727 ($9k/yr) — positive. Per door: $364/mo.
- The deal already cash-flows at list — no discount required.
- Meets the 1% rule at list price ($6k rent vs $525k).
- Cap rate 8.1% vs local median 4.4% in New Orleans — top-decile yield for the area; either an underpriced asset or a hidden risk that comps aren't pricing in. Stress-test before assuming the spread holds.
Location & tenants
- Location reads 81/100 on livability (#3 in LA, #1,383 nationally) — a professional / high-income tenant draw. Strengths: amenities A+, commute A+, health & safety A+; Watch: crime C-, employment D.
- Orleans Parish (urban): math 11% / reading 27% proficiency, ranked #69 of 98 in LA (top 70%) — low school quality limits family demand, transient renter base, plan for 1-2y turnover; 68% free/reduced lunch — lower-income household profile, screen leases tightly.
- Market conditions: Rents flat; 279 active listings in the ZIP; 1 comparable units currently listed for rent nearby; 710 units permitted in Orleans Parish in 2024 (244 in 5+ unit buildings).
- At $5,538/mo this rent would consume 104% of the median local household income ($64k/yr) (locally 2237% of renters already pay >50% of income on rent) — very limited rent-growth headroom before tenants either downsize or default.
Forward outlook
- Local home prices are declining (-3.0%/yr); year-one equity from $4k of loan paydown is wiped out by about $16k of value loss. Plan a longer hold.
- Orleans County population projected at +61% by 2050 — long-run rental-demand tailwind backs the buy-and-hold thesis.
Negotiation context
- Only 10 days on market — expect competitive offers; lowballing is unlikely to land.
- 3 sale attempts since 11y ago with the ask held roughly flat each time — persistent listings suggest the price (not the market) is what's stuck; bring a comps-based counter.
Risks & watch-outs
- Watch-outs: flood insurance adds $66/mo; built in 1921 — expect roof / HVAC / electrical / plumbing capex.
- Climate carrying-cost: major flood risk; severe wind risk, 99% chance of damaging wind over 30y; extreme-heat days projected 7→21/yr by 2055 (HVAC capex compounding) — expect insurance premiums to compound above CPI over the hold.
Questions for the listing agent
- Can we see the unit-by-unit rent roll, current vacancy, and any below-market leases? What's the average tenancy length?
- What capital expenditures (roof, boiler, parking lot, exteriors) have been made in the last 5 years, and what's planned in the next 2?
- Built in 1921 — when were the roof, HVAC, electrical panel, plumbing, and water heater last replaced?
- What's the actual annual flood-insurance premium (NFIP or private), and is the property in a SFHA with mandatory coverage?
- Is there a deadline driving the sale (1031 exchange, divorce, estate, relocation)? That informs how much negotiation room exists.
- The area grade is low — what's the realistic commute time and amenity access for the typical tenant pool here? Any planned neighborhood developments (good or bad) we should know about?
- What's the average days-on-market for RENTAL listings here right now (not sales)? A rising rental-DOM trend means longer vacancies and softer asking-rent achievability than the comps imply.
- What's the recent tenant-quality profile in this submarket — average credit score on applications, eviction rate, late-payment / NSF rate, and stable-employment percentage? A property-management company in the area should have these aggregated.
- How much new apartment / multifamily construction is in the pipeline within 1–3 miles? Heavy new supply (>2% of stock underway) typically softens rents 12–24 months out; light construction supports rent growth.
Investment metrics
- 1% rule
- 1.05% ✓
- Cap rate
- 8.11%
- Cash-on-cash
- 6.48%
- DSCR
- 1.29
- GRM
- 7.9
CMA / ARV
- ARV (on-the-fly)
- $469,248
- Comps found
- 11
Show comp detail 11 sales within ~0.75 mi
| Address | Dist | Beds/Ba | Sqft | Sold | Price | $/sf | Match |
|---|---|---|---|---|---|---|---|
| 7833 S Claiborne Ave | 0.19mi | 6/3.0 (-1) | 3,022 (+0%) | 6mo | $260,000 | $86 | 81 |
| 2908 Audubon St | 0.42mi | 7/4.0 | 3,215 (+7%) | 1mo | $500,000 | $156 | 64 |
| 7718 Hickory St | 0.39mi | 6/4.0 (-1) | 3,194 (+6%) | 5mo | $499,000 | $156 | 58 |
| 2231 33 Cambronne St | 0.52mi | 6/4.5 (-1) | 3,141 (+4%) | 4mo | $691,000 | $220 | 54 |
| 8137 39 Cohn St | 0.49mi | 6/2.5 (-1) | 2,767 (-8%) | 11mo | $534,000 | $193 | 48 |
| 3600 02 Upperline St | 0.72mi | 6/2.5 (-1) | 3,063 (+2%) | 18mo | $330,000 | $108 | 41 |
| 8436 38 Hickory St | 0.70mi | 6/5.0 (-1) | 2,780 (-8%) | 1mo | $565,000 | $203 | 41 |
| 2238 40 Dante St | 0.50mi | 6/5.0 (-1) | 3,415 (+14%) | 2mo | $525,000 | $154 | 39 |
| 2703-2705 Palmer Ave | 0.70mi | 7/— | 3,191 (+6%) | 22mo | $725,000 | $227 | 39 |
| 2703-2705 Palmer Ave | 0.70mi | 7/4.0 | 3,191 (+6%) | 22mo | $725,000 | $227 | 35 |
| 3411 Pine St | 0.74mi | 6/2.0 (-1) | 2,600 (-14%) | 21mo | $135,000 | $52 | 16 |
Match score weights: distance 35% · size 25% · config 20% · recency 20%. Top-matched comps best support the ARV.
Projected returns pro-forma
-3.0% appreciation · 0.97% rent growth · sell at horizon
- IRR
- -9.4%
- Equity multiple
- 0.66×
- Total profit
- $-49,748
- Equity at exit
- $78,279
- IRR
- -3.0%
- Equity multiple
- 0.82×
- Total profit
- $-26,972
- Equity at exit
- $45,392
Cash invested: $147,000 (down + closing). Projections, not guarantees.
Landlord ↔ Tenant lean methodology
- Overall (STATE)
- 90 Strongly Landlord-Friendly
- State Louisiana
- 90 Strongly Landlord-Friendly · R+12
- County
- — inherits STATE
- City
- — inherits STATE
ZIP-level market 70118
- Rents YoY
- 1.0%
- Active inventory
- 279
- Price-to-rent
- 15.8×
Monthly cashflow live
- Estimated rent
- $5,538 high interval (Pro) →
- Mortgage (P&I)
- −$2,753
- Tax from tax record
- −$609 /mo · $7,313/yr
- Insurance
- −$219
- Flood insurance flood zone
- −$66 /mo · $798/yr
- HOA
- −$0
- Vacancy / Maint / Mgmt
- −$1,163
- Net cashflow
- $727
Break-even live
2-unit breakdown (identical units grouped — click to expand)
| Units | Beds | Baths | Est. rent |
|---|---|---|---|
| 2× units | 4 | 2 | $5,538 |
| #1 | 4 | 2 | $2,769 |
| #2 | 4 | 2 | $2,769 |
| Total (2 units) | $5,538 | ||
UW: 25.0% down · 7.5% · 30yr · 1.5% tax · 5.0% vac · 8.0% maint · 8.0% mgmt
Financing live
Cash to close
- Down payment
- $131,250
- Closing costs
- $15,750
- Reserves months
- —
- Total cash needed
- —
Loan-product check · same deal, 3 products live
Conventional
25% down · 7.5% · 30yr
- Down + closing
- —
- Monthly P&I
- —
- Monthly cashflow
- —
- DSCR
- —
- Eligible?
- —
Personal DTI + credit; lowest rate.
DSCR
20% down · 8.5% · 30yr
- Down + closing
- —
- Monthly P&I
- —
- Monthly cashflow
- —
- DSCR
- —
- Eligible?
- —
No personal income docs; deal must DSCR.
Hard money
10% down · 12.0% · 12mo
- Down + closing
- —
- Monthly P&I
- —
- Monthly cashflow
- —
- DSCR
- —
- Eligible?
- —
Short-term bridge; refi at stabilization.
Rent comps 1 comps
| Address | Beds | Baths | Sqft | Rent | $/sqft | DOM | Units | Dist |
|---|---|---|---|---|---|---|---|---|
| 2808 Calhoun St New Orleans, LA | 6.0 | 4.0 | 3037 | $7,500 | $2.47 | 21d | 1 | 0.58mi |
Listing history 7 events
-
2026-06-15days on market $525,000 Active 10 DOM
-
2026-06-13days on market $525,000 Active 8 DOM
-
2026-06-10days on market $525,000 Active 5 DOM
-
2026-06-09days on market $525,000 Active 4 DOM
-
2026-06-08days on market $525,000 Active 3 DOM
-
2026-06-07remarks 699-char remark
-
2026-06-07$525,000 Active 2 DOM
ⓘ Source: listings_history table (triggers on properties + properties_extension) + one-shot
backfill from property_details.listing_events for pre-trigger history.
Tax reassessment forecast LA · Resets to sale price
- Current annual tax
- $7,313 · $609/mo
- Projected year-2 tax
- $7,313 · $609/mo
- Expected delta
- $0/yr ($0/mo · 0.0%)
ⓘ Screening estimate from a state-policy table — verify with the county assessor before closing.
Climate risk First Street
- Flood 7/10 Severe FEMA zone X · 60% chance over 30 yrs
- Wildfire 1/10 Low
- Heat 10/10 Extreme 7 d/yr ≥108°F today · 21 d/yr by 30 yrs out
- Wind 10/10 Extreme 99% chance of damaging wind over 30 yrs
- Air quality 4/10 Moderate 4 unhealthy d/yr today · 4 by 30 yrs out
Nearby sold comps map
Loading sold comps map…
Walkable amenities ~0.75 mi
Loading nearby amenities…
Taxation est. · year 1
- Rental income
- $66,456
- − Mortgage interest
- −$29,408
- − Property taxes
- −$7,313
- − Insurance
- −$3,422
- − Repairs & maintenance
- −$5,316
- − Management
- −$5,316
- − Depreciation
- −$15,273
- Taxable income
- $406
- Est. tax owed @ 24.0%
- −$98
- After-tax cash flow
- $8,629/yr
For passive investors: Depreciation is non-cash, so a rental often shows a tax loss while cash-flowing — sheltering income. Rental losses are passive: they offset passive income freely, and up to $25,000/yr can offset ordinary (W-2) income if you actively participate and your MAGI is under $100k (phasing out to $0 by $150k); unused losses carry forward. On sale, claimed depreciation is recaptured at up to 25%, and gains may owe capital-gains tax (a 1031 exchange can defer both). Figures are a year-1 estimate at your 24.0% rate — not tax advice; consult a CPA.
Schools (NCES district)
- District
- Orleans Parish
- NCES district ID
- 2201170
- Math proficiency
- 11% ▼ -52.00%
- Reading proficiency
- 27% ▼ -46.00%
- Median HH income
- $37,011
- Composite
- 15.78/100
- National rank
- #9271
- State rank
- #69 of 98 in LA
Livability — New Orleans
- Score
- 81/100
- State rank
- #3
- US rank
- #1383
Category grades
Schools grade is shown separately in the Schools card above.
Census & demographics
- Census place
- New Orleans, LA
- County
- Orleans Parish · 338,817 people
- City population
- 338,817
- Metro
- New Orleans-Metairie, LA
- Population (ZIP)
- 36,072
- Household income
- $63,750
- Rent vs Own
- Severe rent burden
- 2237.0
Population outlook (Orleans County) Hauer SSP2
- Today (2025)
- 513,025 people
- By 2030
- 575,781 · +12.2%
- By 2040
- 700,174 · +36.5%
- By 2050
- 826,541 · +61.1%
- By 2075
- 1,123,374 · +119.0%
- By 2100
- 1,355,609 · +164.2%
Race, ethnicity, and origin ACS 2023
- Neighborhood character
- Diverse neighborhood (Simpson 0.65)
- Race & ethnicity
- White 47% Black 34% Hispanic / Latino 11% Two or more races 11% Asian 4%
- Hispanic origin (detail)
- Mexican 2%
- Common ancestry
- Lithuanian 8% Italian 2% Romanian 2%
- Foreign-born
- 9% · Canada, China
- Languages at home
- 86% English-only · Spanish 7% French/Haitian/Cajun 2% Other Indo-European 2%
Political lean MEDSL · Orleans
- 2024 margin
- Solid D (+67.0) · D 82.2% · R 15.2% · Other 2.7%
- 2008→2024 swing
- +6.7pp toward D · 2008: 60.3pp · 2024: 67.0pp
- All cycles
- 2024: D+67.0 2020: D+68.2 2016: D+66.2 2012: D+62.5 2008: D+60.3
Not yet ingested
- Civics
- —
Market trends
- HPI YoY
- ▼ -210.46%
- Current HPI
- 282.9629
- Rent YoY
- ▲ 0.97%
- Metro
- New Orleans-Metairie, LA
- State GDP YoY
- ▲ 3.29%
- F500 in state
- 10
Industry mix (Fortune 500 HQ in LA)
| Industry | F500 HQs | Revenue |
|---|---|---|
| Telecommunications | 2 | $23B |
|
||
| Utilities | 1 | $12B |
|
||
| Wholesale / Distribution | 1 | $5B |
|
||
| Advertising | 1 | $2B |
|
||
Price history
+444.0% since first listed11 events — show timeline
- 2026-06-04 Listed $525,000 GSREIN
- 2024-09-24 Price Changed $628,000 GSREIN
- 2024-03-02 Rental Removed $2,400 GSREIN
- 2024-02-28 Price Changed $2,400 GSREIN
- 2024-02-26 Price Changed $2,600 GSREIN
- 2024-01-14 Price Changed $2,800 GSREIN
- 2023-12-11 Listed for Rent $3,200 GSREIN
- 2021-03-25 Sold (Public Records) $595,000 Public Records
- 2015-11-30 Listing Removed — GSREIN
- 2015-07-22 Listed $550,000 GSREIN
- 1998-06-18 Sold (Public Records) $96,500 Public Records
Property tax history
+4.1%/yrLatest (2026): $7,313 · +1.1% YoY. Source: county tax records.
Cash-flow waterfall
monthlySold comps — $/sqft
last 12 mo · ≤1 miLoading sold comps…