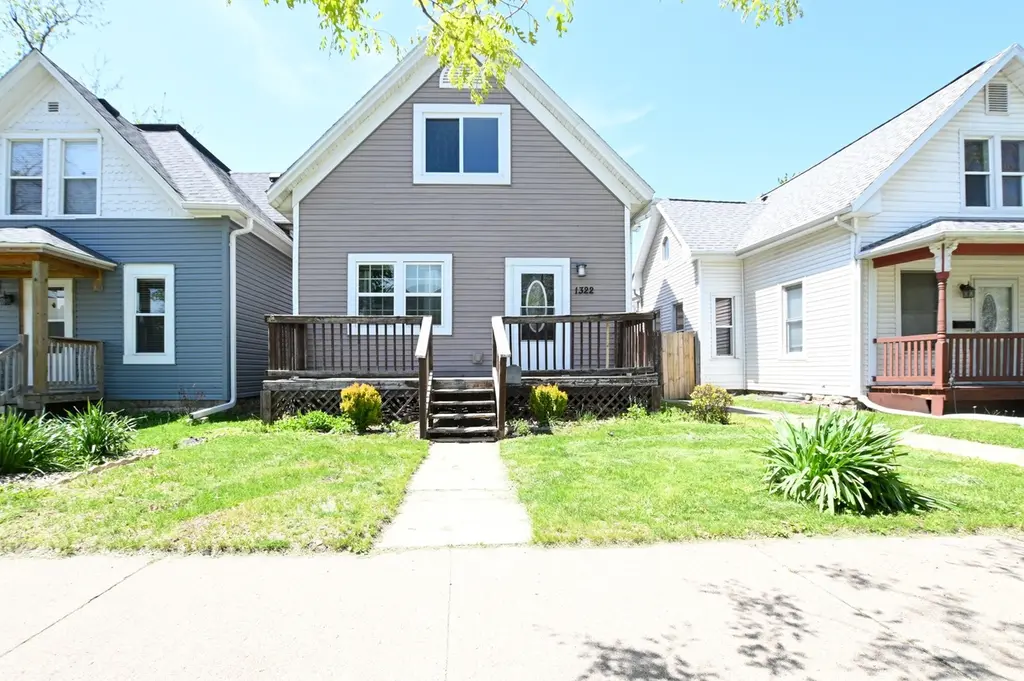
1322 J St SW · Cedar Rapids, IA
Flood risk 6/10 · Moderate
- FEMA flood zone
- X (unshaded)
- Chance of flooding over 30 yrs
- 0.74%
- Est. flood insurance / yr
- $473 – $860
Fire risk 1/10 · Minimal
- Est. fire insurance / yr
- $902 – $1,676
Heat risk 3/10 · Minor
- Hot days now (above 103°F)
- 7 days/yr
- Hot days in 30 yrs
- 15 days/yr
Wind risk 2/10 · Minimal
- Chance of severe wind over 30 yrs
- —
Air-quality risk 2/10 · Minimal
- Unhealthy air days now
- 0 days/yr
- Unhealthy air days in 30 yrs
- 1 days/yr
Risk factors via First Street. Map © Google.
Why this score? — see what drove the C- grade
The composite is a weighted blend of 9 inputs, each scored 0–100. Each bar is that input's sub-score; the figure is the points it added to the 100-point composite (weight × sub-score).
- Cash flow +17.8/30.0
- ARV discount +8.1/15.0
- DSCR +5.6/10.0
- 1% rule +4.8/10.0
- Rent growth +4.7/5.0
- Schools +4.7/10.0
- Livability +3.9/5.0
- Condition / age +2.5/5.0
- Appreciation +0.0/10.0
$164,900
🖨 Deal sheet 📄 Offer letter ✓ Due diligence
Listing remarks MLS
Check out this faboulous house close to Czech Village and Newbo! Well maintained, 4 bedroom and 2 full baths with good sized bedrooms and lots of storage. Relax knowing this home has newer HVAC and roof, updated windows and flooring. You wont have much to do because the home is painted with neutral colors throughout and updated appliances which all stay. Wood privacy fence surrounds a cute backyard and patio perfect for entertaining. The oversize 2 stall garage has tall garage doors, a lofty ceiling, lots of storage and even heat to keep you warm while working in the garage. There really is so much to love about this home!
Key facts
- 4,487 sq ft lot
- 2 garage spots
- Built 1910
Property features AI
Finance
- Other: Pets allowed
Exterior
- Parking: Detached heated garage with garage door opener; 2 garage spaces; On-street parking
- Utilities: Public water; Public sewer
- Home design: Single-family residence; Two-story; Frame construction with vinyl siding
- Construction: Shingle roof (not specified but typical for frame/vinyl construction)
- Exterior features: Deck; Patio; Fenced yard; Public-maintained road access
Interior
- Kitchen: Dishwasher; Disposal; Microwave; Range; Refrigerator
- Bathrooms: 2 full bathrooms
- Heating & cooling: Central air conditioning; Natural gas forced-air heating
- Interior features: Breakfast bar; Full basement
- Laundry & utility: Washer; Dryer; Gas water heater
Neighborhood map
What this means for you Summary
Snapshot
- This is a 4-bed/2.0-bath single-family listed at $165k.
Deal economics
- At list price, monthly cash flow is $135 ($2k/yr) — positive.
- The deal already cash-flows at list — no discount required.
- To meet the 1% rule (rent ≥ 1% of price), the offer needs to be $161k (2.5% below list).
- Recommended offer: $161k (2.5% below list) — sets the bar for 1% rule.
Location & tenants
- Location reads 78/100 on livability (#134 in IA, #2,474 nationally) — a middle-class / working-renter tenant base. Strengths: cost of living A+, housing A+, health & safety A+; Watch: crime C-, commute F.
- Cedar Rapids Community School District (urban): math 50% / reading 59% proficiency, ranked #265 of 289 in IA (top 92%) — acceptable for families but not a draw, mixed tenant base, ~2y average lease.
- Zoned schools: Cedar River Academy At Taylor (math 22% / reading 27%, grade F, #613 of 616 statewide, top 100%, 296 students, 78% FRL); Wilson Middle School (math 42% / reading 49%, grade D+, #231 of 246 statewide, top 94%, 395 students, 72% FRL); Thomas Jefferson High School (math 41% / reading 62%, grade D+, #307 of 336 statewide, top 91%, 1,543 students, 56% FRL) — zoned schools average 69% FRL vs 43% district-wide (26 pts higher); higher-poverty schools than district average — tighter screening recommended.
- Zoned-school proficiency averages 40% at this address vs 54% district-wide (-14 pts) — the specific schools serving this property underperform the Cedar Rapids Community School District average; the district grade overstates school quality for this exact location.
- Market conditions: Rents rising fast (+8.8%/yr); 415 active listings in the ZIP; 2 comparable units currently listed for rent nearby; 1,023 units permitted in Linn County in 2024 (456 in 5+ unit buildings).
Forward outlook
- Local home prices are declining (-3.0%/yr); year-one equity from $1k of loan paydown is wiped out by about $5k of value loss. Plan a longer hold.
- Linn County population projected at +16% by 2050 — long-run rental-demand tailwind backs the buy-and-hold thesis.
- At projected returns (-3.0% appreciation + 8.0% rent growth), your $46k cash investment doubles in ~10 years — after that, you're playing with house money.
Negotiation context
- Only 1 days on market — expect competitive offers; lowballing is unlikely to land.
- 2 sale attempts since 7y ago with the ask held roughly flat each time — persistent listings suggest the price (not the market) is what's stuck; bring a comps-based counter.
- Current owner paid $120k; 37% above their basis — modest negotiation headroom, anchor on the comps not their cost.
Risks & watch-outs
- Watch-outs: built in 1910 — expect roof / HVAC / electrical / plumbing capex.
- Climate carrying-cost: major flood risk — expect insurance premiums to compound above CPI over the hold.
Questions for the listing agent
- Built in 1910 — when were the roof, HVAC, electrical panel, plumbing, and water heater last replaced?
- Is there a deadline driving the sale (1031 exchange, divorce, estate, relocation)? That informs how much negotiation room exists.
- Schools are B-rated — typically a magnet for longer-tenancy family renters. What's the average tenant stay here, and is there a school-zone premium baked into asking?
- What's the average days-on-market for RENTAL listings here right now (not sales)? A rising rental-DOM trend means longer vacancies and softer asking-rent achievability than the comps imply.
- What's the recent tenant-quality profile in this submarket — average credit score on applications, eviction rate, late-payment / NSF rate, and stable-employment percentage? A property-management company in the area should have these aggregated.
- How much new for-sale + rental construction is in the pipeline within 1–3 miles? Heavy new supply typically softens prices + rents 12–24 months out; constrained supply supports both.
Investment metrics
- 1% rule
- 0.98% ✗
- Cap rate
- 7.28%
- Cash-on-cash
- 3.51%
- DSCR
- 1.16
- GRM
- 8.5
CMA / ARV
- ARV (on-the-fly)
- $167,010
- Comps found
- 12
Show comp detail 12 sales within ~0.75 mi
| Address | Dist | Beds/Ba | Sqft | Sold | Price | $/sf | Match |
|---|---|---|---|---|---|---|---|
| 1322 J St SW | 0.00mi | 4/2.0 | 1,465 (0%) | 0mo | $170,000 | $116 | 100 |
| 1300 M St SW | 0.26mi | 3/2.5 (-1) | 1,496 (+2%) | 3mo | $202,500 | $135 | 75 |
| 1411 1st Street St SW | 0.13mi | 4/2.0 | 1,609 (+10%) | 5mo | $120,000 | $75 | 73 |
| 353 7th Ave SW | 0.47mi | 4/1.5 | 1,406 (-4%) | 1mo | $55,000 | $39 | 68 |
| 1806 K St SW | 0.26mi | 3/1.5 (-1) | 1,578 (+8%) | 0mo | $80,000 | $51 | 67 |
| 2021 Hamilton St SW | 0.51mi | 4/2.5 | 1,565 (+7%) | 2mo | $198,500 | $127 | 61 |
| 812 16th Ave Ave SW | 0.68mi | 3/2.0 (-1) | 1,489 (+2%) | 2mo | $100,000 | $67 | 59 |
| 91 Wilson Ave SW | 0.63mi | 3/1.0 (-1) | 1,488 (+2%) | 1mo | $110,000 | $74 | 59 |
| 816 N St SW | 0.41mi | 3/1.5 (-1) | 1,344 (-8%) | 4mo | $58,000 | $43 | 57 |
| 360 Wilson Ave SW | 0.61mi | 3/1.0 (-1) | 1,363 (-7%) | 1mo | $156,000 | $114 | 50 |
| 523 SW 6th Ave | 0.62mi | 3/1.0 (-1) | 1,248 (-15%) | 0mo | $168,000 | $135 | 37 |
| 715 9th Ave SW | 0.63mi | 3/1.0 (-1) | 1,248 (-15%) | 1mo | $146,000 | $117 | 36 |
Match score weights: distance 35% · size 25% · config 20% · recency 20%. Top-matched comps best support the ARV.
Projected returns pro-forma
-3.0% appreciation · 8.0% rent growth · sell at horizon
- IRR
- -5.3%
- Equity multiple
- 0.79×
- Total profit
- $-9,600
- Equity at exit
- $24,587
- IRR
- 9.5%
- Equity multiple
- 1.90×
- Total profit
- $41,477
- Equity at exit
- $14,258
Cash invested: $46,172 (down + closing). Projections, not guarantees.
Landlord ↔ Tenant lean methodology
- Overall (STATE)
- 83 Strongly Landlord-Friendly
- State Iowa
- 83 Strongly Landlord-Friendly · R+6
- County
- — inherits STATE
- City
- — inherits STATE
ZIP-level market 52404
- Rents YoY
- 8.8%
- Active inventory
- 415
- Price-to-rent
- 8.5×
Monthly cashflow live
- Estimated rent
- $1,608 medium interval (Pro) →
- Mortgage (P&I)
- −$865
- Tax from tax record
- −$202 /mo · $2,420/yr
- Insurance
- −$69
- HOA
- −$0
- Vacancy / Maint / Mgmt
- −$338
- Net cashflow
- $135
Break-even live
UW: 25.0% down · 7.5% · 30yr · 1.5% tax · 5.0% vac · 8.0% maint · 8.0% mgmt
Financing live
Cash to close
- Down payment
- $41,225
- Closing costs
- $4,947
- Reserves months
- —
- Total cash needed
- —
Loan-product check · same deal, 3 products live
Conventional
25% down · 7.5% · 30yr
- Down + closing
- —
- Monthly P&I
- —
- Monthly cashflow
- —
- DSCR
- —
- Eligible?
- —
Personal DTI + credit; lowest rate.
DSCR
20% down · 8.5% · 30yr
- Down + closing
- —
- Monthly P&I
- —
- Monthly cashflow
- —
- DSCR
- —
- Eligible?
- —
No personal income docs; deal must DSCR.
Hard money
10% down · 12.0% · 12mo
- Down + closing
- —
- Monthly P&I
- —
- Monthly cashflow
- —
- DSCR
- —
- Eligible?
- —
Short-term bridge; refi at stabilization.
Rent comps 2 comps
| Address | Beds | Baths | Sqft | Rent | $/sqft | DOM | Units | Dist |
|---|---|---|---|---|---|---|---|---|
| 417 9th St NW Cedar Rapids, IA | 3.0 | 1.0 | 1061 | $1,300 | $1.23 | 43d | 1 | 1.20mi |
| 1001 C Ave NW Cedar Rapids, IA | 3.0 | 1.5 | 1446 | $1,500 | $1.04 | 13d | 1 | 1.23mi |
Listing history 13 events
-
2026-05-09status Pending
-
2026-05-08$164,900 Active
-
2019-06-24soldstatus $120,000
-
2019-06-24soldstatus $120,000
-
2019-06-24soldstatus $120,000
-
2019-06-21soldstatus $120,000 630-char remark
Show marketing remark (630 chars)
Check out this faboulous house close to Czech Village and Newbo! Well maintained, 4 bedroom and 2 full baths with good sized bedrooms and lots of storage. Relax knowing this home has newer HVAC and roof, updated windows and flooring. You wont have much to do because the home is painted with neutral colors throughout and updated appliances which all stay. Wood privacy fence surrounds a cute backyard and patio perfect for entertaining. The oversize 2 stall garage has tall garage doors, a lofty ceiling, lots of storage and even heat to keep you warm while working in the garage. There really is so much to love about this home!
-
2019-04-17$120,000 630-char remark
Show marketing remark (630 chars)
Check out this faboulous house close to Czech Village and Newbo! Well maintained, 4 bedroom and 2 full baths with good sized bedrooms and lots of storage. Relax knowing this home has newer HVAC and roof, updated windows and flooring. You wont have much to do because the home is painted with neutral colors throughout and updated appliances which all stay. Wood privacy fence surrounds a cute backyard and patio perfect for entertaining. The oversize 2 stall garage has tall garage doors, a lofty ceiling, lots of storage and even heat to keep you warm while working in the garage. There really is so much to love about this home!
-
2013-04-15soldstatus $94,000
-
2012-09-24soldstatus $74,000
-
2012-09-24soldstatus $74,000
-
2008-09-02soldstatus $80,000
-
2006-12-27soldstatus $54,000
-
2006-12-27soldstatus $79,000
ⓘ Source: listings_history table (triggers on properties + properties_extension) + one-shot
backfill from property_details.listing_events for pre-trigger history.
Tax reassessment forecast IA · Partial reset (capped growth)
- Current annual tax
- $2,420 · $202/mo
- Projected year-2 tax
- $2,504 · $209/mo
- Expected delta
- +$84/yr (+$7/mo · 3.5%)
ⓘ Screening estimate from a state-policy table — verify with the county assessor before closing.
Climate risk First Street
- Flood 6/10 Major FEMA zone X (unshaded) · 74% chance over 30 yrs
- Wildfire 1/10 Low
- Heat 3/10 Moderate 7 d/yr ≥103°F today · 15 d/yr by 30 yrs out
- Wind 2/10 Low
- Air quality 2/10 Low 0 unhealthy d/yr today · 1 by 30 yrs out
Nearby sold comps map
Loading sold comps map…
Walkable amenities ~0.75 mi
Loading nearby amenities…
Taxation est. · year 1
- Rental income
- $19,294
- − Mortgage interest
- −$9,237
- − Property taxes
- −$2,420
- − Insurance
- −$824
- − Repairs & maintenance
- −$1,544
- − Management
- −$1,544
- − Depreciation
- −$4,797
- Taxable loss
- −$1,072
- Est. tax savings @ 24.0%
- +$257
- After-tax cash flow
- $1,878/yr
For passive investors: Depreciation is non-cash, so a rental often shows a tax loss while cash-flowing — sheltering income. Rental losses are passive: they offset passive income freely, and up to $25,000/yr can offset ordinary (W-2) income if you actively participate and your MAGI is under $100k (phasing out to $0 by $150k); unused losses carry forward. On sale, claimed depreciation is recaptured at up to 25%, and gains may owe capital-gains tax (a 1031 exchange can defer both). Figures are a year-1 estimate at your 24.0% rate — not tax advice; consult a CPA.
Schools (NCES district)
- District
- Cedar Rapids Community School District
- NCES district ID
- 1906540
- Math proficiency
- 50% ▼ -12.00%
- Reading proficiency
- 59% ▼ -6.00%
- Median HH income
- $53,568
- Composite
- 46.82/100
- National rank
- #2378
- State rank
- #265 of 289 in IA
Livability — Cedar Rapids
- Score
- 78/100
- State rank
- #134
- US rank
- #2474
Category grades
Schools grade is shown separately in the Schools card above.
Census & demographics
- Census place
- Cedar Rapids, IA
- County
- Linn County · 179,860 people
- City population
- 137,154
- Metro
- Cedar Rapids, IA
- Population (ZIP)
- 42,958
- Household income
- $61,870
- Rent vs Own
- Severe rent burden
- 1041.0
Population outlook (Linn County) Hauer SSP2
- Today (2025)
- 239,589 people
- By 2030
- 248,587 · +3.8%
- By 2040
- 264,817 · +10.5%
- By 2050
- 278,685 · +16.3%
- By 2075
- 311,754 · +30.1%
- By 2100
- 336,773 · +40.6%
Race, ethnicity, and origin ACS 2023
- Neighborhood character
- Predominantly White (74%)
- Race & ethnicity
- White 74% Black 10% Two or more races 10% Hispanic / Latino 7%
- Hispanic origin (detail)
- Mexican 5%
- Common ancestry
- Portuguese 3% Lithuanian 2% Romanian 2%
- Foreign-born
- 8% · Canada
- Languages at home
- 90% English-only · Spanish 3% French/Haitian/Cajun 2% Other Asian/Pacific 1%
Political lean MEDSL · Linn
- 2024 margin
- Lean D (+9.9) · D 54.2% · R 44.3% · Other 1.4%
- 2008→2024 swing
- -11.6pp toward R · 2008: 21.5pp · 2024: 9.9pp
- All cycles
- 2024: D+9.9 2020: D+13.7 2016: D+9.0 2012: D+17.6 2008: D+21.5
Not yet ingested
- Civics
- —
Market trends
- HPI YoY
- ▼ -154.96%
- Current HPI
- 241.81
- Rent YoY
- ▲ 8.79%
- Metro
- Cedar Rapids, IA
- State GDP YoY
- ▲ 2.48%
- F500 in state
- 4
Industry mix (Fortune 500 HQ in IA)
| Industry | F500 HQs | Revenue |
|---|---|---|
| Financial Services | 1 | $16B |
|
||
| Retail / Convenience | 1 | $15B |
|
||
Price history
+205.4% since first listed13 events — show timeline
- 2026-05-09 Pending — CRAAR, CDRMLS
- 2026-05-08 Listed $164,900 CRAAR, CDRMLS
- 2019-06-24 Sold (Public Records) $120,000 Public Records
- 2019-06-24 Sold (Public Records) $120,000 Public Records
- 2019-06-24 Sold (Public Records) $120,000 Public Records
- 2019-06-21 Sold (MLS) $120,000 CRAAR, CDRMLS
- 2019-04-17 Listed $120,000 CRAAR, CDRMLS
- 2013-04-15 Sold (Public Records) $94,000 Public Records
- 2012-09-24 Sold (Public Records) $74,000 Public Records
- 2012-09-24 Sold (Public Records) $74,000 Public Records
- 2008-09-02 Sold (Public Records) $80,000 Public Records
- 2006-12-27 Sold (Public Records) $79,000 Public Records
- 2006-12-27 Sold (Public Records) $54,000 Public Records
Property tax history
+4.3%/yrLatest (2025): $2,420 · +8.2% YoY. Source: county tax records.
Cash-flow waterfall
monthlySold comps — $/sqft
last 12 mo · ≤1 miLoading sold comps…