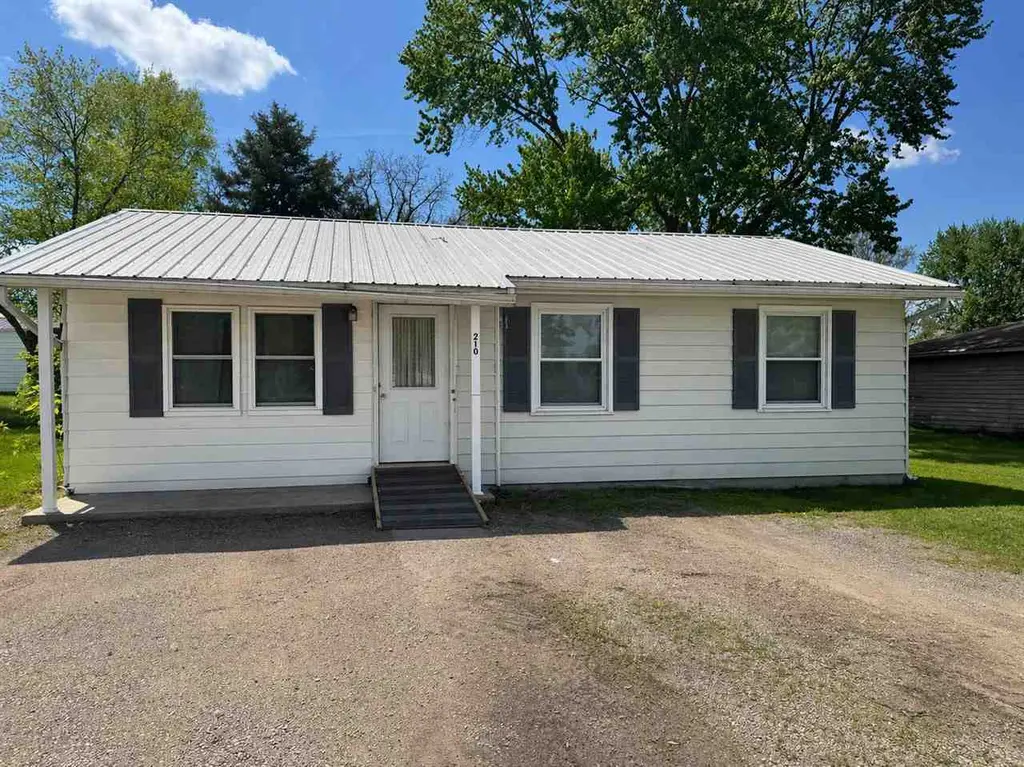
210 W Lincoln St · Geneva, IN
Flood risk 1/10 · Minimal
- FEMA flood zone
- X (unshaded)
- Chance of flooding over 30 yrs
- 0.0%
- Est. flood insurance / yr
- $507 – $1,088
Fire risk 1/10 · Minimal
- Est. fire insurance / yr
- $717 – $1,331
Heat risk 3/10 · Minor
- Hot days now (above 100°F)
- 7 days/yr
- Hot days in 30 yrs
- 18 days/yr
Wind risk 2/10 · Minimal
- Chance of severe wind over 30 yrs
- —
Air-quality risk 3/10 · Minor
- Unhealthy air days now
- 2 days/yr
- Unhealthy air days in 30 yrs
- 3 days/yr
Risk factors via First Street. Map © Google.
Why this score? — see what drove the C- grade
The composite is a weighted blend of 9 inputs, each scored 0–100. Each bar is that input's sub-score; the figure is the points it added to the 100-point composite (weight × sub-score).
- ARV discount +14.2/15.0
- Cash flow +11.1/30.0
- Appreciation +8.1/10.0
- Schools +3.9/10.0
- Livability +3.7/5.0
- DSCR +3.2/10.0
- 1% rule +2.5/10.0
- Rent growth +2.5/5.0
- Condition / age +2.5/5.0
$115,000
🖨 Deal sheet 📄 Offer letter ✓ Due diligence
Listing remarks
Charming 2-bedroom, 1-bath home offering 864 sq ft of living space on a 6,098 sq ft lot in Geneva, IN. Currently tenant-occupied, this property provides immediate income potential and a functional, easy-to-maintain layout. The home features a metal roof installed within the last few years and a newer water heater, helping reduce near-term maintenance concerns. With a straightforward floor plan and manageable size, the property offers potential for light cosmetic updates to enhance overall appeal. Located in a quiet area with consistent housing demand, this home presents an opportunity for buyers seeking a property with flexibility and long-term potential. Whether for personal use or as an i
Key facts
- Metal roof
- Income potential
- Newer water heater
Tags
Property features AI
Exterior
- Parking: Gravel parking
- Utilities: Public water; Public sewer
- Home design: Single-family residential home; Single story
- Exterior features: Metal roof
Interior
- Bathrooms: 1 full bathroom
- Heating & cooling: Electric heating; Window air conditioning units
- Interior features: Crawl space basement
Neighborhood map
What this means for you Summary
Snapshot
- This is a 2-bed/1.0-bath single-family listed at $115k.
Deal economics
- At list price, monthly cash flow is $-47 ($-566/yr) — negative.
- To cash-flow at today's rent, offer at most $107k (7.2% below list).
- To meet the 1% rule (rent ≥ 1% of price), the offer needs to be $86k (25.5% below list).
- Recommended offer: $86k (25.5% below list) — sets the bar for 1% rule.
Location & tenants
- Location reads 73/100 on livability (#103 in IN) — a middle-class / working-renter tenant base. Strengths: crime A+, cost of living A+, housing A+; Watch: schools F, amenities F, commute F.
- South Adams Schools (town): math 50% / reading 43% proficiency, ranked #92 of 301 in IN (top 31%) — families likely to look elsewhere, expect single-tenant / working-renter base with shorter leases.
- Market conditions: 7 active listings in the ZIP; 78 units permitted in Adams County in 2024 (0 in 5+ unit buildings).
Forward outlook
- In year one you build about $8k of equity ($795 loan paydown + $7k appreciation (6.2% local appreciation)).
- Adams County population projected at -13% by 2050 — secular population decline; favor cash flow + early exit over multi-decade hold.
- At projected returns (6.2% appreciation + 3.0% rent growth), your $32k cash investment doubles in ~4 years — after that, you're playing with house money.
- By year 5, paydown + projected appreciation supports a ~$35k cash-out refi (75% LTV) — recoverable capital for the next deal without selling this one.
Negotiation context
- It's been on market 55 days — a 3% lower offer ($112k) is reasonable based on typical stale-listing flexibility.
- 2 sale attempts since 7y ago with the ask held roughly flat each time — persistent listings suggest the price (not the market) is what's stuck; bring a comps-based counter.
Questions for the listing agent
- What do current leases actually rent for vs. the listed asking? Can we see a recent rent roll and the last 12 months of T-12 income?
- It's been on market 55 days. Have you received any prior offers? Is the seller open to a 25% concession, seller financing, or rate buy-down credit?
- Built in 1965 — when were the roof, HVAC, electrical panel, plumbing, and water heater last replaced?
- Is there a deadline driving the sale (1031 exchange, divorce, estate, relocation)? That informs how much negotiation room exists.
- Schools are F-rated, which usually means shorter tenancies and higher turnover. Who's the typical renter profile here, and what's been the actual vacancy rate?
- What's the average days-on-market for RENTAL listings here right now (not sales)? A rising rental-DOM trend means longer vacancies and softer asking-rent achievability than the comps imply.
- What's the recent tenant-quality profile in this submarket — average credit score on applications, eviction rate, late-payment / NSF rate, and stable-employment percentage? A property-management company in the area should have these aggregated.
- How much new for-sale + rental construction is in the pipeline within 1–3 miles? Heavy new supply typically softens prices + rents 12–24 months out; constrained supply supports both.
Investment metrics
- 1% rule
- 0.75% ✗
- Cap rate
- 5.80%
- Cash-on-cash
- -1.76%
- DSCR
- 0.92
- GRM
- 11.2
CMA / ARV
- ARV (median comp)
- $135,080
- List price
- $115,000
- Delta
- -14.87%
- Verdict
- UNDERPRICED
- Comps
- 14 within 1.0 mi
Show comp detail 2 sales within ~0.75 mi
| Address | Dist | Beds/Ba | Sqft | Sold | Price | $/sf | Match |
|---|---|---|---|---|---|---|---|
| 315 W Butcher St | 0.12mi | 1/1.0 (-1) | 757 (-12%) | 11mo | $95,000 | $125 | 59 |
| 120 Holly Ln | 0.46mi | 3/1.0 (+1) | 960 (+11%) | 22mo | $135,000 | $141 | 36 |
Match score weights: distance 35% · size 25% · config 20% · recency 20%. Top-matched comps best support the ARV.
Projected returns pro-forma
6.19% appreciation · 3.0% rent growth · sell at horizon
- IRR
- 14.4%
- Equity multiple
- 1.98×
- Total profit
- $31,432
- Equity at exit
- $73,640
- IRR
- 14.6%
- Equity multiple
- 3.93×
- Total profit
- $94,426
- Equity at exit
- $134,719
Cash invested: $32,200 (down + closing). Projections, not guarantees.
Landlord ↔ Tenant lean methodology
- Overall (STATE)
- 90 Strongly Landlord-Friendly
- State Indiana
- 90 Strongly Landlord-Friendly · R+11
- County
- — inherits STATE
- City
- — inherits STATE
ZIP-level market 46740
- Home prices YoY
- 2.5%
- Active inventory
- 7
- Price-to-rent
- 11.2×
Monthly cashflow live
- Estimated rent
- $857 medium interval (Pro) →
- Mortgage (P&I)
- −$603
- Tax from tax record
- −$73 /mo · $880/yr
- Insurance
- −$48
- HOA
- −$0
- Vacancy / Maint / Mgmt
- −$180
- Net cashflow
- $-47
Break-even live
UW: 25.0% down · 7.5% · 30yr · 1.5% tax · 5.0% vac · 8.0% maint · 8.0% mgmt
Financing live
Cash to close
- Down payment
- $28,750
- Closing costs
- $3,450
- Reserves months
- —
- Total cash needed
- —
Loan-product check · same deal, 3 products live
Conventional
25% down · 7.5% · 30yr
- Down + closing
- —
- Monthly P&I
- —
- Monthly cashflow
- —
- DSCR
- —
- Eligible?
- —
Personal DTI + credit; lowest rate.
DSCR
20% down · 8.5% · 30yr
- Down + closing
- —
- Monthly P&I
- —
- Monthly cashflow
- —
- DSCR
- —
- Eligible?
- —
No personal income docs; deal must DSCR.
Hard money
10% down · 12.0% · 12mo
- Down + closing
- —
- Monthly P&I
- —
- Monthly cashflow
- —
- DSCR
- —
- Eligible?
- —
Short-term bridge; refi at stabilization.
Listing history 17 events
-
2026-06-18days on market $115,000 Active 55 DOM
-
2026-06-17days on market $115,000 Active 54 DOM
-
2026-06-16days on market $115,000 Active 53 DOM
-
2026-06-15days on market $115,000 Active 52 DOM
-
2026-06-13days on market $115,000 Active 50 DOM
-
2026-06-12days on market $115,000 Active 49 DOM
-
2026-06-09days on market $115,000 Active 46 DOM
-
2026-06-08days on market $115,000 Active 45 DOM
-
2026-06-07days on market $115,000 Active 44 DOM
-
2026-06-05days on market $115,000 Active 42 DOM
-
2026-06-04days on market $115,000 Active 40 DOM
-
2026-06-02days on market $115,000 Active 39 DOM
-
2026-06-01days on market $115,000 Active 38 DOM
-
2026-05-31days on market $115,000 Active 37 DOM
-
2026-05-31days on market $115,000 Active 36 DOM
-
2026-04-24$115,000 Active 1120-char remark
-
2019-06-20$55,000
ⓘ Source: listings_history table (triggers on properties + properties_extension) + one-shot
backfill from property_details.listing_events for pre-trigger history.
Tax reassessment forecast IN · Partial reset (capped growth)
- Current annual tax
- $880 · $73/mo
- Projected year-2 tax
- $929 · $77/mo
- Expected delta
- +$49/yr (+$4/mo · 5.5%)
ⓘ Screening estimate from a state-policy table — verify with the county assessor before closing.
Climate risk First Street
- Flood 1/10 Low FEMA zone X (unshaded) · 0% chance over 30 yrs
- Wildfire 1/10 Low
- Heat 3/10 Moderate 7 d/yr ≥100°F today · 18 d/yr by 30 yrs out
- Wind 2/10 Low
- Air quality 3/10 Moderate 2 unhealthy d/yr today · 3 by 30 yrs out
Nearby sold comps map
Loading sold comps map…
Walkable amenities ~0.75 mi
Loading nearby amenities…
Taxation est. · year 1
- Rental income
- $10,286
- − Mortgage interest
- −$6,442
- − Property taxes
- −$880
- − Insurance
- −$575
- − Repairs & maintenance
- −$823
- − Management
- −$823
- − Depreciation
- −$3,345
- Taxable loss
- −$2,602
- Est. tax savings @ 24.0%
- +$625
- After-tax cash flow
- $58/yr
For passive investors: Depreciation is non-cash, so a rental often shows a tax loss while cash-flowing — sheltering income. Rental losses are passive: they offset passive income freely, and up to $25,000/yr can offset ordinary (W-2) income if you actively participate and your MAGI is under $100k (phasing out to $0 by $150k); unused losses carry forward. On sale, claimed depreciation is recaptured at up to 25%, and gains may owe capital-gains tax (a 1031 exchange can defer both). Figures are a year-1 estimate at your 24.0% rate — not tax advice; consult a CPA.
Schools (NCES district)
- District
- South Adams Schools
- NCES district ID
- 1810260
- Math proficiency
- 50% ▼ -7.00%
- Reading proficiency
- 43% ▼ -7.00%
- Median HH income
- $42,024
- Composite
- 39.16/100
- National rank
- #4029
- State rank
- #92 of 301 in IN
Livability — Geneva
- Score
- 73/100
- State rank
- #103
- US rank
- #5517
Category grades
Schools grade is shown separately in the Schools card above.
Census & demographics
- Census place
- Geneva, IN
- Population (ZIP)
- 4,766
Population outlook (Adams County) Hauer SSP2
- Today (2025)
- 33,772 people
- By 2030
- 32,927 · -2.5%
- By 2040
- 31,349 · -7.2%
- By 2050
- 29,447 · -12.8%
- By 2075
- 24,062 · -28.8%
- By 2100
- 18,126 · -46.3%
Race, ethnicity, and origin ACS 2023
- Neighborhood character
- Predominantly White (94%)
- Race & ethnicity
- White 94% Hispanic / Latino 4% Two or more races 2%
- Common ancestry
- Polish 2% Lithuanian 1%
- Foreign-born
- 2% · Canada
- Languages at home
- 51% English-only · German/W. Germanic 46% Spanish 3%
Political lean MEDSL · Adams
- 2024 margin
- Solid R (+52.6) · D 22.8% · R 75.4% · Other 1.8%
- 2008→2024 swing
- -26.9pp toward R · 2008: -25.7pp · 2024: -52.6pp
- All cycles
- 2024: R+52.6 2020: R+52.4 2016: R+52.5 2012: R+39.5 2008: R+25.7
Not yet ingested
- Civics
- —
Market trends
- HPI YoY
- ▲ 6.19%
- Current HPI
- 250.9013
- Rent YoY
- —
- Metro
- —
- State GDP YoY
- ▲ 2.90%
- F500 in state
- 18
Industry mix (Fortune 500 HQ in IN)
| Industry | F500 HQs | Revenue |
|---|---|---|
| Industrial Machinery | 2 | $37B |
|
||
| Healthcare | 1 | $177B |
|
||
| Pharmaceuticals | 1 | $45B |
|
||
| Metals / Steel | 1 | $18B |
|
||
| Agriculture | 1 | $17B |
|
||
| Packaging | 1 | $12B |
|
||
Price history
+109.1% since first listed2 events — show timeline
- 2026-04-24 Listed $115,000 RRELMS
- 2019-06-20 Listed $55,000 IRMLS
Property tax history
-0.9%/yrLatest (2024): $880 · +5.5% YoY. Source: county tax records.
Cash-flow waterfall
monthlySold comps — $/sqft
last 12 mo · ≤1 miLoading sold comps…