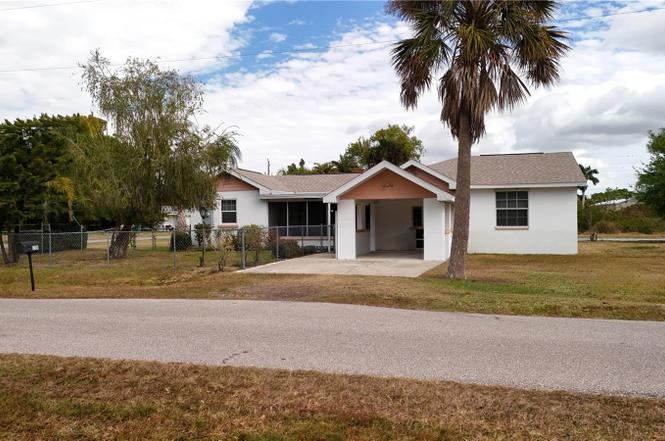
6386 Scott St · Solana, FL
Flood risk 9/10 · Severe
- FEMA flood zone
- AE
- Chance of flooding over 30 yrs
- 0.99%
- Est. flood insurance / yr
- $1,737 – $8,500
Fire risk 1/10 · Minimal
- Est. fire insurance / yr
- $947 – $1,759
Heat risk 10/10 · Severe
- Hot days now (above 107°F)
- 7 days/yr
- Hot days in 30 yrs
- 28 days/yr
Wind risk 10/10 · Severe
- Chance of severe wind over 30 yrs
- 99.0%
Air-quality risk 3/10 · Minor
- Unhealthy air days now
- 2 days/yr
- Unhealthy air days in 30 yrs
- 2 days/yr
Risk factors via First Street. Map © Google.
Why this score? — see what drove the B- grade
The composite is a weighted blend of 9 inputs, each scored 0–100. Each bar is that input's sub-score; the figure is the points it added to the 100-point composite (weight × sub-score).
- Cash flow +26.0/30.0
- ARV discount +15.0/15.0
- DSCR +8.7/10.0
- 1% rule +5.6/10.0
- Schools +4.6/10.0
- Livability +3.7/5.0
- Rent growth +2.5/5.0
- Condition / age +2.5/5.0
- Appreciation +0.0/10.0
$264,900
🖨 Deal sheet 📄 Offer letter ✓ Due diligence
Listing remarks
One or more photo(s) has been virtually staged. Opportunity knocks with this three-bedroom, two-bath block home situated on Lots 1, 2, and 3 of the Lavilla subdivision, totaling approximately 0.48 acres. The property is located just minutes from historic downtown Punta Gorda with easy access to I-75 and PGD Airport, which offers nonstop commercial air service. August 2024 updates include new vinyl flooring in the living room and hallway and a new AC system. A new shingle roof was installed in March 2023. The living room features a fireplace, and the front porch is enclosed with screening. A large screened porch at the rear of the home provides additional outdoor living space. The spacious p
Key facts
- New ac system
- New shingle roof
- New vinyl flooring
Tags
Property features AI
Finance
- Other: Property type: Residential — Single Family Residence; Zoning: MHC; Total living area reported as 1,767 sq ft (public records); Total acreage listed as 1/4 to less than 1/2 acre
- HOA & community: No homeowners association
Exterior
- Parking: Carport (1 space)
- Utilities: Public water; Septic tank sewer; Electricity connected; Broadband/high-speed internet available
- Home design: Single family residence; One story; Entry level: One
- Construction: Block construction; Shingle roof; Slab foundation; Building area approx. 2,529 sq ft
- Exterior features: Paved public road access; Lot approximately 0.48 acres (150 x 140); Faces west
Interior
- Kitchen: Refrigerator; Electric water heater
- Bedrooms: 2 bedrooms
- Flooring: Vinyl flooring
- Bathrooms: 2 full bathrooms
- Heating & cooling: Electric heating; Central air conditioning
- Interior features: Fireplace in the living room; 5 total rooms
- Laundry & utility: Washer; Dryer; Laundry located inside
Neighborhood map
What this means for you Summary
Snapshot
- This is a 2-bed/2.0-bath single-family listed at $265k.
Deal economics
- At list price, monthly cash flow is $233 ($3k/yr) — positive.
- The deal already cash-flows at list — no discount required.
- Meets the 1% rule at list price ($3k rent vs $265k).
- Recommended offer: $241k (9.0% below list) — sets the bar for market timing.
Location & tenants
- Location reads 74/100 on livability (#287 in FL, #4,731 nationally) — a middle-class / working-renter tenant base. Strengths: crime A+, cost of living A+, housing A+; Watch: employment D+, amenities F, commute F.
- Charlotte (suburban): math 54% / reading 54% proficiency, ranked #22 of 73 in FL (top 30%) — acceptable for families but not a draw, mixed tenant base, ~2y average lease.
- Zoned schools: Sallie Jones Elementary School (math 75% / reading 74%, grade A, #230 of 2,144 statewide, top 12%, 694 students, 47% FRL); Charlotte High School (math 44% / reading 46%, grade D-, #228 of 667 statewide, top 35%, 1,994 students, 41% FRL).
- Market conditions: Rents soft (-0.1%/yr); 999 active listings in the ZIP; 7 comparable units currently listed for rent nearby; rentals at typical pace (median 21d on market — plan ~3-4 weeks tenant-placement turnaround); solid renter incomes; 4,585 units permitted in Charlotte County in 2024 (703 in 5+ unit buildings).
- This rent runs 44% of the median local income ($76k/yr) — at the standard rent-burdened threshold; future hikes will face affordability resistance.
Forward outlook
- Local home prices are declining (-3.0%/yr); year-one equity from $2k of loan paydown is wiped out by about $8k of value loss. Plan a longer hold.
- Charlotte County population projected at +24% by 2050 — long-run rental-demand tailwind backs the buy-and-hold thesis.
Negotiation context
- It's been on market 120 days — a 9% lower offer ($241k) is reasonable based on typical stale-listing flexibility.
- Current owner paid $200k; 32% above their basis — modest negotiation headroom, anchor on the comps not their cost.
Risks & watch-outs
- Watch-outs: flood insurance adds $427/mo; built in 1950 — expect roof / HVAC / electrical / plumbing capex.
- Climate carrying-cost: in FEMA flood zone AE (mandatory federal flood insurance); severe wind risk, 99% chance of damaging wind over 30y; extreme-heat days projected 7→28/yr by 2055 (HVAC capex compounding) — expect insurance premiums to compound above CPI over the hold.
Questions for the listing agent
- It's been on market 120 days. Have you received any prior offers? Is the seller open to a 9% concession, seller financing, or rate buy-down credit?
- Built in 1950 — when were the roof, HVAC, electrical panel, plumbing, and water heater last replaced?
- What's the actual annual flood-insurance premium (NFIP or private), and is the property in a SFHA with mandatory coverage?
- Why hasn't it sold? Are there any deal-killer items the seller is aware of (foundation, flood, title, zoning, code violations)?
- Is there a deadline driving the sale (1031 exchange, divorce, estate, relocation)? That informs how much negotiation room exists.
- Schools are F-rated, which usually means shorter tenancies and higher turnover. Who's the typical renter profile here, and what's been the actual vacancy rate?
- What's the average days-on-market for RENTAL listings here right now (not sales)? A rising rental-DOM trend means longer vacancies and softer asking-rent achievability than the comps imply.
- What's the recent tenant-quality profile in this submarket — average credit score on applications, eviction rate, late-payment / NSF rate, and stable-employment percentage? A property-management company in the area should have these aggregated.
- How much new for-sale + rental construction is in the pipeline within 1–3 miles? Heavy new supply typically softens prices + rents 12–24 months out; constrained supply supports both.
Investment metrics
- 1% rule
- 1.06% ✓
- Cap rate
- 9.28%
- Cash-on-cash
- 10.66%
- DSCR
- 1.47
- GRM
- 7.9
CMA / ARV
- ARV (on-the-fly)
- $385,206
- Comps found
- 2
Show comp detail 2 sales within ~0.75 mi
| Address | Dist | Beds/Ba | Sqft | Sold | Price | $/sf | Match |
|---|---|---|---|---|---|---|---|
| 7041 W Lenox Cir | 0.73mi | 2/2.0 | 1,516 (-14%) | 5mo | $250,000 | $165 | 38 |
| 25016 E Lenox Cir | 0.72mi | 2/2.0 | 1,516 (-14%) | 19mo | $329,975 | $218 | 26 |
Match score weights: distance 35% · size 25% · config 20% · recency 20%. Top-matched comps best support the ARV.
Projected returns pro-forma
-3.0% appreciation · 0.0% rent growth · sell at horizon
- IRR
- -14.0%
- Equity multiple
- 0.51×
- Total profit
- $-36,196
- Equity at exit
- $39,497
- IRR
- -11.5%
- Equity multiple
- 0.41×
- Total profit
- $-43,650
- Equity at exit
- $22,904
Cash invested: $74,172 (down + closing). Projections, not guarantees.
Landlord ↔ Tenant lean methodology
- Overall (STATE)
- 87 Strongly Landlord-Friendly
- State Florida
- 87 Strongly Landlord-Friendly · R+3
- County
- — inherits STATE
- City
- — inherits STATE
ZIP-level market 33950
- Home prices YoY
- -29.9%
- Rents YoY
- -0.1%
- Active inventory
- 999
- Price-to-rent
- 7.9×
Monthly cashflow live
- Estimated rent
- $2,803 high interval (Pro) →
- Mortgage (P&I)
- −$1,389
- Tax from tax record
- −$56 /mo · $673/yr
- Insurance
- −$110
- Flood insurance flood zone
- −$427 /mo · $5,118/yr
- HOA
- −$0
- Vacancy / Maint / Mgmt
- −$589
- Net cashflow
- $233
Break-even live
UW: 25.0% down · 7.5% · 30yr · 1.5% tax · 5.0% vac · 8.0% maint · 8.0% mgmt
Financing live
Cash to close
- Down payment
- $66,225
- Closing costs
- $7,947
- Reserves months
- —
- Total cash needed
- —
Loan-product check · same deal, 3 products live
Conventional
25% down · 7.5% · 30yr
- Down + closing
- —
- Monthly P&I
- —
- Monthly cashflow
- —
- DSCR
- —
- Eligible?
- —
Personal DTI + credit; lowest rate.
DSCR
20% down · 8.5% · 30yr
- Down + closing
- —
- Monthly P&I
- —
- Monthly cashflow
- —
- DSCR
- —
- Eligible?
- —
No personal income docs; deal must DSCR.
Hard money
10% down · 12.0% · 12mo
- Down + closing
- —
- Monthly P&I
- —
- Monthly cashflow
- —
- DSCR
- —
- Eligible?
- —
Short-term bridge; refi at stabilization.
Rent comps 7 comps
| Address | Beds | Baths | Sqft | Rent | $/sqft | DOM | Units | Dist |
|---|---|---|---|---|---|---|---|---|
| 900 E Marion Ave #1213 Punta Gorda, FL | 3.0 | 2.0 | 1647 | $4,000 | $2.43 | 21d | 1 | 0.43mi |
| 309 E Virginia Ave Punta Gorda, FL | 3.0 | 3.5 | 1344 | $3,000 | $2.23 | 21d | 1 | 0.45mi |
| 200 Harbor Walk Dr #321 Punta Gorda, FL | 3.0 | 2.0 | 2172 | $3,400 | $1.57 | 21d | 1 | 0.70mi |
| 150 Harborside Ave Punta Gorda, FL | 1.0–2.0 | 1.0–2.0 | 967 | $1,600 | $1.65 | 21d | 3 | 0.94mi |
| 240 W End Dr #611 Punta Gorda, FL | 2.0 | 2.0 | 1306 | $1,675 | $1.28 | 21d | 1 | 1.45mi |
| 601 Shreve St Punta Gorda, FL | 2.0 | 2.0 | 1396 | $3,500 | $2.51 | 21d | 3 | 1.45mi |
| 255 W End Dr Punta Gorda, FL | 2.0–3.0 | 2.0 | 1559 | $2,800 | $1.80 | 21d | 3 | 1.48mi |
Listing history 20 events
-
2026-06-18days on market $264,900 Active 120 DOM
-
2026-06-17days on market $264,900 Active 119 DOM
-
2026-06-16days on market $264,900 Active 118 DOM
-
2026-06-15days on market $264,900 Active 117 DOM
-
2026-06-14days on market $264,900 Active 115 DOM
-
2026-06-13days on market $264,900 Active 114 DOM
-
2026-06-10days on market $264,900 Active 112 DOM
-
2026-06-09days on market $264,900 Active 111 DOM
-
2026-06-08days on market $264,900 Active 110 DOM
-
2026-06-07days on market $264,900 Active 109 DOM
-
2026-06-05days on market $264,900 Active 106 DOM
-
2026-06-03days on market $264,900 Active 105 DOM
-
2026-06-02days on market $264,900 Active 104 DOM
-
2026-06-01days on market $264,900 Active 103 DOM
-
2026-05-31days on market $264,900 Active 102 DOM
-
2026-05-30days on market $264,900 Active 101 DOM
-
2026-05-07price $264,900
-
2026-02-18$275,000 Active
-
2025-10-23soldstatus $200,000
-
1991-10-01soldstatus $50,000
ⓘ Source: listings_history table (triggers on properties + properties_extension) + one-shot
backfill from property_details.listing_events for pre-trigger history.
Tax reassessment forecast FL · Resets to sale price
- Current annual tax
- $673 · $56/mo
- Projected year-2 tax
- $2,199 · $183/mo
- Expected delta
- +$1,526/yr (+$127/mo · 226.9%)
ⓘ Screening estimate from a state-policy table — verify with the county assessor before closing.
Climate risk First Street
- Flood 9/10 Extreme FEMA zone AE · 99% chance over 30 yrs
- Wildfire 1/10 Low
- Heat 10/10 Extreme 7 d/yr ≥107°F today · 28 d/yr by 30 yrs out
- Wind 10/10 Extreme 99% chance of damaging wind over 30 yrs
- Air quality 3/10 Moderate 2 unhealthy d/yr today · 2 by 30 yrs out
Nearby sold comps map
Loading sold comps map…
Walkable amenities ~0.75 mi
Loading nearby amenities…
Taxation est. · year 1
- Rental income
- $33,640
- − Mortgage interest
- −$14,839
- − Property taxes
- −$673
- − Insurance
- −$6,443
- − Repairs & maintenance
- −$2,691
- − Management
- −$2,691
- − Depreciation
- −$7,706
- Taxable loss
- −$1,403
- Est. tax savings @ 24.0%
- +$337
- After-tax cash flow
- $3,127/yr
For passive investors: Depreciation is non-cash, so a rental often shows a tax loss while cash-flowing — sheltering income. Rental losses are passive: they offset passive income freely, and up to $25,000/yr can offset ordinary (W-2) income if you actively participate and your MAGI is under $100k (phasing out to $0 by $150k); unused losses carry forward. On sale, claimed depreciation is recaptured at up to 25%, and gains may owe capital-gains tax (a 1031 exchange can defer both). Figures are a year-1 estimate at your 24.0% rate — not tax advice; consult a CPA.
Schools (NCES district)
- District
- Charlotte
- NCES district ID
- 1200240
- Math proficiency
- 54% ▼ -6.00%
- Reading proficiency
- 54% ▼ -1.00%
- Median HH income
- $44,864
- Composite
- 45.62/100
- National rank
- #2586
- State rank
- #22 of 73 in FL
Livability — Solana
- Score
- 74/100
- State rank
- #287
- US rank
- #4731
Category grades
Schools grade is shown separately in the Schools card above.
Census & demographics
- Census place
- Solana, FL
- County
- Charlotte County · 196,994 people
- City population
- 68,831
- Metro
- Punta Gorda, FL
- Population (ZIP)
- 24,955
- Household income
- $76,369
- Rent vs Own
- Severe rent burden
- 608.0
Population outlook (Charlotte County) Hauer SSP2
- Today (2025)
- 198,646 people
- By 2030
- 210,507 · +6.0%
- By 2040
- 230,857 · +16.2%
- By 2050
- 247,148 · +24.4%
- By 2075
- 281,777 · +41.8%
- By 2100
- 293,609 · +47.8%
Race, ethnicity, and origin ACS 2023
- Neighborhood character
- Predominantly White (86%)
- Race & ethnicity
- White 86% Two or more races 5% Black 5% Hispanic / Latino 4% Asian 1%
- Common ancestry
- Lithuanian 5% Romanian 4% Italian 2%
- Foreign-born
- 7% · Canada
- Languages at home
- 95% English-only · Spanish 3% Other Indo-European 1% German/W. Germanic 1%
Political lean MEDSL · Charlotte
- 2024 margin
- Solid R (+34.0) · D 32.7% · R 66.7%
- 2008→2024 swing
- -26.7pp toward R · 2008: -7.2pp · 2024: -34.0pp
- All cycles
- 2024: R+34.0 2020: R+26.6 2016: R+27.8 2012: R+14.3 2008: R+7.2
Not yet ingested
- Civics
- —
Market trends
- HPI YoY
- ▼ -111.73%
- Current HPI
- 261.6573
- Rent YoY
- ▼ -0.06%
- Metro
- Punta Gorda, FL
- State GDP YoY
- ▲ 3.28%
- F500 in state
- 36
Industry mix (Fortune 500 HQ in FL)
| Industry | F500 HQs | Revenue |
|---|---|---|
| Industrial Technology | 2 | $29B |
|
||
| Insurance | 2 | $17B |
|
||
| Retail | 1 | $60B |
|
||
| Technology Distribution | 1 | $58B |
|
||
| Homebuilding | 1 | $35B |
|
||
| Technology Manufacturing | 1 | $35B |
|
||
Price history
+429.8% since first listed4 events — show timeline
- 2026-05-07 Price Changed $264,900 Stellar MLS as Distributed by MLS Grid
- 2026-02-18 Listed $275,000 Stellar MLS as Distributed by MLS Grid
- 2025-10-23 Sold (Public Records) $200,000 Public Records
- 1991-10-01 Sold (Public Records) $50,000 Public Records
Property tax history
+1.9%/yrLatest (2025): $673 · -15.9% YoY. Source: county tax records.
Cash-flow waterfall
monthlySold comps — $/sqft
last 12 mo · ≤1 miLoading sold comps…