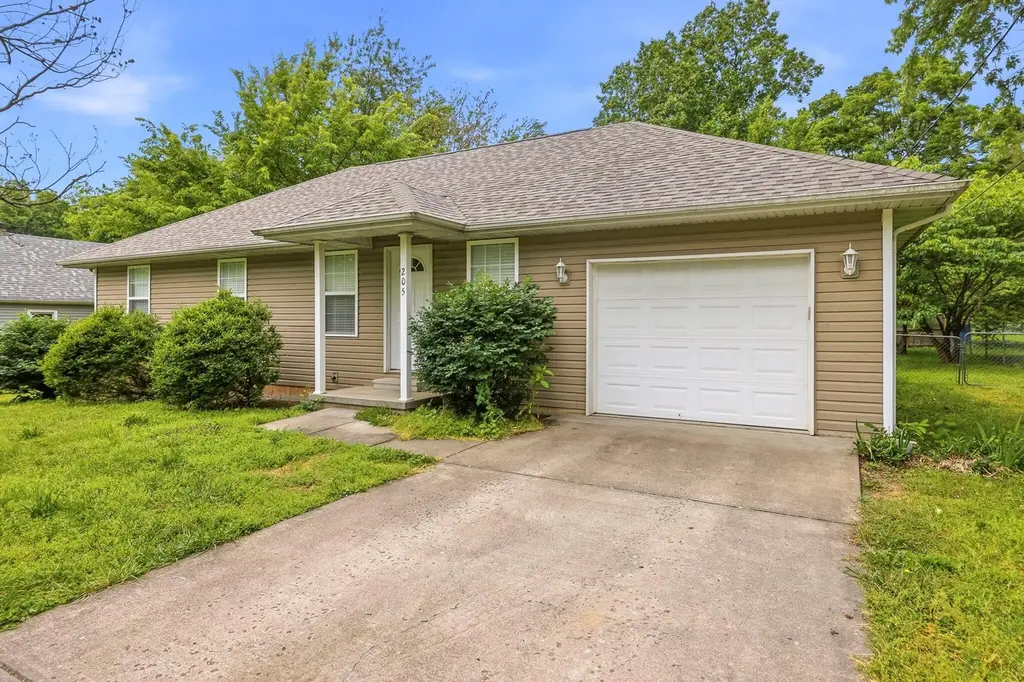
205 South St · Willard, MO
Flood risk 1/10 · Minimal
- FEMA flood zone
- X (unshaded)
- Chance of flooding over 30 yrs
- 0.0%
- Est. flood insurance / yr
- $507 – $1,088
Fire risk 4/10 · Minor
- Est. fire insurance / yr
- $1,054 – $1,958
Heat risk 5/10 · Moderate
- Hot days now (above 105°F)
- 7 days/yr
- Hot days in 30 yrs
- 20 days/yr
Wind risk 2/10 · Minimal
- Chance of severe wind over 30 yrs
- 1.0%
Air-quality risk 1/10 · Minimal
- Unhealthy air days now
- 0 days/yr
- Unhealthy air days in 30 yrs
- 0 days/yr
Risk factors via First Street. Map © Google.
Why this score? — see what drove the D grade
The composite is a weighted blend of 9 inputs, each scored 0–100. Each bar is that input's sub-score; the figure is the points it added to the 100-point composite (weight × sub-score).
- Cash flow +13.7/30.0
- ARV discount +8.9/15.0
- DSCR +4.1/10.0
- Schools +3.9/10.0
- Livability +3.7/5.0
- 1% rule +3.0/10.0
- Rent growth +2.5/5.0
- Condition / age +2.5/5.0
- Appreciation +0.0/10.0
$219,900
🖨 Deal sheet (PDF) 📄 Offer letter ✓ Due diligence
Listing remarks
NOW REDUCED! Great opportunity in Willard! This 3 bedroom, 2 full bath home has a brand new architectural roof and has been refreshed throughout! You will love this handy location which is walking distance to everything ''downtown'' Willard. Schools, trails, great restaurants and much more just around the corner from this home! All kitchen appliances included and this home should not have any trouble qualifying for a number of types of financing. Come take a look!!
Key facts
- 8,712 sq ft lot
- Garage
- Built 2007
Tags
Property features AI
Exterior
- Parking: Detached garage facing the front with 1 garage space
- Utilities: Public water; Public sewer
- Home design: Single family residence; One story
- Construction: Vinyl siding; Permanent foundation; Composition roof; Built as residential single family
- Exterior features: Deck; Asphalt road frontage on a public maintained city street
Interior
- Kitchen: Electric oven; Free-standing electric oven; Dishwasher; Microwave; Refrigerator
- Bathrooms: 2 full bathrooms
- Heating & cooling: Central air conditioning; Natural gas heating; Forced air heating; Central heating
- Interior features: Insulated windows with blinds and other window coverings; Double-pane windows; Deck access (patio/porch)
- Laundry & utility: Laundry on main level
Neighborhood map
What this means for you Summary
Snapshot
- This is a 3-bed/2.0-bath single-family listed at $220k.
Deal economics
- At list price, monthly cash flow is $17 ($206/yr) — positive.
- The deal already cash-flows at list — no discount required.
- To meet the 1% rule (rent ≥ 1% of price), the offer needs to be $176k (19.8% below list).
- Recommended offer: $176k (19.8% below list) — sets the bar for 1% rule.
- Cap rate 6.4% vs local median 3.5% in Willard — top-decile yield for the area; either an underpriced asset or a hidden risk that comps aren't pricing in. Stress-test before assuming the spread holds.
Location & tenants
- Location reads 73/100 on livability (#79 in MO) — a middle-class / working-renter tenant base. Strengths: cost of living A+, housing A+, crime A; Watch: amenities F, commute F, health & safety F.
- Willard R-II (rural): math 41% / reading 50% proficiency, ranked #83 of 324 in MO (top 26%) — families likely to look elsewhere, expect single-tenant / working-renter base with shorter leases.
- Zoned schools: Willard North Elem. (math 27% / reading 42%, grade F, #676 of 1,115 statewide, top 66%, 332 students, 42% FRL); Willard Middle (math 43% / reading 48%, grade D+, #105 of 391 statewide, top 27%, 741 students, 32% FRL); Willard High (math 37% / reading 60%, grade D, #147 of 521 statewide, top 29%, 1,381 students, 29% FRL) — zoned schools at 34% FRL track the district average.
- Market conditions: 93 active listings in the ZIP; 3 comparable units currently listed for rent nearby; rentals at typical pace (median 16d on market — plan ~3-4 weeks tenant-placement turnaround); 1,302 units permitted in Greene County in 2024 (250 in 5+ unit buildings).
Forward outlook
- Local home prices are declining (-3.0%/yr); year-one equity from $2k of loan paydown is wiped out by about $7k of value loss. Plan a longer hold.
- Greene County population projected at +25% by 2050 — long-run rental-demand tailwind backs the buy-and-hold thesis.
Negotiation context
- It's been on market 16 days — a 2% lower offer ($217k) is reasonable based on typical stale-listing flexibility.
Risks & watch-outs
- Climate carrying-cost: extreme-heat days projected 7→20/yr by 2055 (HVAC capex compounding) — expect insurance premiums to compound above CPI over the hold.
Questions for the listing agent
- Is there a deadline driving the sale (1031 exchange, divorce, estate, relocation)? That informs how much negotiation room exists.
- The area grade is low — what's the realistic commute time and amenity access for the typical tenant pool here? Any planned neighborhood developments (good or bad) we should know about?
- What's the average days-on-market for RENTAL listings here right now (not sales)? A rising rental-DOM trend means longer vacancies and softer asking-rent achievability than the comps imply.
- What's the recent tenant-quality profile in this submarket — average credit score on applications, eviction rate, late-payment / NSF rate, and stable-employment percentage? A property-management company in the area should have these aggregated.
- How much new for-sale + rental construction is in the pipeline within 1–3 miles? Heavy new supply typically softens prices + rents 12–24 months out; constrained supply supports both.
Investment metrics
- 1% rule
- 0.80% ✗
- Cap rate
- 6.39%
- Cash-on-cash
- 0.33%
- DSCR
- 1.01
- GRM
- 10.4
CMA / ARV
- ARV (on-the-fly)
- $226,800
- Comps found
- 12
Show comp detail 12 sales within ~0.75 mi
| Address | Dist | Beds/Ba | Sqft | Sold | Price | $/sf | Match |
|---|---|---|---|---|---|---|---|
| 108 W Robberson St | 0.12mi | 3/2.0 | 1,276 (+1%) | 2mo | $199,900 | $157 | 91 |
| 206 S Howard St | 0.06mi | 3/2.0 | 1,276 (+1%) | 5mo | $199,900 | $157 | 91 |
| 112 Grand Prairie Dr | 0.63mi | 3/2.0 | 1,280 (+2%) | 1mo | $229,900 | $180 | 67 |
| 109 Mill St | 0.24mi | 2/1.0 (-1) | 1,380 (+10%) | 0mo | $189,900 | $138 | 64 |
| 502 S Gauge St | 0.38mi | 2/2.0 (-1) | 1,220 (-3%) | 11mo | $225,000 | $184 | 63 |
| 613 S Miller Rd | 0.73mi | 3/2.0 | 1,260 (0%) | 10mo | $229,900 | $182 | 58 |
| 119 N Grand Prairie Dr | 0.70mi | 3/2.0 | 1,219 (-3%) | 11mo | $219,900 | $180 | 53 |
| 7400 W Farm Road 84 | 0.62mi | 3/2.0 | 1,384 (+10%) | 2mo | $284,900 | $206 | 53 |
| 208 E New Melville Rd | 0.52mi | 3/1.5 | 1,378 (+9%) | 8mo | $189,900 | $138 | 52 |
| 127 Grand Prairie Dr | 0.75mi | 3/2.0 | 1,294 (+3%) | 11mo | $200,000 | $155 | 52 |
| 612 S Sarah Ct | 0.72mi | 3/2.0 | 1,370 (+9%) | 6mo | $225,000 | $164 | 47 |
| 102 Arrowhead Rd | 0.73mi | 3/2.0 | 1,085 (-14%) | 2mo | $215,000 | $198 | 41 |
Match score weights: distance 35% · size 25% · config 20% · recency 20%. Top-matched comps best support the ARV.
Projected returns pro-forma
-3.0% appreciation · 3.0% rent growth · sell at horizon
- IRR
- -15.8%
- Equity multiple
- 0.44×
- Total profit
- $-34,604
- Equity at exit
- $32,788
- IRR
- -7.4%
- Equity multiple
- 0.53×
- Total profit
- $-28,978
- Equity at exit
- $19,013
Cash invested: $61,572 (down + closing). Projections, not guarantees.
Landlord ↔ Tenant lean methodology
- Overall (STATE)
- 81 Strongly Landlord-Friendly
- State Missouri
- 81 Strongly Landlord-Friendly · R+10
- County
- — inherits STATE
- City
- — inherits STATE
ZIP-level market 65781
- Home prices YoY
- -27.1%
- Active inventory
- 93
- Price-to-rent
- 10.4×
Monthly cashflow live
- Estimated rent
- $1,764 medium interval (Pro) →
- Mortgage (P&I)
- −$1,153
- Tax from tax record
- −$131 /mo · $1,576/yr
- Insurance
- −$92
- HOA
- −$0
- Vacancy / Maint / Mgmt
- −$370
- Net cashflow
- $17
Break-even live
Sensitivity live
| Price | -10% $142 | -5% $79 | +0% $17 | +5% $-45 | +10% $-107 |
|---|---|---|---|---|---|
| Rent | -10% $-122 | -5% $-53 | +0% $17 | +5% $87 | +10% $156 |
| Rate | -1.0pp $128 | -0.5pp $73 | base $17 | +0.5pp $-40 | +1.0pp $-98 |
UW: 25.0% down · 7.5% · 30yr · 1.5% tax · 5.0% vac · 8.0% maint · 8.0% mgmt
Financing live
Cash to close
- Down payment
- $54,975
- Closing costs
- $6,597
- Reserves months
- —
- Total cash needed
- —
Loan-product check · same deal, 3 products live
Conventional
25% down · 7.5% · 30yr
- Down + closing
- —
- Monthly P&I
- —
- Monthly cashflow
- —
- DSCR
- —
- Eligible?
- —
Personal DTI + credit; lowest rate.
DSCR
20% down · 8.5% · 30yr
- Down + closing
- —
- Monthly P&I
- —
- Monthly cashflow
- —
- DSCR
- —
- Eligible?
- —
No personal income docs; deal must DSCR.
Hard money
10% down · 12.0% · 12mo
- Down + closing
- —
- Monthly P&I
- —
- Monthly cashflow
- —
- DSCR
- —
- Eligible?
- —
Short-term bridge; refi at stabilization.
Rent comps 3 comps
| Address | Beds | Baths | Sqft | Rent | $/sqft | DOM | Units | Dist |
|---|---|---|---|---|---|---|---|---|
| 800 Hoffman Hills Blvd Willard, MO | 3.0 | 2.0 | 1551 | $1,925 | $1.24 | 15d | 1 | 1.22mi |
| 800 Hoffman Hills Blvd Willard, MO | 3.0 | 2.0 | 1551 | $1,725 | $1.11 | 23d | 1 | 1.22mi |
| 803 Lambert Cir Willard, MO | 3.0 | 2.0 | 1375 | $1,650 | $1.20 | 15d | 1 | 1.28mi |
Listing history 8 events
-
2026-06-07statusdays on market $219,900 Pending 16 DOM
-
2026-06-03days on market $219,900 Active 14 DOM
-
2026-06-02days on market $219,900 Active 13 DOM
-
2026-06-01remarks 472-char remark
-
2026-06-01pricedays on market $219,900 Active 12 DOM
-
2026-05-31days on market $225,000 Active 11 DOM
-
2026-05-30days on market $225,000 Active 10 DOM
-
2026-05-20$225,000 Active
ⓘ Source: listings_history table (triggers on properties + properties_extension) + one-shot
backfill from property_details.listing_events for pre-trigger history.
Tax reassessment forecast MO · Resets to sale price
- Current annual tax
- $1,576 · $131/mo
- Projected year-2 tax
- $2,133 · $178/mo
- Expected delta
- +$557/yr (+$46/mo · 35.3%)
ⓘ Screening estimate from a state-policy table — verify with the county assessor before closing.
Climate risk First Street
- Flood 1/10 Low FEMA zone X (unshaded) · 0% chance over 30 yrs
- Wildfire 4/10 Moderate
- Heat 5/10 Major 7 d/yr ≥105°F today · 20 d/yr by 30 yrs out
- Wind 2/10 Low 100% chance of damaging wind over 30 yrs
- Air quality 1/10 Low 0 unhealthy d/yr today · 0 by 30 yrs out
Nearby sold comps map
Loading sold comps map…
Walkable amenities ~0.75 mi
Loading nearby amenities…
Taxation est. · year 1
- Rental income
- $21,164
- − Mortgage interest
- −$12,318
- − Property taxes
- −$1,576
- − Insurance
- −$1,100
- − Repairs & maintenance
- −$1,693
- − Management
- −$1,693
- − Depreciation
- −$6,397
- Taxable loss
- −$3,613
- Est. tax savings @ 24.0%
- +$867
- After-tax cash flow
- $1,073/yr
For passive investors: Depreciation is non-cash, so a rental often shows a tax loss while cash-flowing — sheltering income. Rental losses are passive: they offset passive income freely, and up to $25,000/yr can offset ordinary (W-2) income if you actively participate and your MAGI is under $100k (phasing out to $0 by $150k); unused losses carry forward. On sale, claimed depreciation is recaptured at up to 25%, and gains may owe capital-gains tax (a 1031 exchange can defer both). Figures are a year-1 estimate at your 24.0% rate — not tax advice; consult a CPA.
Schools (NCES district)
- District
- Willard R-II
- NCES district ID
- 2932010
- Math proficiency
- 41% ▼ -2.00%
- Reading proficiency
- 50% ▼ -2.00%
- Median HH income
- $50,200
- Composite
- 39.04/100
- National rank
- #4063
- State rank
- #83 of 324 in MO
Livability — Willard
- Score
- 73/100
- State rank
- #79
- US rank
- #5258
Category grades
Schools grade is shown separately in the Schools card above.
Census & demographics
- Census place
- Willard, MO
- Population (ZIP)
- 9,160
Population outlook (Greene County) Hauer SSP2
- Today (2025)
- 319,054 people
- By 2030
- 335,135 · +5.0%
- By 2040
- 366,186 · +14.8%
- By 2050
- 397,431 · +24.6%
- By 2075
- 477,035 · +49.5%
- By 2100
- 520,828 · +63.2%
Race, ethnicity, and origin ACS 2023
- Neighborhood character
- Predominantly White (93%)
- Race & ethnicity
- White 93% Two or more races 5% Hispanic / Latino 4%
- Common ancestry
- Iranian 4% Italian 3% Slovak 2%
- Foreign-born
- 2% · Canada
- Languages at home
- 96% English-only · Spanish 2% Russian/Polish/Slavic 2%
Political lean MEDSL · Greene
- 2024 margin
- Strong R (+20.8) · D 38.9% · R 59.7% · Other 1.4%
- 2008→2024 swing
- -5.0pp toward R · 2008: -15.8pp · 2024: -20.8pp
- All cycles
- 2024: R+20.8 2020: R+20.1 2016: R+27.4 2012: R+24.4 2008: R+15.8
Not yet ingested
- Civics
- —
Market trends
- HPI YoY
- ▼ -80.06%
- Current HPI
- 214.9498
- Rent YoY
- —
- Metro
- —
- State GDP YoY
- ▲ 1.84%
- F500 in state
- 20
Industry mix (Fortune 500 HQ in MO)
| Industry | F500 HQs | Revenue |
|---|---|---|
| Healthcare | 1 | $163B |
|
||
| Insurance | 1 | $21B |
|
||
| Industrial Technology | 1 | $17B |
|
||
| Retail | 1 | $16B |
|
||
| Industrial Distribution | 1 | $10B |
|
||
| Utilities | 1 | $9B |
|
||
Price history
1 event — show timeline
- 2026-05-20 Listed $225,000 SOMO
Property tax history
+3.3%/yrLatest (2025): $1,576 · +9.5% YoY. Source: county tax records.
Cash-flow waterfall
monthlySold comps — $/sqft
last 12 mo · ≤1 miLoading sold comps…