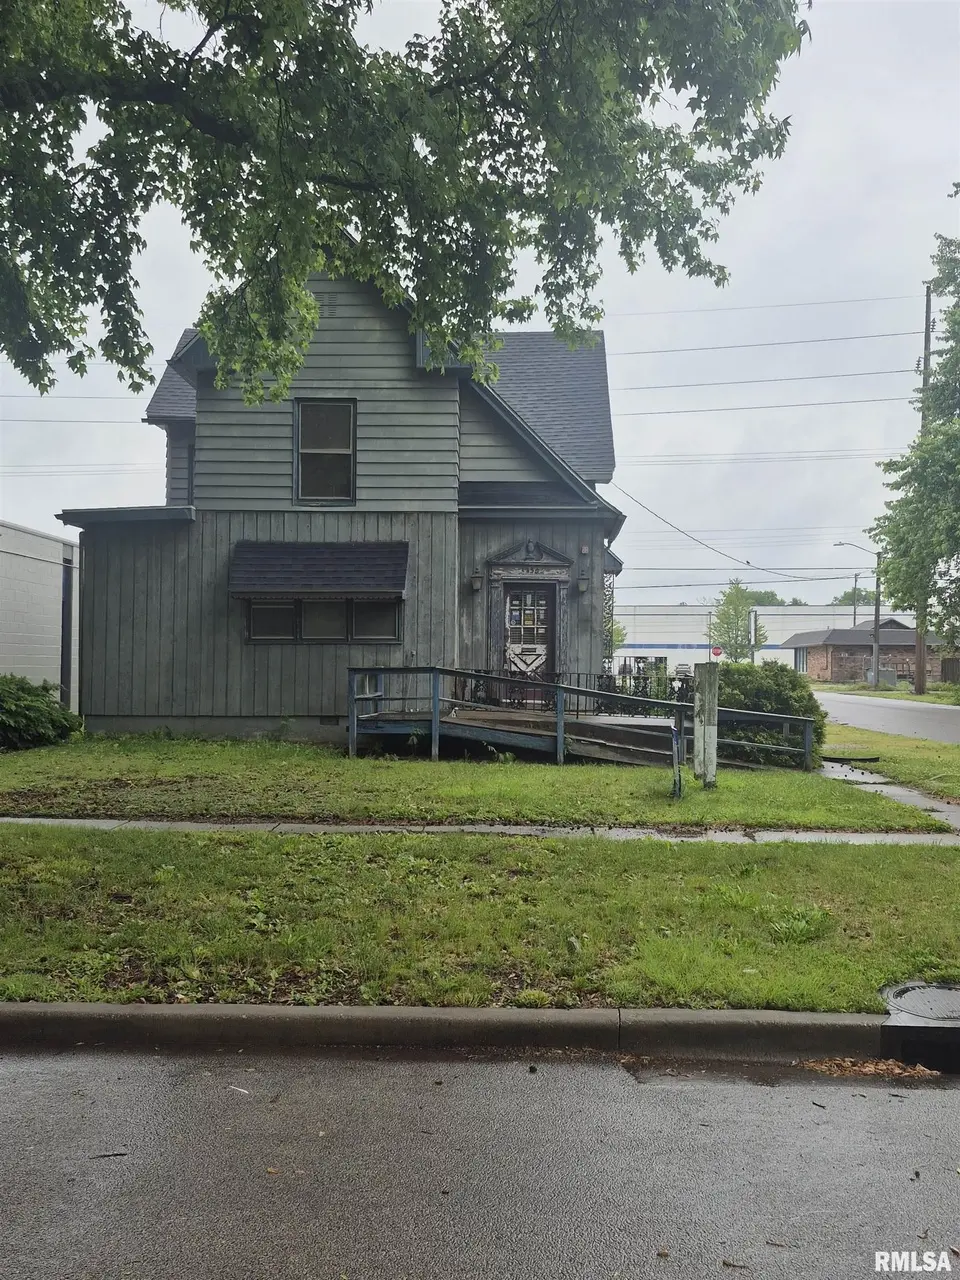
1430 S 8th St · Springfield, IL
Flood risk No data
- FEMA flood zone
- —
- Chance of flooding over 30 yrs
- —
- Est. flood insurance / yr
- —
Fire risk No data
- Est. fire insurance / yr
- —
Heat risk No data
- Hot days now (above threshold)
- —
- Hot days in 30 yrs
- —
Wind risk No data
- Chance of severe wind over 30 yrs
- —
Air-quality risk No data
- Unhealthy air days now
- —
- Unhealthy air days in 30 yrs
- —
Risk factors via First Street. Map © Google.
Why this score? — see what drove the D grade
The composite is a weighted blend of 9 inputs, each scored 0–100. Each bar is that input's sub-score; the figure is the points it added to the 100-point composite (weight × sub-score).
- Cash flow +15.0/30.0
- ARV discount +7.5/15.0
- 1% rule +5.0/10.0
- DSCR +5.0/10.0
- Rent growth +5.0/5.0
- Livability +4.0/5.0
- Schools +1.7/10.0
- Condition / age +1.0/5.0
- Appreciation +0.0/10.0
$34,900
🖨 Deal sheet 📄 Offer letter ✓ Due diligence
Listing remarks
NEW PRICE::::Come check out this opportunity to own a 3BR home with a complete tear off of a NEW ROOF installed August of 2024 with transferrable warranty! Entire property now available for sale on a corner lot conveniently located less than 1 block off of South Grand Ave. Free standing 1.5-story property zoned B-1 currently, but seller is willing to go through the steps to re-zone the property to residential prior to closing. Many possibilities! Offers 3 entrances to be able to split as needed. Some TLC needed on the interior. Shed in the back will stay!
Key facts
- Shed in the back
- 3 entrances
- Zoned b-1
Tags
Property features AI
Finance
- Other: Zoned B-1
Exterior
- Parking: No garage spaces; Paved parking
- Utilities: Public water; Public sewer
- Home design: Single-family residence; Multiple levels including main, upper, lower, basement, and additional level; Built in 1900
- Construction: Shingle roof
- Exterior features: Corner lot; Shed(s); Paved road frontage
Interior
- Kitchen: Kitchen on main level (approximately 13 x 12)
- Bedrooms: 3 bedrooms (bedroom sizes: ~14 x 13; 12 x 12; 13 x 14.5) — bedrooms located on upper and main levels; egress windows in upper-level bedrooms
- Flooring: Carpet in bedrooms
- Bathrooms: 3 half bathrooms, no full bathrooms
- Heating & cooling: Forced air heating; Central air conditioning
- Interior features: Unfinished basement; No fireplaces
- Laundry & utility: Basement utility space (unfinished)
Neighborhood map
What this means for you Summary
Snapshot
- This is a 3-bed/1.5-bath single-family listed at $35k. Condition is rated poor.
Deal economics
- At list price, monthly cash flow is $1k ($13k/yr) — positive.
- The deal already cash-flows at list — no discount required.
- Meets the 1% rule at list price ($2k rent vs $35k).
- Recommended offer: $34k (1.5% below list) — sets the bar for market timing.
- Cap rate 42.9% vs local median 4.9% in Springfield — top-decile yield for the area; either an underpriced asset or a hidden risk that comps aren't pricing in. Stress-test before assuming the spread holds.
Location & tenants
- Location reads 79/100 on livability (#122 in IL, #2,138 nationally) — a middle-class / working-renter tenant base. Strengths: amenities A+, commute A+, cost of living A+; Watch: schools D+, crime F.
- Springfield SD 186 (urban): math 17% / reading 22% proficiency, ranked #438 of 620 in IL (top 71%) — low school quality limits family demand, transient renter base, plan for 1-2y turnover; 64% free/reduced lunch — lower-income household profile, screen leases tightly.
- Market conditions: Rents rising fast (+12.2%/yr); 107 active listings in the ZIP; 2 comparable units currently listed for rent nearby; 225 units permitted in Sangamon County in 2024 (48 in 5+ unit buildings).
- This rent runs 44% of the median local income ($45k/yr) — at the standard rent-burdened threshold; future hikes will face affordability resistance.
Forward outlook
- Local home prices are declining (-3.0%/yr); year-one equity from $241 of loan paydown is wiped out by about $1k of value loss. Plan a longer hold.
- Sangamon County population projected to shrink 9% by 2050 — rents likely to lag national; underwrite the cash flow, not the appreciation.
- At projected returns (-3.0% appreciation + 8.0% rent growth), your $10k cash investment doubles in ~1 year — after that, you're playing with house money.
Negotiation context
- It's been on market 29 days — a 2% lower offer ($34k) is reasonable based on typical stale-listing flexibility.
- 3 sale attempts since 30y ago; this cycle's ask has dropped $26k (43%) from the opening price — seller is motivated, your offer sets the floor, not the list.
Risks & watch-outs
- Watch-outs: built in 1900 — expect roof / HVAC / electrical / plumbing capex.
Questions for the listing agent
- Have any recent inspections been done? Can we get a copy of the seller's disclosures and any deferred-maintenance estimates?
- Built in 1900 — when were the roof, HVAC, electrical panel, plumbing, and water heater last replaced?
- Is there a deadline driving the sale (1031 exchange, divorce, estate, relocation)? That informs how much negotiation room exists.
- Schools are D-rated, which usually means shorter tenancies and higher turnover. Who's the typical renter profile here, and what's been the actual vacancy rate?
- Crime grade is F in this area — have there been break-ins, vandalism, or insurance claims at this property in the last 3 years? What carrier currently insures it and at what premium?
- The area grade is low — what's the realistic commute time and amenity access for the typical tenant pool here? Any planned neighborhood developments (good or bad) we should know about?
- What's the average days-on-market for RENTAL listings here right now (not sales)? A rising rental-DOM trend means longer vacancies and softer asking-rent achievability than the comps imply.
- What's the recent tenant-quality profile in this submarket — average credit score on applications, eviction rate, late-payment / NSF rate, and stable-employment percentage? A property-management company in the area should have these aggregated.
- How much new for-sale + rental construction is in the pipeline within 1–3 miles? Heavy new supply typically softens prices + rents 12–24 months out; constrained supply supports both.
Investment metrics
- 1% rule
- 4.73% ✓
- Cap rate
- 42.88%
- Cash-on-cash
- 130.66%
- DSCR
- 6.81
- GRM
- 1.8
CMA / ARV
- ARV (median comp)
- $88,663
- List price
- $34,900
- Delta
- -60.64%
- Verdict
- UNDERPRICED
- Comps
- 20 within 1.0 mi
Show comp detail 7 sales within ~0.75 mi
| Address | Dist | Beds/Ba | Sqft | Sold | Price | $/sf | Match |
|---|---|---|---|---|---|---|---|
| 1700 S 7th St | 0.18mi | 2/2.5 (-1) | 2,372 (-1%) | 19mo | $80,000 | $34 | 65 |
| 1915 S 6th St | 0.39mi | 4/2.0 (+1) | 2,142 (-10%) | 8mo | $55,000 | $26 | 50 |
| 2021 S 6th St | 0.47mi | 4/1.0 (+1) | 2,320 (-3%) | 19mo | $22,000 | $9 | 50 |
| 1728 S Spring St | 0.64mi | 3/1.5 | 2,056 (-14%) | 2mo | $142,000 | $69 | 45 |
| 2040 S 5th St | 0.61mi | 4/1.5 (+1) | 2,184 (-9%) | 9mo | $36,000 | $16 | 45 |
| 104 W Allen St | 0.57mi | 3/1.0 | 2,208 (-8%) | 21mo | $98,000 | $44 | 41 |
| 2104 S 4th St | 0.72mi | 4/1.5 (+1) | 2,132 (-11%) | 19mo | $165,900 | $78 | 28 |
Match score weights: distance 35% · size 25% · config 20% · recency 20%. Top-matched comps best support the ARV.
Projected returns pro-forma
-3.0% appreciation · 8.0% rent growth · sell at horizon
- IRR
- —
- Equity multiple
- 8.25×
- Total profit
- $70,869
- Equity at exit
- $5,204
- IRR
- —
- Equity multiple
- 20.32×
- Total profit
- $188,815
- Equity at exit
- $3,018
Cash invested: $9,772 (down + closing). Projections, not guarantees.
Landlord ↔ Tenant lean methodology
- Overall (STATE)
- 43 Moderately Tenant-Leaning
- State Illinois
- 43 Moderately Tenant-Leaning · D+7
- County
- — inherits STATE
- City
- — inherits STATE
ZIP-level market 62703
- Home prices YoY
- -28.9%
- Rents YoY
- 12.2%
- Active inventory
- 107
- Price-to-rent
- 1.8×
Monthly cashflow live
- Estimated rent
- $1,652 medium interval (Pro) →
- Mortgage (P&I)
- −$183
- Tax est. 1.5%
- −$44 /mo · $524/yr
- Insurance
- −$15
- HOA
- −$0
- Vacancy / Maint / Mgmt
- −$347
- Net cashflow
- $1,064
Break-even live
UW: 25.0% down · 7.5% · 30yr · 1.5% tax · 5.0% vac · 8.0% maint · 8.0% mgmt
Financing live
Cash to close
- Down payment
- $8,725
- Closing costs
- $1,047
- Reserves months
- —
- Total cash needed
- —
Loan-product check · same deal, 3 products live
Conventional
25% down · 7.5% · 30yr
- Down + closing
- —
- Monthly P&I
- —
- Monthly cashflow
- —
- DSCR
- —
- Eligible?
- —
Personal DTI + credit; lowest rate.
DSCR
20% down · 8.5% · 30yr
- Down + closing
- —
- Monthly P&I
- —
- Monthly cashflow
- —
- DSCR
- —
- Eligible?
- —
No personal income docs; deal must DSCR.
Hard money
10% down · 12.0% · 12mo
- Down + closing
- —
- Monthly P&I
- —
- Monthly cashflow
- —
- DSCR
- —
- Eligible?
- —
Short-term bridge; refi at stabilization.
Rent comps 2 comps
| Address | Beds | Baths | Sqft | Rent | $/sqft | DOM | Units | Dist |
|---|---|---|---|---|---|---|---|---|
| 1213 E Ash St Springfield, IL | 3.0 | 2.0 | 1861 | $2,030 | $1.09 | 21d | 1 | 0.54mi |
| 922 Governor St Springfield, IL | 3.0 | 1.0 | 1682 | $1,200 | $0.71 | 43d | 1 | 1.44mi |
Listing history 17 events
-
2026-06-10days on market $34,900 Active 29 DOM
-
2026-06-09days on market $34,900 Active 28 DOM
-
2026-06-08days on market $34,900 Active 27 DOM
-
2026-06-07days on market $34,900 Active 26 DOM
-
2026-06-05days on market $34,900 Active 23 DOM
-
2026-06-03days on market $34,900 Active 22 DOM
-
2026-06-02days on market $34,900 Active 21 DOM
-
2026-06-01days on market $34,900 Active 20 DOM
-
2026-05-31days on market $34,900 Active 19 DOM
-
2026-05-30days on market $34,900 Active 18 DOM
-
2026-05-12$44,900 Active 561-char remark
-
2026-03-12historical
-
2025-10-30price
-
2025-05-28Active
-
2000-12-12historical
-
1997-01-31soldstatus $58,000
-
1996-08-26$61,000
ⓘ Source: listings_history table (triggers on properties + properties_extension) + one-shot
backfill from property_details.listing_events for pre-trigger history.
Nearby sold comps map
Loading sold comps map…
Walkable amenities ~0.75 mi
Loading nearby amenities…
Taxation est. · year 1
- Rental income
- $19,826
- − Mortgage interest
- −$1,955
- − Property taxes
- −$524
- − Insurance
- −$174
- − Repairs & maintenance
- −$1,586
- − Management
- −$1,586
- − Depreciation
- −$1,015
- Taxable income
- $12,986
- Est. tax owed @ 24.0%
- −$3,117
- After-tax cash flow
- $9,652/yr
For passive investors: Depreciation is non-cash, so a rental often shows a tax loss while cash-flowing — sheltering income. Rental losses are passive: they offset passive income freely, and up to $25,000/yr can offset ordinary (W-2) income if you actively participate and your MAGI is under $100k (phasing out to $0 by $150k); unused losses carry forward. On sale, claimed depreciation is recaptured at up to 25%, and gains may owe capital-gains tax (a 1031 exchange can defer both). Figures are a year-1 estimate at your 24.0% rate — not tax advice; consult a CPA.
Condition & rehab AI · 5 photos
This property requires extensive repairs and maintenance, including a new roof and exterior paint, to become move-in ready and increase its value.
Repairs flagged
- Major siding — Severe weathering and peeling
- Major roof — Old and worn
- Major exterior paint — Peeling and poor condition
Value-add opportunities
- Both repair and paint exterior — Enhances curb appeal and value
- Both repair roof — Critical for structural integrity and value
- Both repair and paint interior — Improves livability and value
Renovation cost estimate screening
| Repair item | Severity | Est. cost |
|---|---|---|
| siding · Severe weathering and peeling | Major | $15,000–50,000 |
| roof · Old and worn | Major | $15,000–50,000 |
| exterior paint · Peeling and poor condition | Major | $15,000–50,000 |
| Total estimated repair cost · 3 items | $45,000–150,000 |
Value-add ROI direction
- Both repair and paint exterior — Enhances curb appeal and value ↑
- Both repair roof — Critical for structural integrity and value ↑
- Both repair and paint interior — Improves livability and value ↑
ⓘ Cost ranges are severity-bucket heuristics (US national rule-of-thumb). Get contractor quotes + a written scope before underwriting a rehab budget.
Schools (NCES district)
- District
- Springfield SD 186
- NCES district ID
- 1737080
- Math proficiency
- 17% ▼ -7.00%
- Reading proficiency
- 22% ▼ -5.00%
- Median HH income
- $43,744
- Composite
- 16.89/100
- National rank
- #9142
- State rank
- #438 of 620 in IL
Livability — Springfield
- Score
- 79/100
- State rank
- #122
- US rank
- #2138
Category grades
Schools grade is shown separately in the Schools card above.
Census & demographics
- Census place
- Springfield, IL
- County
- Sangamon County · 115,414 people
- City population
- 59,955
- Metro
- Springfield, IL
- Population (ZIP)
- 28,922
- Household income
- $45,009
- Rent vs Own
- Severe rent burden
- 1626.0
Population outlook (Sangamon County) Hauer SSP2
- Today (2025)
- 198,317 people
- By 2030
- 196,127 · -1.1%
- By 2040
- 188,664 · -4.9%
- By 2050
- 179,624 · -9.4%
- By 2075
- 155,027 · -21.8%
- By 2100
- 122,588 · -38.2%
Race, ethnicity, and origin ACS 2023
- Neighborhood character
- Diverse neighborhood (Simpson 0.59)
- Race & ethnicity
- White 53% Black 35% Two or more races 7% Hispanic / Latino 5%
- Common ancestry
- Lithuanian 2% Romanian 2% Italian 1%
- Foreign-born
- 3% · Canada
- Languages at home
- 95% English-only · Spanish 3% Arabic 1%
Political lean MEDSL · Sangamon
- 2024 margin
- Toss-up / Even · D 46.6% · R 51.6% · Other 1.8%
- 2008→2024 swing
- -9.3pp toward R · 2008: 4.4pp · 2024: -5.0pp
- All cycles
- 2024: R+5.0 2020: R+4.4 2016: R+9.4 2012: R+8.7 2008: D+4.4
Not yet ingested
- Civics
- —
Market trends
- HPI YoY
- ▼ -59.69%
- Current HPI
- 147.0877
- Rent YoY
- ▲ 12.19%
- Metro
- Springfield, IL
- State GDP YoY
- ▲ 1.59%
- F500 in state
- 60
Industry mix (Fortune 500 HQ in IL)
| Industry | F500 HQs | Revenue |
|---|---|---|
| Insurance | 4 | $201B |
|
||
| Consumer Goods | 4 | $87B |
|
||
| Industrial Machinery | 3 | $64B |
|
||
| Healthcare | 2 | $55B |
|
||
| Retail / Pharmacy | 1 | $148B |
|
||
| Agriculture / Food | 1 | $86B |
|
||
Price history
-4.9% since first listed9 events — show timeline
- 2026-06-13 Listing Removed — RMLSA as Distributed by MLS Grid
- 2026-05-26 Price Changed — RMLSA as Distributed by MLS Grid
- 2026-05-12 Listed — RMLSA as Distributed by MLS Grid
- 2026-03-12 Listing Removed — RMLSA as Distributed by MLS Grid
- 2025-10-30 Price Changed — RMLSA as Distributed by MLS Grid
- 2025-05-28 Listed — RMLSA as Distributed by MLS Grid
- 2000-12-12 Listing Removed — RMLSA as Distributed by MLS Grid
- 1997-01-31 Sold (MLS) $58,000 RMLSA as Distributed by MLS Grid
- 1996-08-26 Listed $61,000 RMLSA as Distributed by MLS Grid
Cash-flow waterfall
monthlySold comps — $/sqft
last 12 mo · ≤1 miLoading sold comps…