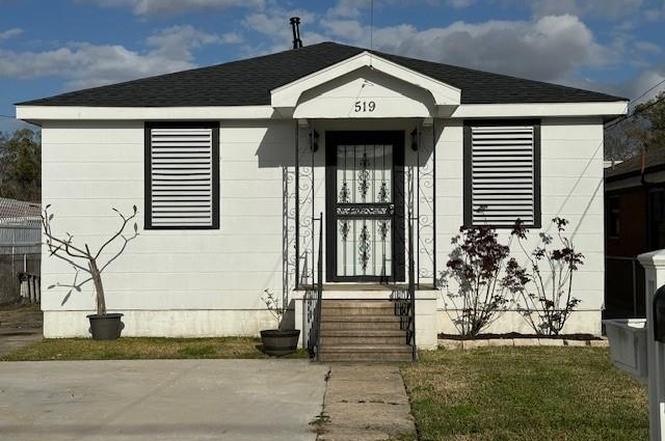
519 Farrington Dr · Harvey, LA
Flood risk 8/10 · Major
- FEMA flood zone
- X
- Chance of flooding over 30 yrs
- 0.6%
- Est. flood insurance / yr
- $507 – $1,088
Fire risk 1/10 · Minimal
- Est. fire insurance / yr
- $1,269 – $2,357
Heat risk 10/10 · Severe
- Hot days now (above 108°F)
- 7 days/yr
- Hot days in 30 yrs
- 21 days/yr
Wind risk 10/10 · Severe
- Chance of severe wind over 30 yrs
- 99.0%
Air-quality risk 3/10 · Minor
- Unhealthy air days now
- 3 days/yr
- Unhealthy air days in 30 yrs
- 4 days/yr
Risk factors via First Street. Map © Google.
Why this score? — see what drove the D- grade
The composite is a weighted blend of 9 inputs, each scored 0–100. Each bar is that input's sub-score; the figure is the points it added to the 100-point composite (weight × sub-score).
- Cash flow +16.8/30.0
- DSCR +5.2/10.0
- 1% rule +3.9/10.0
- Livability +3.2/5.0
- Rent growth +2.8/5.0
- Schools +2.5/10.0
- Condition / age +2.5/5.0
- ARV discount +2.3/15.0
- Appreciation +0.0/10.0
$165,000
🖨 Deal sheet 📄 Offer letter ✓ Due diligence
Listing remarks MLS
Cottage style home in a quiet settled neighborhood. Doors, baseboards, and trim are all original woodwork. Living room opens to a large eat in kitchen. Laundry closet in the kitchen has a stackable washer and dryer that will remain with the home. Existing stove to remain. Hurricane shutters, Large fenced in backyard with covered carport with attached storage shed and a patio that covers slab. Won't last long!!
Key facts
- Large eat in kitchen
- Existing stove
- Laundry closet
Tags
Property features AI
Exterior
- Parking: Two parking spaces
- Utilities: Public water; Public sewer
- Home design: Single-story property; Shingle roof
- Construction: Raised foundation; Shingle roof
- Exterior features: City lot; Rectangular lot; Lot dimensions approximately 40 x 120; Raised foundation
Interior
- Bedrooms: Total of 5 rooms (bedroom count not specified)
- Bathrooms: 1 full bathroom
- Heating & cooling: Central heating; Central air conditioning
- Interior features: Very good condition
Neighborhood map
What this means for you Summary
Snapshot
- This is a 2-bed/1.0-bath single-family listed at $165k.
Deal economics
- At list price, monthly cash flow is $38 ($460/yr) — positive.
- The deal already cash-flows at list — no discount required.
- To meet the 1% rule (rent ≥ 1% of price), the offer needs to be $146k (11.4% below list).
- Recommended offer: $146k (11.4% below list) — sets the bar for 1% rule.
- Cap rate 7.1% vs local median 4.8% in Harvey — top-decile yield for the area; either an underpriced asset or a hidden risk that comps aren't pricing in. Stress-test before assuming the spread holds.
Location & tenants
- Location reads 64/100 on livability (#166 in LA) — a middle-class / working-renter tenant base. Strengths: cost of living A+, housing A+; Watch: schools D+, crime F, amenities F.
- Jefferson Parish (suburban): math 24% / reading 34% proficiency, ranked #44 of 98 in LA (top 45%) — low school quality limits family demand, transient renter base, plan for 1-2y turnover; 70% free/reduced lunch — lower-income household profile, screen leases tightly.
- Market conditions: Rents rising (+1.1%/yr); 294 active listings in the ZIP; 40 comparable units currently listed for rent nearby; rentals at typical pace (median 24d on market — plan ~3-4 weeks tenant-placement turnaround); 518 units permitted in Jefferson Parish in 2024 (43 in 5+ unit buildings).
- This rent runs 32% of the median local income ($55k/yr) — at the standard rent-burdened threshold; future hikes will face affordability resistance.
Forward outlook
- Local home prices are declining (-3.0%/yr); year-one equity from $1k of loan paydown is wiped out by about $5k of value loss. Plan a longer hold.
Negotiation context
- Only 8 days on market — expect competitive offers; lowballing is unlikely to land.
- 8 sale attempts since 7y ago with the ask held roughly flat each time — persistent listings suggest the price (not the market) is what's stuck; bring a comps-based counter.
- Current owner paid $112k; 48% above their basis — modest negotiation headroom, anchor on the comps not their cost.
Risks & watch-outs
- Watch-outs: flood insurance adds $66/mo.
- Climate carrying-cost: severe flood risk; severe wind risk, 99% chance of damaging wind over 30y; extreme-heat days projected 7→21/yr by 2055 (HVAC capex compounding) — expect insurance premiums to compound above CPI over the hold.
Questions for the listing agent
- Built in 1968 — when were the roof, HVAC, electrical panel, plumbing, and water heater last replaced?
- What's the actual annual flood-insurance premium (NFIP or private), and is the property in a SFHA with mandatory coverage?
- Is there a deadline driving the sale (1031 exchange, divorce, estate, relocation)? That informs how much negotiation room exists.
- Schools are D-rated, which usually means shorter tenancies and higher turnover. Who's the typical renter profile here, and what's been the actual vacancy rate?
- Crime grade is F in this area — have there been break-ins, vandalism, or insurance claims at this property in the last 3 years? What carrier currently insures it and at what premium?
- The area grade is low — what's the realistic commute time and amenity access for the typical tenant pool here? Any planned neighborhood developments (good or bad) we should know about?
- What's the average days-on-market for RENTAL listings here right now (not sales)? A rising rental-DOM trend means longer vacancies and softer asking-rent achievability than the comps imply.
- What's the recent tenant-quality profile in this submarket — average credit score on applications, eviction rate, late-payment / NSF rate, and stable-employment percentage? A property-management company in the area should have these aggregated.
- How much new for-sale + rental construction is in the pipeline within 1–3 miles? Heavy new supply typically softens prices + rents 12–24 months out; constrained supply supports both.
Investment metrics
- 1% rule
- 0.89% ✗
- Cap rate
- 7.06%
- Cash-on-cash
- 2.72%
- DSCR
- 1.12
- GRM
- 9.4
CMA / ARV
- ARV (on-the-fly)
- $148,025
- Comps found
- 12
Show comp detail 12 sales within ~0.75 mi
| Address | Dist | Beds/Ba | Sqft | Sold | Price | $/sf | Match |
|---|---|---|---|---|---|---|---|
| 501 Gaudet Dr | 0.07mi | 2/1.0 | 902 (-6%) | 12mo | $137,000 | $152 | 78 |
| 632 Allo Ave | 0.22mi | 2/1.0 | 950 (-0%) | 14mo | $153,000 | $161 | 77 |
| 739 Avenue A Ave | 0.36mi | 2/1.0 | 963 (+1%) | 11mo | $139,000 | $144 | 72 |
| 604 Macarthur Ave | 0.26mi | 2/1.0 | 1,020 (+7%) | 6mo | $178,000 | $175 | 72 |
| 737 Avenue A Ave | 0.35mi | 2/1.0 | 974 (+2%) | 14mo | $155,000 | $159 | 69 |
| 512 Allo Ave | 0.13mi | 2/2.0 | 1,050 (+10%) | 6mo | $189,000 | $180 | 68 |
| 511 Ave B | 0.21mi | 3/1.0 (+1) | 1,044 (+9%) | 3mo | $160,000 | $153 | 67 |
| 818 Avenue A Ave | 0.46mi | 2/1.0 | 900 (-6%) | 9mo | $134,900 | $150 | 61 |
| 713 5th Ave | 0.32mi | 2/1.0 | 872 (-9%) | 12mo | $80,000 | $92 | 60 |
| 813 2nd Ave | 0.54mi | 3/1.0 (+1) | 1,010 (+6%) | 11mo | $157,000 | $155 | 51 |
| 1001 Farrington Dr | 0.61mi | 2/1.0 | 1,007 (+5%) | 20mo | $170,000 | $169 | 46 |
| 921 Gaudet Dr | 0.58mi | 3/1.5 (+1) | 1,076 (+13%) | 18mo | $164,000 | $152 | 29 |
Match score weights: distance 35% · size 25% · config 20% · recency 20%. Top-matched comps best support the ARV.
Projected returns pro-forma
-3.0% appreciation · 1.05% rent growth · sell at horizon
- IRR
- -16.9%
- Equity multiple
- 0.41×
- Total profit
- $-27,101
- Equity at exit
- $24,602
- IRR
- -12.7%
- Equity multiple
- 0.32×
- Total profit
- $-31,527
- Equity at exit
- $14,266
Cash invested: $46,200 (down + closing). Projections, not guarantees.
Landlord ↔ Tenant lean methodology
- Overall (STATE)
- 90 Strongly Landlord-Friendly
- State Louisiana
- 90 Strongly Landlord-Friendly · R+12
- County
- — inherits STATE
- City
- — inherits STATE
ZIP-level market 70072
- Rents YoY
- 1.1%
- Active inventory
- 294
- Price-to-rent
- 9.4×
Monthly cashflow live
- Estimated rent
- $1,462 high interval (Pro) →
- Mortgage (P&I)
- −$865
- Tax from tax record
- −$116 /mo · $1,394/yr
- Insurance
- −$69
- Flood insurance flood zone
- −$66 /mo · $798/yr
- HOA
- −$0
- Vacancy / Maint / Mgmt
- −$307
- Net cashflow
- $38
Break-even live
UW: 25.0% down · 7.5% · 30yr · 1.5% tax · 5.0% vac · 8.0% maint · 8.0% mgmt
Financing live
Cash to close
- Down payment
- $41,250
- Closing costs
- $4,950
- Reserves months
- —
- Total cash needed
- —
Loan-product check · same deal, 3 products live
Conventional
25% down · 7.5% · 30yr
- Down + closing
- —
- Monthly P&I
- —
- Monthly cashflow
- —
- DSCR
- —
- Eligible?
- —
Personal DTI + credit; lowest rate.
DSCR
20% down · 8.5% · 30yr
- Down + closing
- —
- Monthly P&I
- —
- Monthly cashflow
- —
- DSCR
- —
- Eligible?
- —
No personal income docs; deal must DSCR.
Hard money
10% down · 12.0% · 12mo
- Down + closing
- —
- Monthly P&I
- —
- Monthly cashflow
- —
- DSCR
- —
- Eligible?
- —
Short-term bridge; refi at stabilization.
Rent comps 40 comps
| Address | Beds | Baths | Sqft | Rent | $/sqft | DOM | Units | Dist |
|---|---|---|---|---|---|---|---|---|
| 519 Farrington Dr Marrero, LA | 2.0 | 1.0 | 955 | $1,500 | $1.57 | 44d | 1 | 0.03mi |
| 509 Avenue A Marrero, LA | 2.0 | 2.0 | 812 | $1,700 | $2.09 | 44d | 1 | 0.13mi |
| 4200 4th St Marrero, LA | 2.0 | 1.0 | 700 | $1,000 | $1.43 | 44d | 1 | 0.17mi |
| 4200 4th St Apt E Marrero, LA | 2.0 | 1.0 | 700 | $1,000 | $1.43 | 23d | 1 | 0.17mi |
| 511 Avenue B Marrero, LA | 3.0 | 1.0 | 1044 | $1,650 | $1.58 | 44d | 1 | 0.18mi |
| 605 Bellanger St Harvey, LA | 2.0 | 1.0 | 1008 | $1,500 | $1.49 | 44d | 1 | 0.21mi |
| 629 Bellanger St Harvey, LA | 2.0 | 1.0 | 970 | $1,200 | $1.24 | 44d | 1 | 0.23mi |
| 506 MacArthur Ave Harvey, LA | 2.0 | 1.0 | 824 | $1,200 | $1.46 | 4d | 1 | 0.28mi |
| 500 Avenue D Marrero, LA | 3.0 | 1.0 | 1000 | $1,500 | $1.50 | 44d | 1 | 0.32mi |
| 729 5th Ave Harvey, LA | 2.0 | 2.0 | 975 | $1,450 | $1.49 | 44d | 1 | 0.38mi |
| 4824 4th St Unit A Marrero, LA | 2.0 | 1.5 | 1100 | $1,250 | $1.14 | 44d | 1 | 0.46mi |
| 539 Avenue G Unit G Marrero, LA | 2.0 | 1.0 | 1105 | $1,400 | $1.27 | 23d | 1 | 0.47mi |
| 508 Avenue G Unit A Marrero, LA | 3.0 | 2.0 | 1062 | $1,550 | $1.46 | 44d | 1 | 0.49mi |
| 1121 Farrington Dr Marrero, LA | 3.0 | 1.0 | 1000 | $1,750 | $1.75 | 4d | 1 | 0.78mi |
| 2416 4th St Harvey, LA | 1.0 | 1.0 | 750 | $1,000 | $1.33 | 44d | 1 | 0.91mi |
| 526 Brown Ave Harvey, LA | 2.0 | 1.0 | 903 | $1,350 | $1.50 | 23d | 1 | 0.94mi |
| 3639 Tchoupitoulas St New Orleans, LA | 1.0 | 1.0 | 800 | $1,400 | $1.75 | 23d | 1 | 1.05mi |
| 3969 Tchoupitoulas St Unit D New Orleans, LA | 2.0 | 2.0 | 965 | $2,100 | $2.18 | 23d | 1 | 1.05mi |
| 2110 Willow St Unit C Harvey, LA | 2.0 | 1.0 | 975 | $1,155 | $1.18 | 44d | 1 | 1.08mi |
| 2108 Willow St Unit A Harvey, LA | 1.0 | 1.0 | 800 | $895 | $1.12 | 4d | 1 | 1.09mi |
| 320 Marrero Rd Marrero, LA | 2.0 | 1.0 | 900 | $1,200 | $1.33 | 44d | 1 | 1.10mi |
| 420 Fairmont St Harvey, LA | 1.0 | 1.0 | 840 | $1,195 | $1.42 | 4d | 1 | 1.15mi |
| 938 Brown Ave Unit 103 Harvey, LA | 2.0 | 1.0 | 800 | $950 | $1.19 | 4d | 1 | 1.16mi |
| 4535 Tchoupitoulas St New Orleans, LA | 3.0 | 1.0 | 973 | $1,595 | $1.64 | 23d | 1 | 1.19mi |
| 515 Cadiz St New Orleans, LA | 2.0 | 1.0 | 600 | $1,095 | $1.82 | 3d | 1 | 1.20mi |
| 5160 Evans Dr Marrero, LA | 3.0 | 1.0 | 1000 | $1,500 | $1.50 | 44d | 1 | 1.23mi |
| 429 Olive Ave Harvey, LA | 3.0 | 1.0 | 1067 | $1,500 | $1.41 | 23d | 1 | 1.24mi |
| 433 Olive Ave Harvey, LA | 3.0 | 1.0 | 1104 | $1,600 | $1.45 | 23d | 1 | 1.24mi |
| 825 Louisiana Ave #6 New Orleans, LA | 1.0 | 1.0 | 809 | $1,400 | $1.73 | 3d | 1 | 1.26mi |
| 1520 Orchid Dr Harvey, LA | 3.0 | 1.5 | 1100 | $1,800 | $1.64 | 23d | 1 | 1.29mi |
| 1520 Orchid Dr Harvey, LA | 3.0 | 1.5 | 1100 | $1,650 | $1.50 | 4d | 1 | 1.29mi |
| 455 9th St Unit A New Orleans, LA | 2.0 | 1.5 | 917 | $2,550 | $2.78 | 16d | 1 | 1.29mi |
| 3319 Laurel St New Orleans, LA | 1.0 | 1.0 | 1000 | $1,800 | $1.80 | 21d | 1 | 1.31mi |
| 3646 Camp St New Orleans, LA | 2.0 | 1.0 | 730 | $1,650 | $2.26 | 23d | 1 | 1.35mi |
| 1120 Aline St Unit 2A New Orleans, LA | 2.0 | 1.0 | 900 | $1,450 | $1.61 | 23d | 1 | 1.36mi |
| 1120 Aline St Unit 2B New Orleans, LA | 1.0 | 1.0 | 900 | $1,450 | $1.61 | 17d | 1 | 1.36mi |
| 4909 Tchoupitoulas St New Orleans, LA | 2.0 | 1.0 | 962 | $1,700 | $1.77 | 2d | 1 | 1.37mi |
| 1113 Scotsdale Dr Unit D Harvey, LA | 2.0 | 1.0 | 800 | $1,175 | $1.47 | 4d | 1 | 1.38mi |
| 1553 Avenue A Marrero, LA | 1.0 | 1.0 | 700 | $1,250 | $1.79 | 44d | 1 | 1.38mi |
| 3601 Camp St Unit 105 New Orleans, LA | 2.0 | 2.0 | 920 | $2,000 | $2.17 | 23d | 1 | 1.40mi |
Listing history 6 events
-
2026-06-18days on market $165,000 Active 8 DOM
-
2026-06-17days on market $165,000 Active 7 DOM
-
2026-06-16days on market $165,000 Active 6 DOM
-
2026-06-15days on market $165,000 Active 5 DOM
-
2026-06-13remarks 413-char remark
-
2026-06-13$165,000 Active 3 DOM
ⓘ Source: listings_history table (triggers on properties + properties_extension) + one-shot
backfill from property_details.listing_events for pre-trigger history.
Tax reassessment forecast LA · Resets to sale price
- Current annual tax
- $1,394 · $116/mo
- Projected year-2 tax
- $1,394 · $116/mo
- Expected delta
- $0/yr ($0/mo · 0.0%)
ⓘ Screening estimate from a state-policy table — verify with the county assessor before closing.
Climate risk First Street
- Flood 8/10 Severe FEMA zone X · 60% chance over 30 yrs
- Wildfire 1/10 Low
- Heat 10/10 Extreme 7 d/yr ≥108°F today · 21 d/yr by 30 yrs out
- Wind 10/10 Extreme 99% chance of damaging wind over 30 yrs
- Air quality 3/10 Moderate 3 unhealthy d/yr today · 4 by 30 yrs out
Nearby sold comps map
Loading sold comps map…
Walkable amenities ~0.75 mi
Loading nearby amenities…
Taxation est. · year 1
- Rental income
- $17,544
- − Mortgage interest
- −$9,243
- − Property taxes
- −$1,394
- − Insurance
- −$1,622
- − Repairs & maintenance
- −$1,404
- − Management
- −$1,404
- − Depreciation
- −$4,800
- Taxable loss
- −$2,322
- Est. tax savings @ 24.0%
- +$557
- After-tax cash flow
- $1,017/yr
For passive investors: Depreciation is non-cash, so a rental often shows a tax loss while cash-flowing — sheltering income. Rental losses are passive: they offset passive income freely, and up to $25,000/yr can offset ordinary (W-2) income if you actively participate and your MAGI is under $100k (phasing out to $0 by $150k); unused losses carry forward. On sale, claimed depreciation is recaptured at up to 25%, and gains may owe capital-gains tax (a 1031 exchange can defer both). Figures are a year-1 estimate at your 24.0% rate — not tax advice; consult a CPA.
Schools (NCES district)
- District
- Jefferson Parish
- NCES district ID
- 2200840
- Math proficiency
- 24% ▼ -36.00%
- Reading proficiency
- 34% ▼ -30.00%
- Median HH income
- $48,421
- Composite
- 25.19/100
- National rank
- #7511
- State rank
- #44 of 98 in LA
Livability — Harvey
- Score
- 64/100
- State rank
- #166
- US rank
- #13980
Category grades
Schools grade is shown separately in the Schools card above.
Census & demographics
- Census place
- Harvey, LA
- County
- Jefferson Parish · 426,999 people
- City population
- 39,578
- Metro
- New Orleans-Metairie, LA
- Population (ZIP)
- 55,693
- Household income
- $54,885
- Rent vs Own
- Severe rent burden
- 1807.0
Population outlook (Jefferson County) Hauer SSP2
- Today (2025)
- 451,696 people
- By 2030
- 455,451 · +0.8%
- By 2040
- 458,308 · +1.5%
- By 2050
- 461,031 · +2.1%
- By 2075
- 476,351 · +5.5%
- By 2100
- 499,377 · +10.6%
Race, ethnicity, and origin ACS 2023
- Neighborhood character
- Diverse neighborhood (Simpson 0.67)
- Race & ethnicity
- Black 40% White 39% Hispanic / Latino 12% Two or more races 7% Asian 5%
- Hispanic origin (detail)
- Mexican 4% Dominican 1%
- Common ancestry
- Lithuanian 12% Hispanic 1%
- Foreign-born
- 10% · Canada, Vietnam, Jamaica
- Languages at home
- 85% English-only · Spanish 8% Vietnamese 4% French/Haitian/Cajun 2%
Political lean MEDSL · Jefferson
- 2024 margin
- R (+12.9) · D 42.5% · R 55.5% · Other 2.1%
- 2008→2024 swing
- +13.6pp toward D · 2008: -26.6pp · 2024: -12.9pp
- All cycles
- 2024: R+12.9 2020: R+11.1 2016: R+14.8 2012: R+18.4 2008: R+26.6
Not yet ingested
- Civics
- —
Market trends
- HPI YoY
- ▼ -89.87%
- Current HPI
- 161.7477
- Rent YoY
- ▲ 1.05%
- Metro
- New Orleans-Metairie, LA
- State GDP YoY
- ▲ 3.29%
- F500 in state
- 10
Industry mix (Fortune 500 HQ in LA)
| Industry | F500 HQs | Revenue |
|---|---|---|
| Telecommunications | 2 | $23B |
|
||
| Utilities | 1 | $12B |
|
||
| Wholesale / Distribution | 1 | $5B |
|
||
| Advertising | 1 | $2B |
|
||
Price history
-98.8% since first listed16 events — show timeline
- 2026-06-10 Rental Removed $1,500 RAAMLS
- 2026-06-08 Listed $165,000 AcadianaMLS
- 2026-06-08 Listed $165,000 GSREIN
- 2026-04-30 Listed for Rent $1,500 RAAMLS
- 2025-10-20 Rental Removed $1,500 GSREIN
- 2025-09-27 Listed for Rent $1,500 GSREIN
- 2024-09-24 Rental Removed $1,500 GSREIN
- 2024-09-07 Listed for Rent $1,500 GSREIN
- 2024-03-04 Rental Removed $1,500 GSREIN
- 2024-02-24 Listed for Rent $1,500 GSREIN
- 2019-03-07 Sold (Public Records) $111,500 Public Records
- 2019-02-28 Sold (MLS) $111,500 GSREIN
- 2019-02-13 Pending — GSREIN
- 2019-01-10 Listed $123,000 AcadianaMLS
- 2019-01-10 Listed $123,000 GSREIN
- 2000-11-01 Sold (Public Records) — Public Records
Property tax history
+7.5%/yrLatest (2025): $1,394 · +0.3% YoY. Source: county tax records.
Cash-flow waterfall
monthlySold comps — $/sqft
last 12 mo · ≤1 miLoading sold comps…