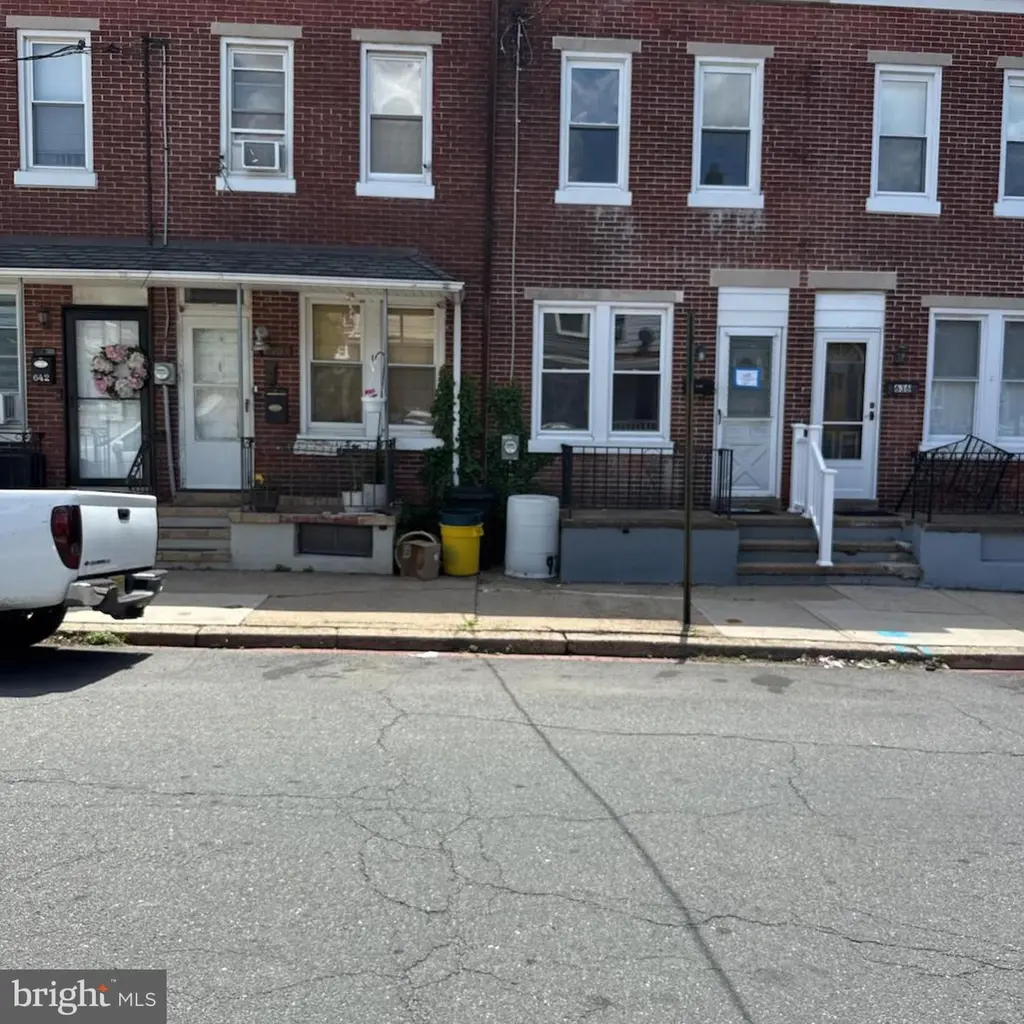
638 Ohio Ave · Trenton, NJ
Flood risk 1/10 · Minimal
- FEMA flood zone
- X (unshaded)
- Chance of flooding over 30 yrs
- 0.0%
- Est. flood insurance / yr
- $507 – $1,088
Fire risk 1/10 · Minimal
- Est. fire insurance / yr
- $526 – $976
Heat risk 6/10 · Moderate
- Hot days now (above 101°F)
- 7 days/yr
- Hot days in 30 yrs
- 15 days/yr
Wind risk 6/10 · Moderate
- Chance of severe wind over 30 yrs
- 27.0%
Air-quality risk 5/10 · Moderate
- Unhealthy air days now
- 6 days/yr
- Unhealthy air days in 30 yrs
- 8 days/yr
Risk factors via First Street. Map © Google.
Why this score? — see what drove the B grade
The composite is a weighted blend of 9 inputs, each scored 0–100. Each bar is that input's sub-score; the figure is the points it added to the 100-point composite (weight × sub-score).
- Cash flow +28.7/30.0
- ARV discount +12.9/15.0
- DSCR +10.0/10.0
- 1% rule +8.6/10.0
- Livability +3.8/5.0
- Rent growth +3.3/5.0
- Condition / age +2.5/5.0
- Schools +0.7/10.0
- Appreciation +0.0/10.0
$174,000
🖨 Deal sheet 📄 Offer letter ✓ Due diligence
Listing remarks MLS
COME SEE ALL THE WORK THEY DID TO ME. I am a Three story Row Home featuring a Large Living room, dining room with a hallway passing the first floor bathroom leading into the Updated kitchen featuring Shaker style oversized cabinets w/ soft close doors and drawers (No slamming of cabinets here), Quartz tops for my countertops, new SS appliances, including that much needed dishwasher, microwave and Stove. New LED lighting throughout, New Waterproof Vinyl on the 1st floor with minimal thresholds. New carpet on the second and third floors, I have also been painted throughout with the added plus of New Electrical service and Panel with Circuit Breakers! This was all done with permits which have all been closed out. WOW. I haven't even talked about the bonus room upstairs which connects the two second floor bedrooms, all with new Carpet. There is the staircase leading up the Attic with my third bedroom, with heat of course. You will find an added bonus in the basement, which of course has the washer, dryer hookups but also a commode. You never know when you will need an extra one. Again, come see me, I really think you will "love" me. Make your appointment soon.
Key facts
- Private backyard
- Full basement
- Close to dining
Tags
Property features AI
Exterior
- Parking: On-street parking
- Utilities: 100 amp electric service; Natural gas for heating; Public water; Public sewer
- Home design: Interior townhouse/rowhouse; Fee simple ownership; Not in a federal flood zone
- Construction: Brick construction; Block foundation; Roof: unknown
- Exterior features: Sidewalks; Street lights; Rear fencing
Interior
- Kitchen: Kitchen (appliances not specified)
- Bedrooms: Two bedrooms on the first upper level; One bedroom on the second upper level
- Flooring: Carpet; Vinyl
- Bathrooms: One full bathroom on the main level; One full bathroom total
- Heating & cooling: 90% forced air heating; Hot water: electric
- Interior features: 7 total rooms including living room, dining room, kitchen and a bonus room; Basement with interior access
- Laundry & utility: Basement laundry hookups
Neighborhood map
What this means for you Summary
Snapshot
- This is a 3-bed/1.0-bath townhouse listed at $174k.
Deal economics
- At list price, monthly cash flow is $580 ($7k/yr) — positive.
- The deal already cash-flows at list — no discount required.
- Meets the 1% rule at list price ($2k rent vs $174k).
- Recommended offer: $171k (1.5% below list) — sets the bar for market timing.
- Cap rate 10.3% vs local median 6.3% in Trenton — top-decile yield for the area; either an underpriced asset or a hidden risk that comps aren't pricing in. Stress-test before assuming the spread holds.
Location & tenants
- Location reads 76/100 on livability (#133 in NJ, #3,533 nationally) — a middle-class / working-renter tenant base. Strengths: amenities A+, commute A+, health & safety A+; Watch: schools F, crime F, employment F.
- Trenton Public School District (urban): math 2% / reading 16% proficiency, ranked #471 of 472 in NJ (top 100%) — low school quality limits family demand, transient renter base, plan for 1-2y turnover; 80% free/reduced lunch — lower-income household profile, screen leases tightly.
- Market conditions: Rents rising (+3.3%/yr); 83 active listings in the ZIP; 37 comparable units currently listed for rent nearby; rentals at typical pace (median 22d on market — plan ~3-4 weeks tenant-placement turnaround); 2,256 units permitted in Mercer County in 2024 (1,303 in 5+ unit buildings).
- This rent runs 42% of the median local income ($67k/yr) — at the standard rent-burdened threshold; future hikes will face affordability resistance.
Forward outlook
- Local home prices are declining (-3.0%/yr); year-one equity from $1k of loan paydown is wiped out by about $5k of value loss. Plan a longer hold.
- Mercer County population projected at +4% by 2050 — modest demand growth; plan on rents tracking national, not racing it.
- At projected returns (-3.0% appreciation + 3.3% rent growth), your $49k cash investment doubles in ~8 years — after that, you're playing with house money.
Negotiation context
- It's been on market 16 days — a 2% lower offer ($171k) is reasonable based on typical stale-listing flexibility.
- 4 sale attempts since 4y ago with the ask held roughly flat each time — persistent listings suggest the price (not the market) is what's stuck; bring a comps-based counter.
Risks & watch-outs
- Watch-outs: built in 1920 — expect roof / HVAC / electrical / plumbing capex.
- Climate carrying-cost: major wind risk, 27% chance of damaging wind over 30y; extreme-heat days projected 7→15/yr by 2055 (HVAC capex compounding) — expect insurance premiums to compound above CPI over the hold.
Questions for the listing agent
- Built in 1920 — when were the roof, HVAC, electrical panel, plumbing, and water heater last replaced?
- Is there a deadline driving the sale (1031 exchange, divorce, estate, relocation)? That informs how much negotiation room exists.
- Schools are F-rated, which usually means shorter tenancies and higher turnover. Who's the typical renter profile here, and what's been the actual vacancy rate?
- Crime grade is F in this area — have there been break-ins, vandalism, or insurance claims at this property in the last 3 years? What carrier currently insures it and at what premium?
- What's the average days-on-market for RENTAL listings here right now (not sales)? A rising rental-DOM trend means longer vacancies and softer asking-rent achievability than the comps imply.
- What's the recent tenant-quality profile in this submarket — average credit score on applications, eviction rate, late-payment / NSF rate, and stable-employment percentage? A property-management company in the area should have these aggregated.
- How much new for-sale + rental construction is in the pipeline within 1–3 miles? Heavy new supply typically softens prices + rents 12–24 months out; constrained supply supports both.
Investment metrics
- 1% rule
- 1.36% ✓
- Cap rate
- 10.29%
- Cash-on-cash
- 14.29%
- DSCR
- 1.64
- GRM
- 6.1
CMA / ARV
- ARV (on-the-fly)
- $197,846
- Comps found
- 12
Show comp detail 12 sales within ~0.75 mi
| Address | Dist | Beds/Ba | Sqft | Sold | Price | $/sf | Match |
|---|---|---|---|---|---|---|---|
| 629 Ohio Ave | 0.02mi | 4/1.0 (+1) | 1,044 (-1%) | 1mo | $252,000 | $241 | 91 |
| 813 Spruce St | 0.15mi | 3/1.5 | 1,062 (+0%) | 6mo | $225,000 | $212 | 85 |
| 23 Cain Ave | 0.24mi | 3/1.0 | 1,102 (+4%) | 8mo | $120,000 | $109 | 75 |
| 1314 Princeton Ave | 0.27mi | 4/1.5 (+1) | 1,092 (+3%) | 4mo | $173,730 | $159 | 71 |
| 30 Mechanics Ave | 0.47mi | 3/1.5 | 1,092 (+3%) | 5mo | $103,200 | $95 | 66 |
| 219 Phillips Ave | 0.37mi | 2/1.0 (-1) | 1,158 (+10%) | 0mo | $230,000 | $199 | 62 |
| 123 Vine St | 0.49mi | 3/2.0 | 980 (-7%) | 2mo | $199,000 | $203 | 59 |
| 51 Vine St | 0.49mi | 2/1.0 (-1) | 978 (-8%) | 7mo | $105,000 | $107 | 54 |
| 50 Mechanics Ave | 0.49mi | 3/1.0 | 1,200 (+13%) | 1mo | $117,500 | $98 | 54 |
| 55 Heil Ave | 0.23mi | 4/2.0 (+1) | 1,200 (+13%) | 7mo | $224,999 | $187 | 52 |
| 29 Poplar St | 0.52mi | 3/1.0 | 938 (-11%) | 7mo | $68,000 | $72 | 51 |
| 224 Phillips Ave | 0.36mi | 3/1.5 | 1,210 (+14%) | 8mo | $300,000 | $248 | 50 |
Match score weights: distance 35% · size 25% · config 20% · recency 20%. Top-matched comps best support the ARV.
Projected returns pro-forma
-3.0% appreciation · 3.31% rent growth · sell at horizon
- IRR
- 5.1%
- Equity multiple
- 1.20×
- Total profit
- $9,588
- Equity at exit
- $25,944
- IRR
- 14.8%
- Equity multiple
- 2.22×
- Total profit
- $59,349
- Equity at exit
- $15,044
Cash invested: $48,720 (down + closing). Projections, not guarantees.
Landlord ↔ Tenant lean methodology
- Overall (STATE)
- 21 Tenant-Leaning
- State New Jersey
- 21 Tenant-Leaning · D+6
- County
- — inherits STATE
- City
- — inherits STATE
ZIP-level market 08638
- Rents YoY
- 3.3%
- Active inventory
- 83
- Price-to-rent
- 6.1×
Monthly cashflow live
- Estimated rent
- $2,365 high interval (Pro) →
- Mortgage (P&I)
- −$912
- Tax from tax record
- −$303 /mo · $3,634/yr
- Insurance
- −$72
- HOA
- −$0
- Vacancy / Maint / Mgmt
- −$497
- Net cashflow
- $580
Break-even live
UW: 25.0% down · 7.5% · 30yr · 1.5% tax · 5.0% vac · 8.0% maint · 8.0% mgmt
Financing live
Cash to close
- Down payment
- $43,500
- Closing costs
- $5,220
- Reserves months
- —
- Total cash needed
- —
Loan-product check · same deal, 3 products live
Conventional
25% down · 7.5% · 30yr
- Down + closing
- —
- Monthly P&I
- —
- Monthly cashflow
- —
- DSCR
- —
- Eligible?
- —
Personal DTI + credit; lowest rate.
DSCR
20% down · 8.5% · 30yr
- Down + closing
- —
- Monthly P&I
- —
- Monthly cashflow
- —
- DSCR
- —
- Eligible?
- —
No personal income docs; deal must DSCR.
Hard money
10% down · 12.0% · 12mo
- Down + closing
- —
- Monthly P&I
- —
- Monthly cashflow
- —
- DSCR
- —
- Eligible?
- —
Short-term bridge; refi at stabilization.
Rent comps 37 comps
| Address | Beds | Baths | Sqft | Rent | $/sqft | DOM | Units | Dist |
|---|---|---|---|---|---|---|---|---|
| 901 Brunswick Ave #7 Trenton, NJ | 3.0 | 1.0 | 940 | $2,800 | $2.98 | 14d | 1 | 0.17mi |
| 331 Ellis Ave Trenton, NJ | 3.0 | 1.0 | 1190 | $2,275 | $1.91 | 21d | 1 | 0.23mi |
| 1314 Princeton Ave Trenton, NJ | 4.0 | 1.0 | 1092 | $2,400 | $2.20 | 14d | 1 | 0.29mi |
| 1040 Indiana Ave Trenton, NJ | 3.0 | 1.0 | 1232 | $2,950 | $2.39 | 14d | 1 | 0.42mi |
| 77 Race St Trenton, NJ | 2.0 | 1.0 | 950 | $1,700 | $1.79 | 21d | 1 | 0.55mi |
| 416 Klagg Ave Trenton, NJ | 3.0 | 1.0 | 1034 | $2,300 | $2.22 | 21d | 1 | 0.55mi |
| 42 Grant St Trenton, NJ | 4.0 | 1.0 | 1000 | $2,000 | $2.00 | 14d | 1 | 0.77mi |
| 130 W Ingham Ave Trenton, NJ | 4.0 | 1.0 | 1126 | $2,000 | $1.78 | 14d | 1 | 0.83mi |
| 1163 E State St Unit 9 Trenton, NJ | 2.0 | 1.0 | 775 | $1,770 | $2.28 | 21d | 1 | 0.87mi |
| 1165 E State St Trenton, NJ | 3.0 | 1.0 | 900 | $1,749 | $1.94 | 14d | 1 | 0.87mi |
| 24 New Trent St Trenton, NJ | 3.0 | 2.0 | 1336 | $2,350 | $1.76 | 14d | 1 | 0.88mi |
| 134 Old Rose St Trenton, NJ | 4.0 | 2.0 | 1212 | $2,300 | $1.90 | 21d | 1 | 0.89mi |
| 417 Walnut Ave Trenton, NJ | 3.0 | 1.0 | 992 | $2,050 | $2.07 | 21d | 1 | 0.97mi |
| 234 Walnut Ave Trenton, NJ | 4.0 | 1.0 | 1480 | $2,200 | $1.49 | 21d | 1 | 1.02mi |
| 219 Woodlawn Ave Trenton, NJ | 3.0 | 1.0 | 1456 | $2,355 | $1.62 | 14d | 1 | 1.03mi |
| 339 Tioga St #339 Trenton, NJ | 2.0 | 1.0 | 864 | $1,850 | $2.14 | 21d | 1 | 1.04mi |
| 1100 Prospect St Unit 1 Ewing Township, NJ | 3.0 | 1.0 | 1100 | $2,000 | $1.82 | 21d | 1 | 1.06mi |
| 21 Adella Ave Trenton, NJ | 3.0 | 1.0 | 1280 | $2,000 | $1.56 | 14d | 1 | 1.08mi |
| 25 Adella Ave Trenton, NJ | 3.0 | 1.0 | 1280 | $2,050 | $1.60 | 14d | 1 | 1.09mi |
| 105 Walnut Ave Unit 1 Trenton, NJ | 2.0 | 1.0 | 1200 | $2,000 | $1.67 | 21d | 1 | 1.12mi |
| 125 Olive St Trenton, NJ | 2.0–3.0 | 1.0–1.5 | 896 | $1,392 | $1.55 | 21d | 1 | 1.17mi |
| 756 Cherry Tree Ln Lawrence Township, NJ | 2.0 | 1.0 | 1207 | $2,200 | $1.82 | 14d | 1 | 1.17mi |
| 550 Lawrenceville Rd Lawrence Township, NJ | 1.0–2.0 | 1.0 | 910 | $1,655 | $1.82 | 21d | 1 | 1.21mi |
| 340 Connecticut Ave Unit 1 Hamilton Township, NJ | 2.0 | 1.0 | 1000 | $2,500 | $2.50 | 14d | 1 | 1.25mi |
| 340 Connecticut Ave Unit 2 Hamilton Township, NJ | 3.0 | 1.0 | 1400 | $2,850 | $2.04 | 14d | 1 | 1.25mi |
| 202 E Hanover St Unit 5G Trenton, NJ | 2.0 | 1.0 | 750 | $1,200 | $1.60 | 21d | 1 | 1.27mi |
| 2140 Princeton Pike Lawrenceville, NJ | 2.0 | 1.0 | 952 | $2,700 | $2.84 | 21d | 1 | 1.28mi |
| 216 E State St Trenton, NJ | 1.0–2.0 | 1.0 | 811 | $1,895 | $2.34 | 14d | 2 | 1.29mi |
| 8 Joan Ter Trenton, NJ | 3.0 | 2.0 | 1397 | $3,250 | $2.33 | 21d | 1 | 1.30mi |
| 8 Belvidere St Trenton, NJ | 2.0 | 1.0 | 1260 | $1,900 | $1.51 | 21d | 1 | 1.35mi |
| 428 Cleveland Ave Trenton, NJ | 4.0 | 2.0 | 1400 | $2,500 | $1.79 | 21d | 1 | 1.37mi |
| 720 Monmouth St Unit 204 Trenton, NJ | 2.0 | 1.0 | 1011 | $1,750 | $1.73 | 21d | 1 | 1.37mi |
| 1474 Nottingham Way Hamilton Township, NJ | 1.0–2.0 | 1.0 | 775 | $2,195 | $2.83 | 21d | 1 | 1.42mi |
| 319 Rutherford Ave Trenton, NJ | 4.0 | 2.0 | 1100 | $2,200 | $2.00 | 21d | 1 | 1.44mi |
| 635 Chambers St Trenton, NJ | 4.0 | 2.0 | 1312 | $2,500 | $1.91 | 14d | 1 | 1.47mi |
| 1001 Pennington Rd Unit 1-2B Ewing Township, NJ | 2.0 | 1.0 | 700 | $1,200 | $1.71 | 21d | 1 | 1.47mi |
| 121 Columbus Ave Trenton, NJ | 3.0 | 1.0 | 1050 | $1,900 | $1.81 | 21d | 1 | 1.50mi |
Listing history 12 events
-
2026-06-17status $174,000 Pending 16 DOM
-
2026-06-17days on market $174,000 Active 16 DOM
-
2026-06-16days on market $174,000 Active 15 DOM
-
2026-06-15days on market $174,000 Active 14 DOM
-
2026-06-14days on market $174,000 Active 12 DOM
-
2026-06-10days on market $174,000 Active 9 DOM
-
2026-06-09days on market $174,000 Active 8 DOM
-
2026-06-08days on market $174,000 Active 7 DOM
-
2026-06-07days on market $174,000 Active 6 DOM
-
2026-06-03days on market $174,000 Active 2 DOM
-
2026-06-01remarks 345-char remark
-
2026-06-01$174,000 Active 1 DOM
ⓘ Source: listings_history table (triggers on properties + properties_extension) + one-shot
backfill from property_details.listing_events for pre-trigger history.
Tax reassessment forecast NJ · Partial reset (capped growth)
- Current annual tax
- $3,634 · $303/mo
- Projected year-2 tax
- $3,983 · $332/mo
- Expected delta
- +$349/yr (+$29/mo · 9.6%)
ⓘ Screening estimate from a state-policy table — verify with the county assessor before closing.
Climate risk First Street
- Flood 1/10 Low FEMA zone X (unshaded) · 0% chance over 30 yrs
- Wildfire 1/10 Low
- Heat 6/10 Major 7 d/yr ≥101°F today · 15 d/yr by 30 yrs out
- Wind 6/10 Major 27% chance of damaging wind over 30 yrs
- Air quality 5/10 Major 6 unhealthy d/yr today · 8 by 30 yrs out
Nearby sold comps map
Loading sold comps map…
Walkable amenities ~0.75 mi
Loading nearby amenities…
Taxation est. · year 1
- Rental income
- $28,376
- − Mortgage interest
- −$9,747
- − Property taxes
- −$3,634
- − Insurance
- −$870
- − Repairs & maintenance
- −$2,270
- − Management
- −$2,270
- − Depreciation
- −$5,062
- Taxable income
- $4,523
- Est. tax owed @ 24.0%
- −$1,085
- After-tax cash flow
- $5,877/yr
For passive investors: Depreciation is non-cash, so a rental often shows a tax loss while cash-flowing — sheltering income. Rental losses are passive: they offset passive income freely, and up to $25,000/yr can offset ordinary (W-2) income if you actively participate and your MAGI is under $100k (phasing out to $0 by $150k); unused losses carry forward. On sale, claimed depreciation is recaptured at up to 25%, and gains may owe capital-gains tax (a 1031 exchange can defer both). Figures are a year-1 estimate at your 24.0% rate — not tax advice; consult a CPA.
Schools (NCES district)
- District
- Trenton Public School District
- NCES district ID
- 3416290
- Math proficiency
- 2% ▼ -8.00%
- Reading proficiency
- 16% ▼ -4.00%
- Median HH income
- $35,078
- Composite
- 7.31/100
- National rank
- #9956
- State rank
- #471 of 472 in NJ
Livability — Trenton
- Score
- 76/100
- State rank
- #133
- US rank
- #3533
Category grades
Schools grade is shown separately in the Schools card above.
Census & demographics
- Census place
- Trenton, NJ
- County
- Mercer County · 327,655 people
- City population
- 177,819
- Metro
- Trenton-Princeton, NJ
- Population (ZIP)
- 22,816
- Household income
- $66,875
- Rent vs Own
- Severe rent burden
- 1185.0
Population outlook (Mercer County) Hauer SSP2
- Today (2025)
- 381,395 people
- By 2030
- 384,640 · +0.9%
- By 2040
- 391,431 · +2.6%
- By 2050
- 397,845 · +4.3%
- By 2075
- 417,281 · +9.4%
- By 2100
- 420,327 · +10.2%
Race, ethnicity, and origin ACS 2023
- Neighborhood character
- Diverse neighborhood (Simpson 0.68)
- Race & ethnicity
- Black 43% White 31% Hispanic / Latino 21% Two or more races 8% Asian 2%
- Hispanic origin (detail)
- Mexican 2% Puerto Rican 6% Dominican 3%
- Common ancestry
- Romanian 4% Hispanic 2% Iranian 1%
- Foreign-born
- 24% · Canada, Guatemala, China
- Languages at home
- 76% English-only · Spanish 17% Russian/Polish/Slavic 2% Other Indo-European 2%
Political lean MEDSL · Mercer
- 2024 margin
- Solid D (+33.9) · D 65.9% · R 32.0% · Other 2.1%
- 2008→2024 swing
- -2.2pp toward R · 2008: 36.1pp · 2024: 33.9pp
- All cycles
- 2024: D+33.9 2020: D+40.0 2016: D+36.2 2012: D+36.8 2008: D+36.1
Not yet ingested
- Civics
- —
Market trends
- HPI YoY
- ▼ -286.00%
- Current HPI
- 334.5143
- Rent YoY
- ▲ 3.31%
- Metro
- Trenton-Princeton, NJ
- State GDP YoY
- ▲ 2.05%
- F500 in state
- 34
Industry mix (Fortune 500 HQ in NJ)
| Industry | F500 HQs | Revenue |
|---|---|---|
| Consumer Goods | 3 | $31B |
|
||
| Pharmaceuticals | 2 | $153B |
|
||
| Technology | 2 | $21B |
|
||
| Insurance | 2 | $20B |
|
||
| Healthcare | 2 | $19B |
|
||
| Financial Services | 1 | $70B |
|
||
Price history
+74.2% since first listed11 events — show timeline
- 2026-06-01 Listed $174,000 BRIGHT MLS
- 2023-05-05 Sold (MLS) $182,000 BRIGHT MLS
- 2023-04-02 Pending — BRIGHT MLS
- 2023-03-29 Contingent — BRIGHT MLS
- 2023-03-21 Listed $182,900 BRIGHT MLS
- 2022-07-27 Sold (Public Records) $87,500 Public Records
- 2022-07-22 Sold (MLS) $87,500 BRIGHT MLS
- 2022-06-28 Delisted — MOMLS
- 2022-06-22 Pending — BRIGHT MLS
- 2022-06-08 Listed $99,900 BRIGHT MLS
- 2022-06-06 Listed $99,900 MOMLS
Property tax history
+0.9%/yrLatest (2025): $3,634 · +1.5% YoY. Source: county tax records.
Cash-flow waterfall
monthlySold comps — $/sqft
last 12 mo · ≤1 miLoading sold comps…