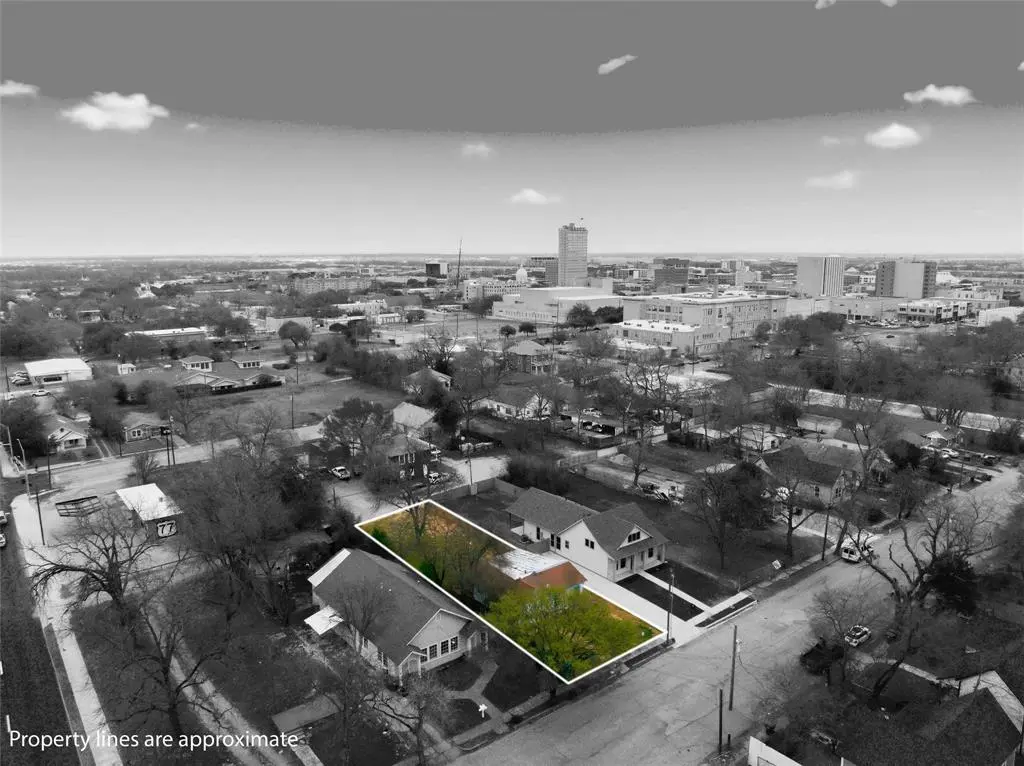
603 N 10th St · Waco, TX
Flood risk 1/10 · Minimal
- FEMA flood zone
- X (unshaded)
- Chance of flooding over 30 yrs
- 0.0%
- Est. flood insurance / yr
- $507 – $1,088
Fire risk 1/10 · Minimal
- Est. fire insurance / yr
- $1,222 – $2,270
Heat risk 7/10 · Major
- Hot days now (above 109°F)
- 7 days/yr
- Hot days in 30 yrs
- 22 days/yr
Wind risk 6/10 · Moderate
- Chance of severe wind over 30 yrs
- 56.0%
Air-quality risk 2/10 · Minimal
- Unhealthy air days now
- 0 days/yr
- Unhealthy air days in 30 yrs
- 1 days/yr
Risk factors via First Street. Map © Google.
Why this score? — see what drove the D+ grade
The composite is a weighted blend of 9 inputs, each scored 0–100. Each bar is that input's sub-score; the figure is the points it added to the 100-point composite (weight × sub-score).
- ARV discount +15.0/15.0
- Appreciation +10.0/10.0
- Cash flow +7.5/30.0
- Livability +3.7/5.0
- 1% rule +2.6/10.0
- Rent growth +2.5/5.0
- Condition / age +2.5/5.0
- Schools +1.8/10.0
- DSCR +1.6/10.0
$145,000
🖨 Deal sheet 📄 Offer letter ✓ Due diligence
Listing remarks MLS
Zoned O-2 and located just blocks from downtown, this property is packed with opportunity. The existing home could be renovated and brought back to life, or a builder could take advantage of the lot and start fresh with new construction. The O-2 zoning allows for a wide range of possibilities including commercial use, short-term rentals, and a variety of mixed-use options, making it an attractive opportunity for investors, developers, or business owners. Alley access at the rear of the property adds valuable flexibility for parking, access, or future building options. The location is another major highlight, with a new coffee shop planned just two blocks away and additional walkable retail and neighborhood amenities in the works nearby. As this pocket near downtown continues to grow and improve, properties like this offer a rare chance to get in early and capitalize on the momentum.
Key facts
- Alley access
- Walkable retail
- Zoned o-2
Tags
Neighborhood map
What this means for you Summary
Snapshot
- This is a 1-bed/1.0-bath single-family listed at $145k.
Deal economics
- At list price, monthly cash flow is $-180 ($-2k/yr) — negative.
- To cash-flow at today's rent, offer at most $113k (21.9% below list).
- To meet the 1% rule (rent ≥ 1% of price), the offer needs to be $110k (23.8% below list).
- Recommended offer: $110k (23.8% below list) — sets the bar for 1% rule.
- Cap rate 4.8% vs local median 3.9% in Waco — meaningfully above typical; check what's discounted (condition, days-on-market, listing class) to confirm the premium yield is real.
Location & tenants
- Location reads 74/100 on livability (#166 in TX, #4,378 nationally) — a middle-class / working-renter tenant base. Strengths: cost of living A+, housing A+, health & safety A+; Watch: schools D, crime D, commute F.
- Waco ISD (urban): math 20% / reading 24% proficiency, ranked #773 of 826 in TX (top 94%) — low school quality limits family demand, transient renter base, plan for 1-2y turnover; 81% free/reduced lunch — lower-income household profile, screen leases tightly.
- Market conditions: 12 active listings in the ZIP; 37 comparable units currently listed for rent nearby; rentals at typical pace (median 21d on market — plan ~3-4 weeks tenant-placement turnaround); 1,014 units permitted in McLennan County in 2024 (200 in 5+ unit buildings).
Forward outlook
- In year one you build about $16k of equity ($1k loan paydown + $14k appreciation (10.0% local appreciation)).
- McLennan County population projected at +17% by 2050 — long-run rental-demand tailwind backs the buy-and-hold thesis.
- By year 3, paydown + projected appreciation supports a ~$39k cash-out refi (75% LTV) — recoverable capital for the next deal without selling this one.
Negotiation context
- It's been on market 106 days — a 9% lower offer ($132k) is reasonable based on typical stale-listing flexibility.
- 3 sale attempts since 3y ago with the ask held roughly flat each time — persistent listings suggest the price (not the market) is what's stuck; bring a comps-based counter.
Risks & watch-outs
- Watch-outs: built in 1935 — expect roof / HVAC / electrical / plumbing capex.
- Climate carrying-cost: major wind risk, 56% chance of damaging wind over 30y; extreme-heat days projected 7→22/yr by 2055 (HVAC capex compounding) — expect insurance premiums to compound above CPI over the hold.
Questions for the listing agent
- What do current leases actually rent for vs. the listed asking? Can we see a recent rent roll and the last 12 months of T-12 income?
- It's been on market 106 days. Have you received any prior offers? Is the seller open to a 24% concession, seller financing, or rate buy-down credit?
- Built in 1935 — when were the roof, HVAC, electrical panel, plumbing, and water heater last replaced?
- Why hasn't it sold? Are there any deal-killer items the seller is aware of (foundation, flood, title, zoning, code violations)?
- Is there a deadline driving the sale (1031 exchange, divorce, estate, relocation)? That informs how much negotiation room exists.
- Schools are D-rated, which usually means shorter tenancies and higher turnover. Who's the typical renter profile here, and what's been the actual vacancy rate?
- Crime grade is D in this area — have there been break-ins, vandalism, or insurance claims at this property in the last 3 years? What carrier currently insures it and at what premium?
- The area grade is low — what's the realistic commute time and amenity access for the typical tenant pool here? Any planned neighborhood developments (good or bad) we should know about?
- What's the average days-on-market for RENTAL listings here right now (not sales)? A rising rental-DOM trend means longer vacancies and softer asking-rent achievability than the comps imply.
- What's the recent tenant-quality profile in this submarket — average credit score on applications, eviction rate, late-payment / NSF rate, and stable-employment percentage? A property-management company in the area should have these aggregated.
- How much new for-sale + rental construction is in the pipeline within 1–3 miles? Heavy new supply typically softens prices + rents 12–24 months out; constrained supply supports both.
Investment metrics
- 1% rule
- 0.76% ✗
- Cap rate
- 4.81%
- Cash-on-cash
- -5.31%
- DSCR
- 0.76
- GRM
- 10.9
CMA / ARV
- ARV (median comp)
- $176,942
- List price
- $145,000
- Delta
- -18.05%
- Verdict
- UNDERPRICED
- Comps
- 20 within 1.0 mi
Show comp detail 6 sales within ~0.75 mi
| Address | Dist | Beds/Ba | Sqft | Sold | Price | $/sf | Match |
|---|---|---|---|---|---|---|---|
| 914 N 10th St | 0.20mi | 2/1.0 (+1) | 1,152 (+8%) | 22mo | $89,900 | $78 | 54 |
| 620 Maryland Ave | 0.68mi | 2/1.0 (+1) | 1,036 (-3%) | 6mo | $65,000 | $63 | 53 |
| 1521 N 11th St | 0.55mi | 2/1.0 (+1) | 1,092 (+2%) | 21mo | $70,000 | $64 | 49 |
| 1404 N 11th St | 0.50mi | 2/2.0 (+1) | 1,138 (+6%) | 14mo | $199,900 | $176 | 46 |
| 1405 N 11th St | 0.49mi | 2/1.0 (+1) | 936 (-13%) | 10mo | $85,000 | $91 | 42 |
| 1217 N 6th St | 0.50mi | 2/1.0 (+1) | 912 (-15%) | 15mo | $175,000 | $192 | 34 |
Match score weights: distance 35% · size 25% · config 20% · recency 20%. Top-matched comps best support the ARV.
Projected returns pro-forma
10.0% appreciation · 3.0% rent growth · sell at horizon
- IRR
- 20.5%
- Equity multiple
- 2.66×
- Total profit
- $67,585
- Equity at exit
- $130,627
- IRR
- 18.7%
- Equity multiple
- 6.13×
- Total profit
- $208,112
- Equity at exit
- $281,703
Cash invested: $40,600 (down + closing). Projections, not guarantees.
Landlord ↔ Tenant lean methodology
- Overall (STATE)
- 87 Strongly Landlord-Friendly
- State Texas
- 87 Strongly Landlord-Friendly · R+5
- County
- — inherits STATE
- City
- — inherits STATE
ZIP-level market 76701
- Home prices YoY
- 3.7%
- Active inventory
- 12
- Price-to-rent
- 10.9×
Monthly cashflow live
- Estimated rent
- $1,105 high interval (Pro) →
- Mortgage (P&I)
- −$760
- Tax from tax record
- −$231 /mo · $2,776/yr
- Insurance
- −$60
- HOA
- −$0
- Vacancy / Maint / Mgmt
- −$232
- Net cashflow
- $-180
Break-even live
UW: 25.0% down · 7.5% · 30yr · 1.5% tax · 5.0% vac · 8.0% maint · 8.0% mgmt
Financing live
Cash to close
- Down payment
- $36,250
- Closing costs
- $4,350
- Reserves months
- —
- Total cash needed
- —
Loan-product check · same deal, 3 products live
Conventional
25% down · 7.5% · 30yr
- Down + closing
- —
- Monthly P&I
- —
- Monthly cashflow
- —
- DSCR
- —
- Eligible?
- —
Personal DTI + credit; lowest rate.
DSCR
20% down · 8.5% · 30yr
- Down + closing
- —
- Monthly P&I
- —
- Monthly cashflow
- —
- DSCR
- —
- Eligible?
- —
No personal income docs; deal must DSCR.
Hard money
10% down · 12.0% · 12mo
- Down + closing
- —
- Monthly P&I
- —
- Monthly cashflow
- —
- DSCR
- —
- Eligible?
- —
Short-term bridge; refi at stabilization.
Rent comps 37 comps
| Address | Beds | Baths | Sqft | Rent | $/sqft | DOM | Units | Dist |
|---|---|---|---|---|---|---|---|---|
| 804 N 11th St Waco, TX | 1.0–2.0 | 1.0 | 838 | $999 | $1.19 | 21d | 1 | 0.14mi |
| 930 N 11th St Waco, TX | 1.0 | 1.0 | 924 | $690 | $0.75 | 21d | 1 | 0.23mi |
| 817 Colcord Ave Waco, TX | 1.0 | 1.0 | 700 | $1,225 | $1.75 | 44d | 1 | 0.47mi |
| 700 Franklin Ave Waco, TX | 2.0 | 2.0 | 802 | $1,500 | $1.87 | 44d | 1 | 0.54mi |
| 700 Franklin Ave Waco, TX | 1.0 | 1.0 | 702 | $1,200 | $1.71 | 21d | 1 | 0.54mi |
| 215 Washington Ave Waco, TX | 1.0–4.0 | 1.0–4.0 | 919 | $499 | $0.54 | 21d | 1 | 0.60mi |
| 1906 Bosque Blvd Unit 1 Waco, TX | 1.0 | 1.0 | 880 | $875 | $0.99 | 21d | 1 | 0.80mi |
| 1923 Austin Ave Waco, TX | 1.0 | 1.0 | 785 | $1,200 | $1.53 | 21d | 1 | 0.88mi |
| 1923 Austin Ave Apt 7104 Waco, TX | 1.0 | 1.0 | 785 | $1,100 | $1.40 | 44d | 1 | 0.88mi |
| 1923 Austin Ave Unit 5202 Waco, TX | 2.0 | 2.5 | 1265 | $1,395 | $1.10 | 21d | 1 | 0.88mi |
| 1821 Algonquin St Waco, TX | 2.0 | 1.0 | 930 | $1,150 | $1.24 | 44d | 1 | 0.89mi |
| 715 Cleveland Ave Waco, TX | 1.0–3.0 | 1.0–3.0 | 845 | $1,143 | $1.35 | 13d | 23 | 1.01mi |
| 615 N 23rd St Waco, TX | 2.0 | 1.0 | 900 | $1,275 | $1.42 | 21d | 1 | 1.02mi |
| 700 S 4th St Waco, TX | 1.0–3.0 | 1.0–2.0 | 889 | $1,175 | $1.32 | 13d | 12 | 1.04mi |
| 1905 N 19th St Waco, TX | 1.0 | 1.0 | 816 | $875 | $1.07 | 21d | 1 | 1.14mi |
| 1104 Sherman St Waco, TX | 2.0 | 1.0 | 1120 | $1,500 | $1.34 | 44d | 1 | 1.15mi |
| 2225 Trice Ave Waco, TX | 2.0 | 1.0 | 803 | $1,300 | $1.62 | 44d | 1 | 1.27mi |
| 2225 Trice Ave Waco, TX | 2.0 | 1.0 | 803 | $1,300 | $1.62 | 13d | 1 | 1.27mi |
| 2601 Fort Ave Unit 4 Waco, TX | 2.0 | 1.0 | 1000 | $990 | $0.99 | 44d | 1 | 1.28mi |
| 1300 S 11th St Waco, TX | 2.0 | 2.5 | 1083 | $1,209 | $1.12 | 13d | 14 | 1.34mi |
| 2224 Cumberland Ave Waco, TX | 2.0 | 1.0 | 768 | $1,075 | $1.40 | 44d | 1 | 1.35mi |
| 2632 Colonial Ave Unit B Waco, TX | 2.0 | 1.0 | 896 | $1,050 | $1.17 | 21d | 1 | 1.36mi |
| 1901 Dutton Ave Waco, TX | 2.0 | 1.0 | 864 | $1,400 | $1.62 | 13d | 1 | 1.37mi |
| 1348 S 12th St Waco, TX | 2.0 | 2.0 | 958 | $1,300 | $1.36 | 21d | 1 | 1.38mi |
| 700 S 24th St Unit 1 Waco, TX | 2.0 | 1.0 | 812 | $1,200 | $1.48 | 21d | 1 | 1.38mi |
| 2714 Morrow Ave Waco, TX | 2.0 | 1.0 | 1484 | $1,375 | $0.93 | 21d | 1 | 1.39mi |
| 2225 Windsor Ave Waco, TX | 2.0 | 1.0 | 840 | $1,100 | $1.31 | 44d | 1 | 1.42mi |
| 1214 Baylor Ave Waco, TX | 1.0–2.0 | 1.0–2.0 | 736 | $795 | $1.08 | 44d | 2 | 1.43mi |
| 1214 Baylor Ave Waco, TX | 1.0–2.0 | 1.0–2.0 | 832 | $795 | $0.96 | 13d | 2 | 1.43mi |
| 1214 Baylor Ave Waco, TX | 2.0 | 2.0 | 832 | $1,020 | $1.23 | 21d | 1 | 1.43mi |
| 1226 Baylor Ave Waco, TX | 2.0 | 2.0–2.5 | 1024 | $1,350 | $1.32 | 21d | 2 | 1.43mi |
| 1226 Baylor Ave Waco, TX | 2.0 | 2.0–2.5 | 1024 | $1,337 | $1.31 | 13d | 2 | 1.43mi |
| 2724 Bosque Blvd Waco, TX | 2.0 | 1.0 | 1120 | $1,100 | $0.98 | 21d | 1 | 1.45mi |
| 1421 S 12th St Waco, TX | 2.0 | 2.0 | 928 | $985 | $1.06 | 13d | 3 | 1.47mi |
| 1508 S 13th St Waco, TX | 1.0–2.0 | 1.0 | 775 | $750 | $0.97 | 13d | 1 | 1.47mi |
| 1326 Park Ave Waco, TX | 2.0 | 2.5 | 1143 | $1,400 | $1.22 | 21d | 1 | 1.49mi |
| 1326 Park Ave Waco, TX | 2.0 | 2.5 | 1143 | $1,400 | $1.22 | 13d | 1 | 1.49mi |
Listing history 23 events
-
2026-06-18days on market $145,000 Active 106 DOM
-
2026-06-17days on market $145,000 Active 105 DOM
-
2026-06-16days on market $145,000 Active 104 DOM
-
2026-06-15days on market $145,000 Active 103 DOM
-
2026-06-14days on market $145,000 Active 101 DOM
-
2026-06-13days on market $145,000 Active 100 DOM
-
2026-06-10days on market $145,000 Active 98 DOM
-
2026-06-09days on market $145,000 Active 97 DOM
-
2026-06-08days on market $145,000 Active 96 DOM
-
2026-06-07days on market $145,000 Active 95 DOM
-
2026-06-05days on market $145,000 Active 92 DOM
-
2026-06-03days on market $145,000 Active 91 DOM
-
2026-06-02days on market $145,000 Active 90 DOM
-
2026-06-01days on market $145,000 Active 89 DOM
-
2026-05-31days on market $145,000 Active 88 DOM
-
2026-05-30days on market $145,000 Active 87 DOM
-
2026-03-04$145,000 Active 895-char remark
Show marketing remark (895 chars)
Zoned O-2 and located just blocks from downtown, this property is packed with opportunity. The existing home could be renovated and brought back to life, or a builder could take advantage of the lot and start fresh with new construction. The O-2 zoning allows for a wide range of possibilities including commercial use, short-term rentals, and a variety of mixed-use options, making it an attractive opportunity for investors, developers, or business owners. Alley access at the rear of the property adds valuable flexibility for parking, access, or future building options. The location is another major highlight, with a new coffee shop planned just two blocks away and additional walkable retail and neighborhood amenities in the works nearby. As this pocket near downtown continues to grow and improve, properties like this offer a rare chance to get in early and capitalize on the momentum.
-
2024-09-20soldstatus
-
2024-09-19soldstatus 945-char remark
Show marketing remark (945 chars)
House and Vacant Lot Investors Package Deal - Zoned O-2 - This home on 603 N. 10th is being sold as a package deal with the vacant lot directly next to it at 529 N. 10th. This real estate defines the value of "location, location, location". 603 N. 10th is an easy 4 minute drive to Magnolia Market and the rest of Downtown Waco, 6 minutes to Baylor University, 6 minutes to Foster Pavilion (Baylor Basketball Arena), and 6 minutes to McLane Stadium (Baylor Football). Located in the O-2 district, permitted uses for this location might include single-family dwellings, single-family attached (zero lot line) dwellings, two-family dwellings, duplexes, townhouse dwellings, multiple-family dwellings, office space, apartment hotels, short term rental type l and ll, and more. Pursue the possibilities of renovating this home, adding on to it, or removing it entirely to create exactly what you want on this lot as well as on 529 N. 10th.
-
2024-06-14$149,000 945-char remark
Show marketing remark (945 chars)
House and Vacant Lot Investors Package Deal - Zoned O-2 - This home on 603 N. 10th is being sold as a package deal with the vacant lot directly next to it at 529 N. 10th. This real estate defines the value of "location, location, location". 603 N. 10th is an easy 4 minute drive to Magnolia Market and the rest of Downtown Waco, 6 minutes to Baylor University, 6 minutes to Foster Pavilion (Baylor Basketball Arena), and 6 minutes to McLane Stadium (Baylor Football). Located in the O-2 district, permitted uses for this location might include single-family dwellings, single-family attached (zero lot line) dwellings, two-family dwellings, duplexes, townhouse dwellings, multiple-family dwellings, office space, apartment hotels, short term rental type l and ll, and more. Pursue the possibilities of renovating this home, adding on to it, or removing it entirely to create exactly what you want on this lot as well as on 529 N. 10th.
-
2023-05-31soldstatus
-
2023-05-26soldstatus
-
2023-02-11$125,000
ⓘ Source: listings_history table (triggers on properties + properties_extension) + one-shot
backfill from property_details.listing_events for pre-trigger history.
Tax reassessment forecast TX · Resets to sale price
- Current annual tax
- $2,776 · $231/mo
- Projected year-2 tax
- $2,776 · $231/mo
- Expected delta
- $0/yr ($0/mo · 0.0%)
ⓘ Screening estimate from a state-policy table — verify with the county assessor before closing.
Climate risk First Street
- Flood 1/10 Low FEMA zone X (unshaded) · 0% chance over 30 yrs
- Wildfire 1/10 Low
- Heat 7/10 Severe 7 d/yr ≥109°F today · 22 d/yr by 30 yrs out
- Wind 6/10 Major 56% chance of damaging wind over 30 yrs
- Air quality 2/10 Low 0 unhealthy d/yr today · 1 by 30 yrs out
Nearby sold comps map
Loading sold comps map…
Walkable amenities ~0.75 mi
Loading nearby amenities…
Taxation est. · year 1
- Rental income
- $13,255
- − Mortgage interest
- −$8,122
- − Property taxes
- −$2,776
- − Insurance
- −$725
- − Repairs & maintenance
- −$1,060
- − Management
- −$1,060
- − Depreciation
- −$4,218
- Taxable loss
- −$4,707
- Est. tax savings @ 24.0%
- +$1,130
- After-tax cash flow
- $-1,024/yr
For passive investors: Depreciation is non-cash, so a rental often shows a tax loss while cash-flowing — sheltering income. Rental losses are passive: they offset passive income freely, and up to $25,000/yr can offset ordinary (W-2) income if you actively participate and your MAGI is under $100k (phasing out to $0 by $150k); unused losses carry forward. On sale, claimed depreciation is recaptured at up to 25%, and gains may owe capital-gains tax (a 1031 exchange can defer both). Figures are a year-1 estimate at your 24.0% rate — not tax advice; consult a CPA.
Schools (NCES district)
- District
- Waco ISD
- NCES district ID
- 4844280
- Math proficiency
- 20% ▼ -14.00%
- Reading proficiency
- 24% ▼ -6.00%
- Median HH income
- $29,208
- Composite
- 17.57/100
- National rank
- #9043
- State rank
- #773 of 826 in TX
Livability — Waco
- Score
- 74/100
- State rank
- #166
- US rank
- #4378
Category grades
Schools grade is shown separately in the Schools card above.
Census & demographics
- Census place
- Waco, TX
- City population
- 125,319
- Population (ZIP)
- 1,732
Population outlook (McLennan County) Hauer SSP2
- Today (2025)
- 264,191 people
- By 2030
- 273,578 · +3.6%
- By 2040
- 291,506 · +10.3%
- By 2050
- 308,044 · +16.6%
- By 2075
- 349,648 · +32.3%
- By 2100
- 364,779 · +38.1%
Race, ethnicity, and origin ACS 2023
- Neighborhood character
- Diverse neighborhood (Simpson 0.69)
- Race & ethnicity
- White 42% Black 27% Hispanic / Latino 24% Two or more races 13% Asian 1%
- Hispanic origin (detail)
- Mexican 20%
- Common ancestry
- Lithuanian 3% Portuguese 1% Slovak 1%
- Foreign-born
- 5% · Canada, South Korea
- Languages at home
- 84% English-only · Spanish 13% Other Indo-European 3%
Political lean MEDSL · McLennan
- 2024 margin
- Solid R (+30.9) · D 34.0% · R 64.9% · Other 1.0%
- 2008→2024 swing
- -7.0pp toward R · 2008: -23.9pp · 2024: -30.9pp
- All cycles
- 2024: R+30.9 2020: R+23.4 2016: R+27.1 2012: R+29.8 2008: R+23.9
Not yet ingested
- Civics
- —
Market trends
- HPI YoY
- ▲ 14.55%
- Current HPI
- 409.2967
- Rent YoY
- —
- Metro
- —
- State GDP YoY
- ▲ 3.95%
- F500 in state
- 110
Industry mix (Fortune 500 HQ in TX)
| Industry | F500 HQs | Revenue |
|---|---|---|
| Energy | 16 | $1,198B |
|
||
| Technology | 5 | $198B |
|
||
| Engineering / Construction | 4 | $72B |
|
||
| Energy Services | 3 | $60B |
|
||
| Utilities | 3 | $41B |
|
||
| Healthcare | 2 | $330B |
|
||
Price history
+16.0% since first listed7 events — show timeline
- 2026-03-04 Listed $145,000 NTREIS
- 2024-09-20 Sold (Public Records) — Public Records
- 2024-09-19 Sold (MLS) — NTREIS
- 2024-06-14 Listed $149,000 NTREIS
- 2023-05-31 Sold (Public Records) — Public Records
- 2023-05-26 Sold (MLS) — NTREIS
- 2023-02-11 Listed $125,000 NTREIS
Property tax history
+15.6%/yrLatest (2025): $2,776 · +4.8% YoY. Source: county tax records.
Cash-flow waterfall
monthlySold comps — $/sqft
last 12 mo · ≤1 miLoading sold comps…