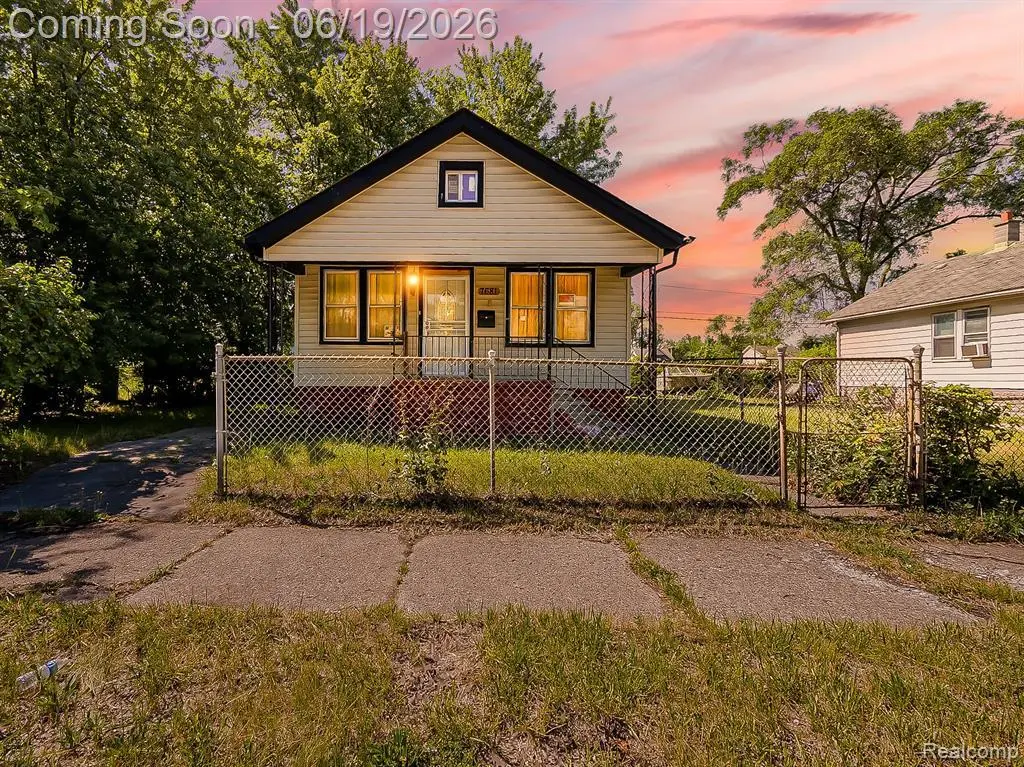
7681 Ellsworth St · Detroit, MI
Flood risk 1/10 · Minimal
- FEMA flood zone
- X (unshaded)
- Chance of flooding over 30 yrs
- 0.0%
- Est. flood insurance / yr
- $473 – $860
Fire risk 1/10 · Minimal
- Est. fire insurance / yr
- $784 – $1,456
Heat risk 3/10 · Minor
- Hot days now (above 97°F)
- 7 days/yr
- Hot days in 30 yrs
- 15 days/yr
Wind risk 2/10 · Minimal
- Chance of severe wind over 30 yrs
- —
Air-quality risk 4/10 · Minor
- Unhealthy air days now
- 4 days/yr
- Unhealthy air days in 30 yrs
- 6 days/yr
Risk factors via First Street. Map © Google.
Why this score? — see what drove the C- grade
The composite is a weighted blend of 9 inputs, each scored 0–100. Each bar is that input's sub-score; the figure is the points it added to the 100-point composite (weight × sub-score).
- Cash flow +15.0/30.0
- ARV discount +15.0/15.0
- 1% rule +5.0/10.0
- DSCR +5.0/10.0
- Appreciation +5.0/10.0
- Livability +3.7/5.0
- Rent growth +2.5/5.0
- Condition / age +2.5/5.0
- Schools +1.3/10.0
$20,000
🖨 Deal sheet 📄 Offer letter ✓ Due diligence
Listing remarks MLS
Charming 2-bedroom, 1 full bath home featuring refinished hardwood floors and thoughtful updates throughout. Recent improvements include new plumbing in the basement, a new front entrance security door, and a new front entrance exterior door. Additional highlights include glass block windows and a spacious backyard, offering plenty of room to enjoy outdoor activities and everyday living.
Key facts
- New plumbing
- Spacious backyard
- Glass block windows
Tags
Property features AI
Exterior
- Parking: Detached garage with 1 parking space
- Utilities: Public water; Natural gas; Forced air heating
- Home design: Residential 1 1/2-story; Built in 1924
- Construction: Basement foundation; Below-grade area: 704 (basement)
- Exterior features: Brick exterior; Paved street access; Frontage: 30 feet
Interior
- Kitchen: Kitchen (Entry level) — 11 x 9; Dining room (Entry level) — 11 x 11
- Bedrooms: Bedroom 1 (Entry level) — 9 x 9; Bedroom 2 (Second level) — 13 x 9
- Bathrooms: 1 full bathroom (Entry level) — 9 x 9
- Heating & cooling: Forced air heating; Natural gas fuel
- Interior features: 6 total rooms; Unfinished basement
- Laundry & utility: Basement present (unfinished)
Neighborhood map
What this means for you Summary
Snapshot
- This is a 2-bed/1.0-bath single-family listed at $20k.
Deal economics
- At list price, monthly cash flow is $547 ($7k/yr) — positive.
- The deal already cash-flows at list — no discount required.
- Meets the 1% rule at list price ($867 rent vs $20k).
- Cap rate 39.1% vs local median 10.2% in Detroit — top-decile yield for the area; either an underpriced asset or a hidden risk that comps aren't pricing in. Stress-test before assuming the spread holds.
Location & tenants
- Location reads 73/100 on livability (#218 in MI) — a middle-class / working-renter tenant base. Strengths: amenities A+, commute A+, cost of living A+; Watch: schools F, crime F, employment F.
- Detroit Public Schools Community District (urban): math 10% / reading 24% proficiency, ranked #499 of 540 in MI (top 92%) — low school quality limits family demand, transient renter base, plan for 1-2y turnover; 90% free/reduced lunch — lower-income household profile, screen leases tightly.
- Market conditions: 1 active listings in the ZIP; 15 comparable units currently listed for rent nearby; rentals at typical pace (median 24d on market — plan ~3-4 weeks tenant-placement turnaround); 47% of comp listings sitting > 30 days — soft ceiling on asking rent; 2,639 units permitted in Wayne County in 2024 (1,216 in 5+ unit buildings).
Forward outlook
- In year one you build about $738 of equity ($138 loan paydown + $600 appreciation (3.0% local appreciation)).
- Wayne County population projected at -17% by 2050 — secular population decline; favor cash flow + early exit over multi-decade hold.
- At projected returns (3.0% appreciation + 3.0% rent growth), your $6k cash investment doubles in ~1 year — after that, you're playing with house money.
Negotiation context
- Only 1 days on market — expect competitive offers; lowballing is unlikely to land.
- 5 sale attempts since 5y ago with the ask held roughly flat each time — persistent listings suggest the price (not the market) is what's stuck; bring a comps-based counter.
Risks & watch-outs
- Watch-outs: built in 1924 — expect roof / HVAC / electrical / plumbing capex.
Questions for the listing agent
- Built in 1924 — when were the roof, HVAC, electrical panel, plumbing, and water heater last replaced?
- Is there a deadline driving the sale (1031 exchange, divorce, estate, relocation)? That informs how much negotiation room exists.
- Schools are F-rated, which usually means shorter tenancies and higher turnover. Who's the typical renter profile here, and what's been the actual vacancy rate?
- Crime grade is F in this area — have there been break-ins, vandalism, or insurance claims at this property in the last 3 years? What carrier currently insures it and at what premium?
- What's the average days-on-market for RENTAL listings here right now (not sales)? A rising rental-DOM trend means longer vacancies and softer asking-rent achievability than the comps imply.
- What's the recent tenant-quality profile in this submarket — average credit score on applications, eviction rate, late-payment / NSF rate, and stable-employment percentage? A property-management company in the area should have these aggregated.
- How much new for-sale + rental construction is in the pipeline within 1–3 miles? Heavy new supply typically softens prices + rents 12–24 months out; constrained supply supports both.
Investment metrics
- 1% rule
- 4.33% ✓
- Cap rate
- 39.09%
- Cash-on-cash
- 117.13%
- DSCR
- 6.21
- GRM
- 1.9
CMA / ARV
- ARV (on-the-fly)
- $32,384
- Comps found
- 6
Show comp detail 6 sales within ~0.75 mi
| Address | Dist | Beds/Ba | Sqft | Sold | Price | $/sf | Match |
|---|---|---|---|---|---|---|---|
| 14830 Greenlawn St | 0.24mi | 2/1.0 | 672 (-4%) | 13mo | $15,000 | $22 | 71 |
| 7326 Ellsworth St | 0.22mi | 2/1.0 | 756 (+7%) | 13mo | $35,000 | $46 | 67 |
| 14619 Greenlawn St | 0.34mi | 2/1.0 | 804 (+14%) | 5mo | $52,000 | $65 | 56 |
| 14890 Holmur St | 0.62mi | 2/1.0 | 779 (+11%) | 10mo | $40,598 | $52 | 45 |
| 6445 SW Globe St S | 0.42mi | 2/1.0 | 795 (+13%) | 18mo | $30,000 | $38 | 43 |
| 14611 Washburn St | 0.72mi | 2/1.0 | 790 (+12%) | 10mo | $34,900 | $44 | 37 |
Match score weights: distance 35% · size 25% · config 20% · recency 20%. Top-matched comps best support the ARV.
Projected returns pro-forma
3.0% appreciation · 3.0% rent growth · sell at horizon
- IRR
- —
- Equity multiple
- 7.65×
- Total profit
- $37,235
- Equity at exit
- $8,993
- IRR
- —
- Equity multiple
- 15.96×
- Total profit
- $83,786
- Equity at exit
- $13,859
Cash invested: $5,600 (down + closing). Projections, not guarantees.
Landlord ↔ Tenant lean methodology
- Overall (STATE)
- 62 Landlord-Friendly
- State Michigan
- 62 Landlord-Friendly · EVEN
- County
- — inherits STATE
- City
- — inherits STATE
ZIP-level market 48238 1928
- Active inventory
- 1
- Price-to-rent
- 1.9×
Monthly cashflow live
- Estimated rent
- $867 high interval (Pro) →
- Mortgage (P&I)
- −$105
- Tax est. 1.5%
- −$25 /mo · $300/yr
- Insurance
- −$8
- HOA
- −$0
- Vacancy / Maint / Mgmt
- −$182
- Net cashflow
- $547
Break-even live
UW: 25.0% down · 7.5% · 30yr · 1.5% tax · 5.0% vac · 8.0% maint · 8.0% mgmt
Financing live
Cash to close
- Down payment
- $5,000
- Closing costs
- $600
- Reserves months
- —
- Total cash needed
- —
Loan-product check · same deal, 3 products live
Conventional
25% down · 7.5% · 30yr
- Down + closing
- —
- Monthly P&I
- —
- Monthly cashflow
- —
- DSCR
- —
- Eligible?
- —
Personal DTI + credit; lowest rate.
DSCR
20% down · 8.5% · 30yr
- Down + closing
- —
- Monthly P&I
- —
- Monthly cashflow
- —
- DSCR
- —
- Eligible?
- —
No personal income docs; deal must DSCR.
Hard money
10% down · 12.0% · 12mo
- Down + closing
- —
- Monthly P&I
- —
- Monthly cashflow
- —
- DSCR
- —
- Eligible?
- —
Short-term bridge; refi at stabilization.
Rent comps 15 comps
| Address | Beds | Baths | Sqft | Rent | $/sqft | DOM | Units | Dist |
|---|---|---|---|---|---|---|---|---|
| 14950 Stoepel St Detroit, MI | 2.0 | 1.0 | 600 | $900 | $1.50 | 24d | 1 | 0.38mi |
| 3808 Kendall St Unit 3 Detroit, MI | 1.0 | 1.0 | 550 | $700 | $1.27 | 43d | 1 | 0.82mi |
| 2690 Ewald Cir Detroit, MI | 1.0–2.0 | 1.0 | 750 | $900 | $1.20 | 24d | 4 | 0.83mi |
| 2341 Ewald Cir Unit 3 Detroit, MI | 1.0 | 1.0 | 600 | $900 | $1.50 | 43d | 1 | 0.89mi |
| 3700 Pasadena St Unit 8 Detroit, MI | 1.0 | 1.0 | 500 | $775 | $1.55 | 24d | 1 | 1.03mi |
| 1875 Ewald Cir Unit 2E Detroit, MI | 1.0 | 1.0 | 725 | $875 | $1.21 | 4d | 1 | 1.07mi |
| 3266 Pasadena St Unit 3 Detroit, MI | 1.0 | 1.0 | 696 | $700 | $1.01 | 43d | 1 | 1.09mi |
| 1705 Oakman Blvd Unit 10 Detroit, MI | 1.0 | 1.0 | 650 | $895 | $1.38 | 23d | 1 | 1.18mi |
| 1705 Oakman Blvd Unit 5 Detroit, MI | 1.0 | 1.0 | 650 | $895 | $1.38 | 43d | 1 | 1.18mi |
| 3235 W Grand St Detroit, MI | 2.0 | 1.0 | 500 | $850 | $1.70 | 14d | 1 | 1.18mi |
| 12728 Monica St Unit 2 Detroit, MI | 1.0 | 1.0 | 620 | $750 | $1.21 | 43d | 1 | 1.34mi |
| 2952 Waverly St Unit 2W Detroit, MI | 1.0 | 1.0 | 439 | $750 | $1.71 | 10d | 1 | 1.37mi |
| 12663 Stoepel St Unit 1 Detroit, MI | 2.0 | 1.0 | 750 | $975 | $1.30 | 17d | 1 | 1.42mi |
| 2623 W McNichols Rd Unit 23106 Detroit, MI | 1.0 | 1.0 | 750 | $1,075 | $1.43 | 43d | 1 | 1.43mi |
| 2433 Pasadena St Unit 2435 Detroit, MI | 2.0 | 1.0 | 700 | $1,025 | $1.46 | 43d | 1 | 1.43mi |
Listing history 2 events
-
2026-06-18remarks 390-char remark
-
2026-06-18$20,000 Coming Soon 1 DOM
ⓘ Source: listings_history table (triggers on properties + properties_extension) + one-shot
backfill from property_details.listing_events for pre-trigger history.
Climate risk First Street
- Flood 1/10 Low FEMA zone X (unshaded) · 0% chance over 30 yrs
- Wildfire 1/10 Low
- Heat 3/10 Moderate 7 d/yr ≥97°F today · 15 d/yr by 30 yrs out
- Wind 2/10 Low
- Air quality 4/10 Moderate 4 unhealthy d/yr today · 6 by 30 yrs out
Nearby sold comps map
Loading sold comps map…
Walkable amenities ~0.75 mi
Loading nearby amenities…
Taxation est. · year 1
- Rental income
- $10,402
- − Mortgage interest
- −$1,120
- − Property taxes
- −$300
- − Insurance
- −$100
- − Repairs & maintenance
- −$832
- − Management
- −$832
- − Depreciation
- −$582
- Taxable income
- $6,636
- Est. tax owed @ 24.0%
- −$1,593
- After-tax cash flow
- $4,967/yr
For passive investors: Depreciation is non-cash, so a rental often shows a tax loss while cash-flowing — sheltering income. Rental losses are passive: they offset passive income freely, and up to $25,000/yr can offset ordinary (W-2) income if you actively participate and your MAGI is under $100k (phasing out to $0 by $150k); unused losses carry forward. On sale, claimed depreciation is recaptured at up to 25%, and gains may owe capital-gains tax (a 1031 exchange can defer both). Figures are a year-1 estimate at your 24.0% rate — not tax advice; consult a CPA.
Schools (NCES district)
- District
- Detroit Public Schools Community District
- NCES district ID
- 2601103
- Math proficiency
- 10% ▼ -2.00%
- Reading proficiency
- 24% ▲ 6.00%
- Median HH income
- $25,815
- Composite
- 13.06/100
- National rank
- #9564
- State rank
- #499 of 540 in MI
Livability — Detroit
- Score
- 73/100
- State rank
- #218
- US rank
- #5427
Category grades
Schools grade is shown separately in the Schools card above.
Census & demographics
- Census place
- Detroit, MI
Population outlook (Wayne County) Hauer SSP2
- Today (2025)
- 1,675,273 people
- By 2030
- 1,620,300 · -3.3%
- By 2040
- 1,502,341 · -10.3%
- By 2050
- 1,384,039 · -17.4%
- By 2075
- 1,124,592 · -32.9%
- By 2100
- 881,193 · -47.4%
Not yet ingested
- Political lean
- —
- Race & ethnicity
- —
- Common origin
- —
- Civics
- —
Market trends
- HPI YoY
- —
- Current HPI
- —
- Rent YoY
- —
- Metro
- —
- State GDP YoY
- ▲ 1.37%
- F500 in state
- 28
Industry mix (Fortune 500 HQ in MI)
| Industry | F500 HQs | Revenue |
|---|---|---|
| Automotive Parts | 3 | $48B |
|
||
| Automotive | 2 | $372B |
|
||
| Chemicals | 1 | $45B |
|
||
| Automotive Retail | 1 | $29B |
|
||
| Healthcare / Medical Devices | 1 | $23B |
|
||
| Automotive Technology | 1 | $20B |
|
||
Price history
-4.8% since first listed11 events — show timeline
- 2026-06-19 Listed $20,000 MiRealSource-MiMLS
- 2026-06-19 Listed $20,000 REALCOMP
- 2026-06-18 Coming Soon $20,000 MiRealSource-MiMLS
- 2021-09-10 Sold (MLS) $21,000 MiRealSource-MiMLS
- 2021-09-10 Sold (MLS) $21,000 REALCOMP
- 2021-08-12 Pending — REALCOMP
- 2021-08-12 Relisted — REALCOMP
- 2021-08-11 Pending — REALCOMP
- 2021-08-11 Pending — MiRealSource-MiMLS
- 2021-07-21 Listed $21,000 MiRealSource-MiMLS
- 2021-07-21 Listed $21,000 REALCOMP
Property tax history
+10.9%/yrLatest (2025): $1,768 · +32.2% YoY. Source: county tax records.
Cash-flow waterfall
monthlySold comps — $/sqft
last 12 mo · ≤1 miLoading sold comps…