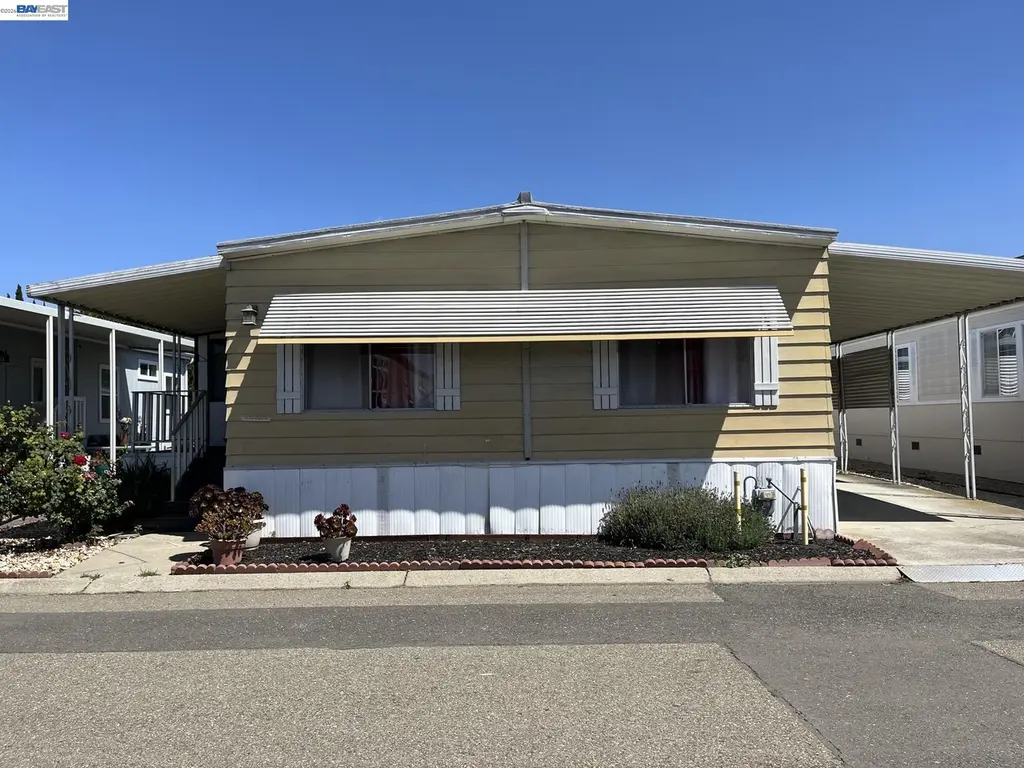
1345 Chelsea Way · Hayward, CA
Flood risk 4/10 · Minor
- FEMA flood zone
- AH
- Chance of flooding over 30 yrs
- 0.21%
- Est. flood insurance / yr
- $1,142 – $2,507
Fire risk 1/10 · Minimal
- Est. fire insurance / yr
- $659 – $1,223
Heat risk 4/10 · Minor
- Hot days now (above 89°F)
- 7 days/yr
- Hot days in 30 yrs
- 14 days/yr
Wind risk 1/10 · Minimal
- Chance of severe wind over 30 yrs
- —
Air-quality risk 7/10 · Major
- Unhealthy air days now
- 12 days/yr
- Unhealthy air days in 30 yrs
- 12 days/yr
Risk factors via First Street. Map © Google.
Why this score? — see what drove the B+ grade
The composite is a weighted blend of 9 inputs, each scored 0–100. Each bar is that input's sub-score; the figure is the points it added to the 100-point composite (weight × sub-score).
- Cash flow +30.0/30.0
- ARV discount +15.0/15.0
- 1% rule +10.0/10.0
- DSCR +10.0/10.0
- Livability +3.8/5.0
- Rent growth +3.1/5.0
- Schools +3.1/10.0
- Condition / age +2.5/5.0
- Appreciation +0.0/10.0
$189,900
🖨 Deal sheet 📄 Offer letter ✓ Due diligence
Listing remarks MLS
New Price!! . Wow!! Look at this. A 2 bedroom 2 bath Mobil home located in a senior park in Hayward with low space rent (under rent control) and close to San Mateo and dumbarten bridges, plus Shopping, Bart, and many restaurants !! Clubhouse with Pool, Pool room, and many activities. Independent living at it's best!! This unit is located in the much sought after park..Georgian Manor Mobil Home park. Open floor plan with new kitchen appliances and 1440 Sq. feet of living space. ( Low space rent of $707 includes water, garbage and sewer. )
Key facts
- Kitchen with island
- Garden space
- Community pool
Tags
Property features AI
Finance
- HOA & community: Senior community; Park name: GEORGIAN MANOR; Pets allowed (cats and dogs OK; number limit; upon approval)
Exterior
- Parking: Carport; Awning over car; Carport for 2 or more; Tandem parking
- Utilities: Public water; Public sewer
- Home design: Manufactured in park (mobile home); Double wide; Model: Glenbrook
- Construction: Metal siding; Metal skirt
- Exterior features: Back yard; Side yard; Community pool; Clubhouse; Greenbelt
Interior
- Kitchen: Laminate counters; Dishwasher; Gas range / cooktop; Refrigerator
- Bedrooms: 2 bedrooms (street level)
- Flooring: Linoleum; Carpet
- Bathrooms: 2 full bathrooms; Primary bathroom with stall shower, sunken tub, fiberglass; Other bathroom(s) with shower over tub
- Heating & cooling: Forced air heating (natural gas); No air conditioning
- Interior features: Dining area; Family room
- Laundry & utility: Dedicated laundry room; Gas water heater
Neighborhood map
What this means for you Summary
Snapshot
- This is a 2-bed/2.0-bath manufactured listed at $190k.
Deal economics
- At list price, monthly cash flow is $991 ($12k/yr) — positive.
- The deal already cash-flows at list — no discount required.
- Meets the 1% rule at list price ($3k rent vs $190k).
- Recommended offer: $187k (1.5% below list) — sets the bar for market timing.
- Cap rate 13.5% vs local median 2.1% in Hayward — top-decile yield for the area; either an underpriced asset or a hidden risk that comps aren't pricing in. Stress-test before assuming the spread holds.
Location & tenants
- Location reads 75/100 on livability (#124 in CA, #4,294 nationally) — a middle-class / working-renter tenant base. Strengths: commute A+, employment A+, health & safety A+; Watch: schools D, crime F, cost of living F.
- Hayward Unified (urban): math 25% / reading 37% proficiency, ranked #935 of 1,400 in CA (top 67%) — families likely to look elsewhere, expect single-tenant / working-renter base with shorter leases; 61% free/reduced lunch — lower-income household profile, screen leases tightly.
- Market conditions: Rents rising (+2.6%/yr); 169 active listings in the ZIP; 28 comparable units currently listed for rent nearby; rentals leasing fast (median 13d on market — plan ~1-2 weeks tenant-placement turnaround); solid renter incomes; 1,742 units permitted in Alameda County in 2024 (856 in 5+ unit buildings).
- This rent runs 35% of the median local income ($108k/yr) — at the standard rent-burdened threshold; future hikes will face affordability resistance.
Forward outlook
- Local home prices are declining (-3.0%/yr); year-one equity from $1k of loan paydown is wiped out by about $6k of value loss. Plan a longer hold.
- Alameda County population projected at +34% by 2050 — long-run rental-demand tailwind backs the buy-and-hold thesis.
- At projected returns (-3.0% appreciation + 2.6% rent growth), your $53k cash investment doubles in ~6 years — after that, you're playing with house money.
Negotiation context
- It's been on market 16 days — a 2% lower offer ($187k) is reasonable based on typical stale-listing flexibility.
- 3 sale attempts since 9y ago with the ask held roughly flat each time — persistent listings suggest the price (not the market) is what's stuck; bring a comps-based counter.
- Current owner paid $165k; 15% above their basis — modest negotiation headroom, anchor on the comps not their cost.
Risks & watch-outs
- Watch-outs: flood insurance adds $152/mo.
- Climate carrying-cost: in FEMA flood zone AH (mandatory federal flood insurance) — expect insurance premiums to compound above CPI over the hold.
Questions for the listing agent
- Built in 1975 — when were the roof, HVAC, electrical panel, plumbing, and water heater last replaced?
- What's the actual annual flood-insurance premium (NFIP or private), and is the property in a SFHA with mandatory coverage?
- Is there a deadline driving the sale (1031 exchange, divorce, estate, relocation)? That informs how much negotiation room exists.
- Schools are D-rated, which usually means shorter tenancies and higher turnover. Who's the typical renter profile here, and what's been the actual vacancy rate?
- Crime grade is F in this area — have there been break-ins, vandalism, or insurance claims at this property in the last 3 years? What carrier currently insures it and at what premium?
- What's the average days-on-market for RENTAL listings here right now (not sales)? A rising rental-DOM trend means longer vacancies and softer asking-rent achievability than the comps imply.
- What's the recent tenant-quality profile in this submarket — average credit score on applications, eviction rate, late-payment / NSF rate, and stable-employment percentage? A property-management company in the area should have these aggregated.
- How much new for-sale + rental construction is in the pipeline within 1–3 miles? Heavy new supply typically softens prices + rents 12–24 months out; constrained supply supports both.
Investment metrics
- 1% rule
- 1.64% ✓
- Cap rate
- 13.52%
- Cash-on-cash
- 25.80%
- DSCR
- 2.15
- GRM
- 5.1
CMA / ARV
- ARV (on-the-fly)
- $280,800
- Comps found
- 12
Show comp detail 12 sales within ~0.75 mi
| Address | Dist | Beds/Ba | Sqft | Sold | Price | $/sf | Match |
|---|---|---|---|---|---|---|---|
| 1438 Buckingham Way | 0.15mi | 2/2.0 | 1,440 (0%) | 2mo | $270,000 | $188 | 92 |
| 29050 S Westminster | 0.23mi | 2/2.0 | 1,440 (0%) | 5mo | $259,000 | $180 | 86 |
| 1352 Chelsea Way | 0.02mi | 2/2.0 | 1,296 (-10%) | 5mo | $200,000 | $154 | 78 |
| 1439 Almeria Dr | 0.20mi | 2/2.0 | 1,368 (-5%) | 7mo | $209,900 | $153 | 77 |
| 29255 Harpoon Way | 0.51mi | 2/2.0 | 1,440 (0%) | 1mo | $265,000 | $184 | 75 |
| 29413 Sandburg Way | 0.36mi | 2/2.0 | 1,380 (-4%) | 5mo | $327,000 | $237 | 72 |
| 1580 Balein Ct #14 | 0.39mi | 3/2.0 (+1) | 1,458 (+1%) | 6mo | $350,000 | $240 | 70 |
| 29043 Windemere | 0.09mi | 3/2.0 (+1) | 1,260 (-12%) | 3mo | $319,000 | $253 | 67 |
| 29424 Providence Way | 0.49mi | 3/2.0 (+1) | 1,404 (-2%) | 2mo | $399,800 | $285 | 67 |
| 1400 Buckingham Way | 0.15mi | 3/2.0 (+1) | 1,607 (+12%) | 6mo | $385,000 | $240 | 63 |
| 29315 Harpoon Way | 0.53mi | 2/2.0 | 1,334 (-7%) | 1mo | $255,000 | $191 | 62 |
| 29330 Middleborough Way | 0.45mi | 3/3.0 (+1) | 1,640 (+14%) | 2mo | $319,000 | $195 | 46 |
Match score weights: distance 35% · size 25% · config 20% · recency 20%. Top-matched comps best support the ARV.
Projected returns pro-forma
-3.0% appreciation · 2.58% rent growth · sell at horizon
- IRR
- 14.7%
- Equity multiple
- 1.59×
- Total profit
- $31,183
- Equity at exit
- $28,315
- IRR
- 23.1%
- Equity multiple
- 2.95×
- Total profit
- $103,681
- Equity at exit
- $16,419
Cash invested: $53,172 (down + closing). Projections, not guarantees.
Landlord ↔ Tenant lean methodology
- Overall (STATE)
- 18 Strongly Tenant-Friendly
- State California
- 18 Strongly Tenant-Friendly · D+13
- County
- — inherits STATE
- City
- — inherits STATE
ZIP-level market 94544
- Rents YoY
- 2.6%
- Active inventory
- 169
- Price-to-rent
- 5.1×
Monthly cashflow live
- Estimated rent
- $3,108 high interval (Pro) →
- Mortgage (P&I)
- −$996
- Tax est. 1.5%
- −$237 /mo · $2,848/yr
- Insurance
- −$79
- Flood insurance flood zone
- −$152 /mo · $1,824/yr
- HOA
- −$0
- Vacancy / Maint / Mgmt
- −$653
- Net cashflow
- $991
Break-even live
UW: 25.0% down · 7.5% · 30yr · 1.5% tax · 5.0% vac · 8.0% maint · 8.0% mgmt
Financing live
Cash to close
- Down payment
- $47,475
- Closing costs
- $5,697
- Reserves months
- —
- Total cash needed
- —
Loan-product check · same deal, 3 products live
Conventional
25% down · 7.5% · 30yr
- Down + closing
- —
- Monthly P&I
- —
- Monthly cashflow
- —
- DSCR
- —
- Eligible?
- —
Personal DTI + credit; lowest rate.
DSCR
20% down · 8.5% · 30yr
- Down + closing
- —
- Monthly P&I
- —
- Monthly cashflow
- —
- DSCR
- —
- Eligible?
- —
No personal income docs; deal must DSCR.
Hard money
10% down · 12.0% · 12mo
- Down + closing
- —
- Monthly P&I
- —
- Monthly cashflow
- —
- DSCR
- —
- Eligible?
- —
Short-term bridge; refi at stabilization.
Rent comps 28 comps
| Address | Beds | Baths | Sqft | Rent | $/sqft | DOM | Units | Dist |
|---|---|---|---|---|---|---|---|---|
| 28187 Karn Dr Hayward, CA | 3.0 | 2.5 | 1335 | $3,300 | $2.47 | 5d | 1 | 0.42mi |
| 720 W Tennyson Rd Hayward, CA | 3.0 | 1.0–2.0 | 630 | $2,805 | $4.45 | 1d | 1 | 0.58mi |
| 29189 Lassen St Hayward, CA | 3.0 | 2.0 | 1180 | $3,500 | $2.97 | 43d | 1 | 0.74mi |
| 27500 Tampa Ave Unit 85 Hayward, CA | 2.0 | 1.5 | 950 | $2,275 | $2.39 | 14d | 1 | 0.75mi |
| 34 Ballard Ct Hayward, CA | 2.0 | 1.0 | 1000 | $2,400 | $2.40 | 43d | 1 | 0.78mi |
| 27162 Tampa Ave #70 Hayward, CA | 2.0 | 1.0 | 977 | $2,550 | $2.61 | 3d | 1 | 0.91mi |
| 981 Cheryl Ann Cir #40 Hayward, CA | 3.0 | 2.0 | 1245 | $3,800 | $3.05 | 43d | 1 | 0.97mi |
| 317 Tennyson Rd Hayward, CA | 3.0 | 1.0 | 1050 | $3,395 | $3.23 | 12d | 1 | 0.98mi |
| 27427 Stoneridge Ct Hayward, CA | 2.0 | 1.5 | 1008 | $2,500 | $2.48 | 43d | 1 | 1.04mi |
| 27703 Persimmon Dr Hayward, CA | 3.0 | 3.0 | 1549 | $3,695 | $2.39 | 43d | 1 | 1.05mi |
| 29163 Dixon St Hayward, CA | 2.0–3.0 | 1.0–1.5 | 1100 | $2,995 | $2.72 | 1d | 5 | 1.05mi |
| 111 Notion Way Hayward, CA | 3.0 | 2.5 | 1718 | $4,250 | $2.47 | 43d | 1 | 1.05mi |
| 29289 Dixon St Hayward, CA | 2.0 | 1.0–2.0 | 990 | $2,285 | $2.31 | 23d | 2 | 1.06mi |
| 27070 Manon Ave Unit 6A Hayward, CA | 2.0 | 1.0 | 900 | $2,200 | $2.44 | 43d | 1 | 1.15mi |
| 28850 Dixon St Hayward, CA | 1.0–2.0 | 1.0–2.0 | 906 | $3,406 | $3.76 | 1d | 10 | 1.17mi |
| 376 Line St Hayward, CA | 2.0 | 2.0 | 1286 | $3,500 | $2.72 | 1d | 1 | 1.18mi |
| 27033 Belvedere Ct Apt 8 Hayward, CA | 2.0 | 2.0 | 900 | $2,400 | $2.67 | 24d | 1 | 1.19mi |
| 655 Tennyson Rd Hayward, CA | 1.0–2.0 | 1.0–2.0 | 838 | $3,169 | $3.78 | 2d | 7 | 1.20mi |
| 29384 Hub Ln Hayward, CA | 3.0 | 2.5 | 1684 | $3,950 | $2.35 | 3d | 1 | 1.22mi |
| 29384 Hub Ln Hayward, CA | 3.0 | 2.5 | 1684 | $3,950 | $2.35 | 1d | 1 | 1.22mi |
| 2901 Sorrento Way Union City, CA | 3.0 | 2.5 | 1869 | $5,000 | $2.68 | 1d | 1 | 1.25mi |
| 1234 McFarlane Ln Hayward, CA | 3.0 | 2.0 | 1311 | $3,660 | $2.79 | 12d | 1 | 1.28mi |
| 27715 Cliffwood Ave Hayward, CA | 3.0 | 2.0 | 1128 | $3,800 | $3.37 | 43d | 1 | 1.28mi |
| 28168 Mission Blvd Hayward, CA | 1.0–3.0 | 1.0–2.0 | 1196 | $3,947 | $3.30 | 1d | 9 | 1.32mi |
| 837 Hancock St Hayward, CA | 1.0–3.0 | 1.0–2.0 | 955 | $3,188 | $3.34 | 1d | 14 | 1.40mi |
| 26525 Gading Rd Hayward, CA | 2.0 | 1.0 | 950 | $2,350 | $2.47 | 43d | 1 | 1.47mi |
| 27463 Ponderosa Ct Hayward, CA | 2.0 | 1.5 | 988 | $2,790 | $2.82 | 43d | 1 | 1.48mi |
| 2500 Medallion Dr Union City, CA | 1.0–3.0 | 1.0 | 781 | $2,585 | $3.31 | 1d | 9 | 1.49mi |
Listing history 12 events
-
2026-06-18days on market $189,900 Active 16 DOM
-
2026-06-17days on market $189,900 Active 15 DOM
-
2026-06-16days on market $189,900 Active 14 DOM
-
2026-06-15days on market $189,900 Active 13 DOM
-
2026-06-13days on market $189,900 Active 11 DOM
-
2026-06-13days on market $189,900 Active 10 DOM
-
2026-06-09days on market $189,900 Active 7 DOM
-
2026-06-08days on market $189,900 Active 6 DOM
-
2026-06-07days on market $189,900 Active 5 DOM
-
2026-06-04days on market $189,900 Active 2 DOM
-
2026-06-03remarks 621-char remark
-
2026-06-03$189,900 Active 1 DOM
ⓘ Source: listings_history table (triggers on properties + properties_extension) + one-shot
backfill from property_details.listing_events for pre-trigger history.
Climate risk First Street
- Flood 4/10 Moderate FEMA zone AH · 21% chance over 30 yrs
- Wildfire 1/10 Low
- Heat 4/10 Moderate 7 d/yr ≥89°F today · 14 d/yr by 30 yrs out
- Wind 1/10 Low
- Air quality 7/10 Severe 12 unhealthy d/yr today · 12 by 30 yrs out
Nearby sold comps map
Loading sold comps map…
Walkable amenities ~0.75 mi
Loading nearby amenities…
Taxation est. · year 1
- Rental income
- $37,298
- − Mortgage interest
- −$10,637
- − Property taxes
- −$2,848
- − Insurance
- −$2,774
- − Repairs & maintenance
- −$2,984
- − Management
- −$2,984
- − Depreciation
- −$5,524
- Taxable income
- $9,546
- Est. tax owed @ 24.0%
- −$2,291
- After-tax cash flow
- $9,602/yr
For passive investors: Depreciation is non-cash, so a rental often shows a tax loss while cash-flowing — sheltering income. Rental losses are passive: they offset passive income freely, and up to $25,000/yr can offset ordinary (W-2) income if you actively participate and your MAGI is under $100k (phasing out to $0 by $150k); unused losses carry forward. On sale, claimed depreciation is recaptured at up to 25%, and gains may owe capital-gains tax (a 1031 exchange can defer both). Figures are a year-1 estimate at your 24.0% rate — not tax advice; consult a CPA.
Schools (NCES district)
- District
- Hayward Unified
- NCES district ID
- 0616740
- Math proficiency
- 25% ▼ -1.00%
- Reading proficiency
- 37% ▬ 0.00%
- Median HH income
- $65,326
- Composite
- 31.27/100
- National rank
- #11241
- State rank
- #935 of 1400 in CA
Livability — Hayward
- Score
- 75/100
- State rank
- #124
- US rank
- #4294
Category grades
Schools grade is shown separately in the Schools card above.
Census & demographics
- Census place
- Hayward, CA
- County
- Alameda County · 1,614,355 people
- City population
- 191,800
- Metro
- San Francisco-Oakland-Berkeley, CA
- Population (ZIP)
- 76,947
- Household income
- $107,785
- Rent vs Own
- Severe rent burden
- 2573.0
Population outlook (Alameda County) Hauer SSP2
- Today (2025)
- 1,928,884 people
- By 2030
- 2,069,146 · +7.3%
- By 2040
- 2,338,405 · +21.2%
- By 2050
- 2,586,608 · +34.1%
- By 2075
- 3,061,911 · +58.7%
- By 2100
- 3,234,133 · +67.7%
Race, ethnicity, and origin ACS 2023
- Neighborhood character
- Highly diverse neighborhood (Simpson 0.70)
- Race & ethnicity
- Hispanic / Latino 45% Asian 28% Two or more races 13% White 11% Black 7% Pacific Islander 4% Native American 1%
- Hispanic origin (detail)
- Mexican 33% Puerto Rican 1%
- Common ancestry
- Russian 1% Italian 1% Lithuanian 1%
- Foreign-born
- 46% · Canada, China, Vietnam
- Languages at home
- 34% English-only · Spanish 37% Tagalog/Filipino 8% Other Indo-European 7%
Political lean MEDSL · Alameda
- 2024 margin
- Solid D (+53.6) · D 74.6% · R 21.0% · Other 4.4%
- 2008→2024 swing
- -5.9pp toward R · 2008: 59.5pp · 2024: 53.6pp
- All cycles
- 2024: D+53.6 2020: D+62.5 2016: D+64.4 2012: D+59.8 2008: D+59.5
Not yet ingested
- Civics
- —
Market trends
- HPI YoY
- ▼ -907.12%
- Current HPI
- 315.6082
- Rent YoY
- ▲ 2.58%
- Metro
- San Francisco-Oakland-Berkeley, CA
- State GDP YoY
- ▲ 3.21%
- F500 in state
- 116
Industry mix (Fortune 500 HQ in CA)
| Industry | F500 HQs | Revenue |
|---|---|---|
| Technology | 27 | $1,492B |
|
||
| Financial Services | 3 | $174B |
|
||
| Retail | 3 | $44B |
|
||
| Insurance | 3 | $26B |
|
||
| Media / Entertainment | 2 | $115B |
|
||
| Pharmaceuticals / Biotech | 2 | $62B |
|
||
Price history
+15.1% since first listed10 events — show timeline
- 2026-06-02 Listed $189,900 bridgeMLS, Bay East AOR, or Contra Costa AOR
- 2018-12-27 Sold (MLS) $165,000 bridgeMLS, Bay East AOR, or Contra Costa AOR
- 2018-11-11 Pending — bridgeMLS, Bay East AOR, or Contra Costa AOR
- 2018-10-28 Price Changed $164,900 bridgeMLS, Bay East AOR, or Contra Costa AOR
- 2018-10-12 Price Changed $169,900 bridgeMLS, Bay East AOR, or Contra Costa AOR
- 2018-09-29 Price Changed $175,000 bridgeMLS, Bay East AOR, or Contra Costa AOR
- 2018-09-15 Listed $179,900 bridgeMLS, Bay East AOR, or Contra Costa AOR
- 2017-05-02 Sold (MLS) $157,000 bridgeMLS, Bay East AOR, or Contra Costa AOR
- 2017-03-29 Pending — bridgeMLS, Bay East AOR, or Contra Costa AOR
- 2017-03-23 Listed $165,000 bridgeMLS, Bay East AOR, or Contra Costa AOR
Cash-flow waterfall
monthlySold comps — $/sqft
last 12 mo · ≤1 miLoading sold comps…