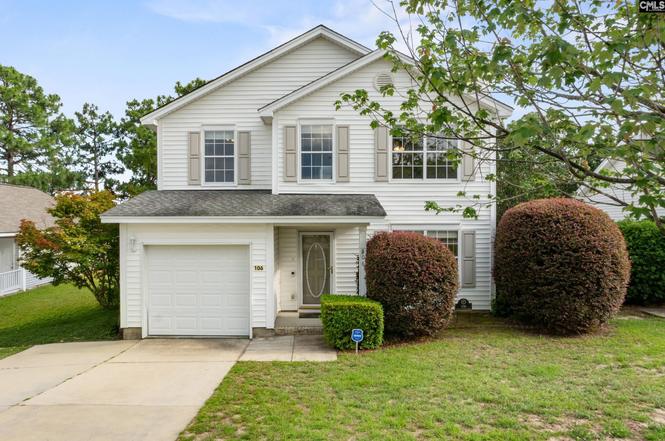
106 Rolling Knoll Dr · Dentsville, SC
Flood risk No data
- FEMA flood zone
- —
- Chance of flooding over 30 yrs
- —
- Est. flood insurance / yr
- —
Fire risk No data
- Est. fire insurance / yr
- —
Heat risk No data
- Hot days now (above threshold)
- —
- Hot days in 30 yrs
- —
Wind risk No data
- Chance of severe wind over 30 yrs
- —
Air-quality risk No data
- Unhealthy air days now
- —
- Unhealthy air days in 30 yrs
- —
Risk factors via First Street. Map © Google.
Why this score? — see what drove the C grade
The composite is a weighted blend of 9 inputs, each scored 0–100. Each bar is that input's sub-score; the figure is the points it added to the 100-point composite (weight × sub-score).
- Cash flow +19.2/30.0
- ARV discount +15.0/15.0
- DSCR +6.0/10.0
- 1% rule +4.3/10.0
- Schools +3.6/10.0
- Livability +3.6/5.0
- Rent growth +3.2/5.0
- Condition / age +2.5/5.0
- Appreciation +0.0/10.0
$198,000
🖨 Deal sheet 📄 Offer letter ✓ Due diligence
Listing remarks
Charming 3-bedroom, 2.5-bath residence in Northeast Columbia! Conveniently located near shopping, dining, schools, I-77, and major commuter routes, this home combines comfort, functionality, and value. The spacious living area provides a welcoming space for gathering with family and friends, while the kitchen offers ample cabinet and counter space for everyday living. Upstairs, the primary suite features a private bath and generous closet space, with two additional bedrooms providing flexibility for family, guests, or a home office. Enjoy outdoor living in the backyard, perfect for relaxing, gardening, or entertaining. Situated in an established neighborhood within the Richland Two School D
Key facts
- Near schools
- Near dining
- Near shopping
Tags
Property features AI
Finance
- HOA & community: Has homeowners association
Exterior
- Parking: Attached garage with 1 garage space
- Utilities: Public sewer
- Home design: Two-story home
- Construction: Slab foundation
- Exterior features: Vinyl exterior finish; Paved road access; Approximately 0.16 acre lot; Public water
Interior
- Kitchen: Kitchen on the main level
- Bedrooms: Master bedroom on the second level; Bedroom 2 on the second level; Bedroom 3 on the second level
- Bathrooms: Two full bathrooms; One half bathroom
- Heating & cooling: Central heating; Central cooling
- Interior features: One fireplace; Formal living room on the main level; Dining room on the main level
- Laundry & utility: Washer and dryer located on the second level
Neighborhood map
What this means for you Summary
Snapshot
- This is a 3-bed/3.0-bath single-family listed at $198k.
Deal economics
- At list price, monthly cash flow is $212 ($3k/yr) — positive.
- The deal already cash-flows at list — no discount required.
- To meet the 1% rule (rent ≥ 1% of price), the offer needs to be $184k (6.9% below list).
- Recommended offer: $184k (6.9% below list) — sets the bar for 1% rule.
Location & tenants
- Location reads 71/100 on livability (#50 in SC) — a middle-class / working-renter tenant base. Strengths: cost of living A+, health & safety A+, housing A; Watch: amenities D+, crime F, commute F.
- Richland 02 (suburban): math 35% / reading 47% proficiency, ranked #29 of 80 in SC (top 36%) — families likely to look elsewhere, expect single-tenant / working-renter base with shorter leases.
- Zoned schools: Rice Creek Elementary (math 36% / reading 34%, grade F, #339 of 597 statewide, top 57%, 737 students, 76% FRL); Ridge View High (math 43% / reading 76%, grade C+, #110 of 196 statewide, top 58%, 1,711 students, 60% FRL) — zoned schools average 68% FRL vs 38% district-wide (30 pts higher); higher-poverty schools than district average — tighter screening recommended.
- Market conditions: Rents rising (+2.8%/yr); 406 active listings in the ZIP; 17 comparable units currently listed for rent nearby; rentals at typical pace (median 14d on market — plan ~3-4 weeks tenant-placement turnaround); 3,472 units permitted in Richland County in 2024 (1,096 in 5+ unit buildings).
Forward outlook
- Local home prices are declining (-3.0%/yr); year-one equity from $1k of loan paydown is wiped out by about $6k of value loss. Plan a longer hold.
- Richland County population projected at +30% by 2050 — long-run rental-demand tailwind backs the buy-and-hold thesis.
Negotiation context
- Only 8 days on market — expect competitive offers; lowballing is unlikely to land.
- Current owner paid $105k; list at $198k implies a 89% gain — meaningful room to come down on a strong offer.
Questions for the listing agent
- Is there a deadline driving the sale (1031 exchange, divorce, estate, relocation)? That informs how much negotiation room exists.
- Schools are D-rated, which usually means shorter tenancies and higher turnover. Who's the typical renter profile here, and what's been the actual vacancy rate?
- Crime grade is F in this area — have there been break-ins, vandalism, or insurance claims at this property in the last 3 years? What carrier currently insures it and at what premium?
- What's the average days-on-market for RENTAL listings here right now (not sales)? A rising rental-DOM trend means longer vacancies and softer asking-rent achievability than the comps imply.
- What's the recent tenant-quality profile in this submarket — average credit score on applications, eviction rate, late-payment / NSF rate, and stable-employment percentage? A property-management company in the area should have these aggregated.
- How much new for-sale + rental construction is in the pipeline within 1–3 miles? Heavy new supply typically softens prices + rents 12–24 months out; constrained supply supports both.
Investment metrics
- 1% rule
- 0.93% ✗
- Cap rate
- 7.58%
- Cash-on-cash
- 4.60%
- DSCR
- 1.20
- GRM
- 9.0
CMA / ARV
- ARV (on-the-fly)
- $267,247
- Comps found
- 2
Show comp detail 2 sales within ~0.75 mi
| Address | Dist | Beds/Ba | Sqft | Sold | Price | $/sf | Match |
|---|---|---|---|---|---|---|---|
| 215 Elders Pond Dr | 0.34mi | 3/2.5 | 1,422 (-5%) | 7mo | $230,000 | $162 | 68 |
| 1007 May Oak Cir | 0.38mi | 3/2.0 | 1,342 (-10%) | 24mo | $240,000 | $179 | 42 |
Match score weights: distance 35% · size 25% · config 20% · recency 20%. Top-matched comps best support the ARV.
Projected returns pro-forma
-3.0% appreciation · 2.81% rent growth · sell at horizon
- IRR
- -9.4%
- Equity multiple
- 0.66×
- Total profit
- $-18,953
- Equity at exit
- $29,522
- IRR
- -0.2%
- Equity multiple
- 0.99×
- Total profit
- $-715
- Equity at exit
- $17,119
Cash invested: $55,440 (down + closing). Projections, not guarantees.
Landlord ↔ Tenant lean methodology
- Overall (STATE)
- 90 Strongly Landlord-Friendly
- State South Carolina
- 90 Strongly Landlord-Friendly · R+6
- County
- — inherits STATE
- City
- — inherits STATE
ZIP-level market 29229
- Home prices YoY
- -21.5%
- Rents YoY
- 2.8%
- Active inventory
- 406
- Price-to-rent
- 9.0×
Monthly cashflow live
- Estimated rent
- $1,842 high interval (Pro) →
- Mortgage (P&I)
- −$1,038
- Tax from tax record
- −$122 /mo · $1,467/yr
- Insurance
- −$82
- HOA
- −$0
- Vacancy / Maint / Mgmt
- −$387
- Net cashflow
- $212
Break-even live
UW: 25.0% down · 7.5% · 30yr · 1.5% tax · 5.0% vac · 8.0% maint · 8.0% mgmt
Financing live
Cash to close
- Down payment
- $49,500
- Closing costs
- $5,940
- Reserves months
- —
- Total cash needed
- —
Loan-product check · same deal, 3 products live
Conventional
25% down · 7.5% · 30yr
- Down + closing
- —
- Monthly P&I
- —
- Monthly cashflow
- —
- DSCR
- —
- Eligible?
- —
Personal DTI + credit; lowest rate.
DSCR
20% down · 8.5% · 30yr
- Down + closing
- —
- Monthly P&I
- —
- Monthly cashflow
- —
- DSCR
- —
- Eligible?
- —
No personal income docs; deal must DSCR.
Hard money
10% down · 12.0% · 12mo
- Down + closing
- —
- Monthly P&I
- —
- Monthly cashflow
- —
- DSCR
- —
- Eligible?
- —
Short-term bridge; refi at stabilization.
Rent comps 17 comps
| Address | Beds | Baths | Sqft | Rent | $/sqft | DOM | Units | Dist |
|---|---|---|---|---|---|---|---|---|
| 3 Glen Knoll Ct Columbia, SC | 3.0 | 2.0 | 1320 | $1,699 | $1.29 | 11d | 1 | 0.04mi |
| 1116 Waverly Place Ln Columbia, SC | 3.0 | 2.0 | 1428 | $1,875 | $1.31 | 14d | 1 | 0.30mi |
| 1214 Waverly Place Ln Columbia, SC | 3.0 | 2.0 | 1152 | $1,800 | $1.56 | 11d | 1 | 0.33mi |
| 214 Elders Pond Dr Columbia, SC | 3.0 | 2.5 | 1400 | $1,350 | $0.96 | 11d | 1 | 0.35mi |
| 5 Elders Pond Ct Columbia, SC | 3.0 | 2.5 | 1640 | $1,795 | $1.09 | 14d | 1 | 0.43mi |
| 3 Long Glen Ct Columbia, SC | 3.0 | 2.0 | 1314 | $1,849 | $1.41 | 2d | 1 | 0.45mi |
| 423 Elders Pond Cir Columbia, SC | 2.0 | 2.0 | 1125 | $1,475 | $1.31 | 19d | 1 | 0.59mi |
| 225 Lawson Dr Columbia, SC | 2.0 | 2.0 | 1288 | $1,580 | $1.23 | 23d | 1 | 0.68mi |
| 4500 Hard Scrabble Rd Columbia, SC | 1.0–3.0 | 1.0–2.0 | 1031 | $1,455 | $1.41 | 2d | 4 | 0.70mi |
| 500 Castle Ridge Dr Columbia, SC | 3.0 | 2.0 | 1753 | $2,150 | $1.23 | 3d | 1 | 0.88mi |
| 102 Petworth Dr Columbia, SC | 4.0 | 3.0 | 1664 | $2,050 | $1.23 | 2d | 1 | 1.06mi |
| 108 Quinton Ln Columbia, SC | 3.0 | 2.0 | 1052 | $1,749 | $1.66 | 21d | 1 | 1.06mi |
| 201 Trowbridge Rd Columbia, SC | 3.0 | 2.0 | 1220 | $1,649 | $1.35 | 23d | 1 | 1.15mi |
| 416 Sandfarm Trl Blythewood, SC | 3.0 | 2.5 | 1664 | $2,025 | $1.22 | 23d | 1 | 1.20mi |
| 416 Sandfarm Trl Blythewood, SC | 3.0 | 2.5 | 1664 | $2,025 | $1.22 | 14d | 1 | 1.20mi |
| 213 Sagamare Rd Columbia, SC | 4.0 | 3.0 | 1664 | $1,970 | $1.18 | 23d | 1 | 1.39mi |
| 109 Jaybird Ln Columbia, SC | 3.0 | 2.0 | 1250 | $1,679 | $1.34 | 2d | 1 | 1.40mi |
Listing history 7 events
-
2026-06-18days on market $198,000 Active 8 DOM
-
2026-06-17days on market $198,000 Active 7 DOM
-
2026-06-16days on market $198,000 Active 6 DOM
-
2026-06-15days on market $198,000 Active 5 DOM
-
2026-06-14days on market $198,000 Active 3 DOM
-
2026-06-13remarks 699-char remark
-
2026-06-13$198,000 Active 2 DOM
ⓘ Source: listings_history table (triggers on properties + properties_extension) + one-shot
backfill from property_details.listing_events for pre-trigger history.
Tax reassessment forecast SC · Resets to sale price
- Current annual tax
- $1,467 · $122/mo
- Projected year-2 tax
- $1,467 · $122/mo
- Expected delta
- $0/yr ($0/mo · 0.0%)
ⓘ Screening estimate from a state-policy table — verify with the county assessor before closing.
Nearby sold comps map
Loading sold comps map…
Walkable amenities ~0.75 mi
Loading nearby amenities…
Taxation est. · year 1
- Rental income
- $22,110
- − Mortgage interest
- −$11,091
- − Property taxes
- −$1,467
- − Insurance
- −$990
- − Repairs & maintenance
- −$1,769
- − Management
- −$1,769
- − Depreciation
- −$5,760
- Taxable loss
- −$736
- Est. tax savings @ 24.0%
- +$177
- After-tax cash flow
- $2,726/yr
For passive investors: Depreciation is non-cash, so a rental often shows a tax loss while cash-flowing — sheltering income. Rental losses are passive: they offset passive income freely, and up to $25,000/yr can offset ordinary (W-2) income if you actively participate and your MAGI is under $100k (phasing out to $0 by $150k); unused losses carry forward. On sale, claimed depreciation is recaptured at up to 25%, and gains may owe capital-gains tax (a 1031 exchange can defer both). Figures are a year-1 estimate at your 24.0% rate — not tax advice; consult a CPA.
Schools (NCES district)
- District
- Richland 02
- NCES district ID
- 4503390
- Math proficiency
- 35% ▼ -15.00%
- Reading proficiency
- 47% ▼ -5.00%
- Median HH income
- $59,684
- Composite
- 36.2/100
- National rank
- #4730
- State rank
- #29 of 80 in SC
Livability — Dentsville
- Score
- 71/100
- State rank
- #50
- US rank
- #6940
Category grades
Schools grade is shown separately in the Schools card above.
Census & demographics
- County
- Richland County · 389,530 people
- City population
- 52,835
- Metro
- Columbia, SC
- Population (ZIP)
- 51,861
- Household income
- $74,043
- Rent vs Own
- Severe rent burden
- 1939.0
Population outlook (Richland County) Hauer SSP2
- Today (2025)
- 459,667 people
- By 2030
- 487,524 · +6.1%
- By 2040
- 542,035 · +17.9%
- By 2050
- 595,371 · +29.5%
- By 2075
- 732,998 · +59.5%
- By 2100
- 820,415 · +78.5%
Race, ethnicity, and origin ACS 2023
- Neighborhood character
- Diverse neighborhood (Simpson 0.56)
- Race & ethnicity
- Black 62% White 24% Hispanic / Latino 8% Two or more races 6% Asian 3%
- Hispanic origin (detail)
- Mexican 2% Puerto Rican 2%
- Common ancestry
- Slovak 1% Lithuanian 1% Romanian 1%
- Foreign-born
- 7% · Canada, South Korea, Jamaica
- Languages at home
- 89% English-only · Spanish 6% Other Indo-European 1% Korean 1%
Political lean MEDSL · Richland
- 2024 margin
- Solid D (+34.6) · D 66.4% · R 31.8% · Other 1.8%
- 2008→2024 swing
- +5.7pp toward D · 2008: 28.9pp · 2024: 34.6pp
- All cycles
- 2024: D+34.6 2020: D+38.3 2016: D+32.9 2012: D+33.3 2008: D+28.9
Not yet ingested
- Civics
- —
Market trends
- HPI YoY
- ▼ -51.11%
- Current HPI
- 186.782
- Rent YoY
- ▲ 2.81%
- Metro
- Columbia, SC
- State GDP YoY
- ▲ 4.51%
- F500 in state
- 2
Industry mix (Fortune 500 HQ in SC)
| Industry | F500 HQs | Revenue |
|---|---|---|
| Packaging | 1 | $7B |
|
||
Price history
+200.0% since first listed3 events — show timeline
- 2026-06-10 Listed $198,000 Consolidated MLS
- 2015-08-26 Sold (Public Records) $105,000 Public Records
- 1998-05-11 Sold (Public Records) $66,000 Public Records
Property tax history
+2.8%/yrLatest (2025): $1,467 · -67.1% YoY. Source: county tax records.
Cash-flow waterfall
monthlySold comps — $/sqft
last 12 mo · ≤1 miLoading sold comps…