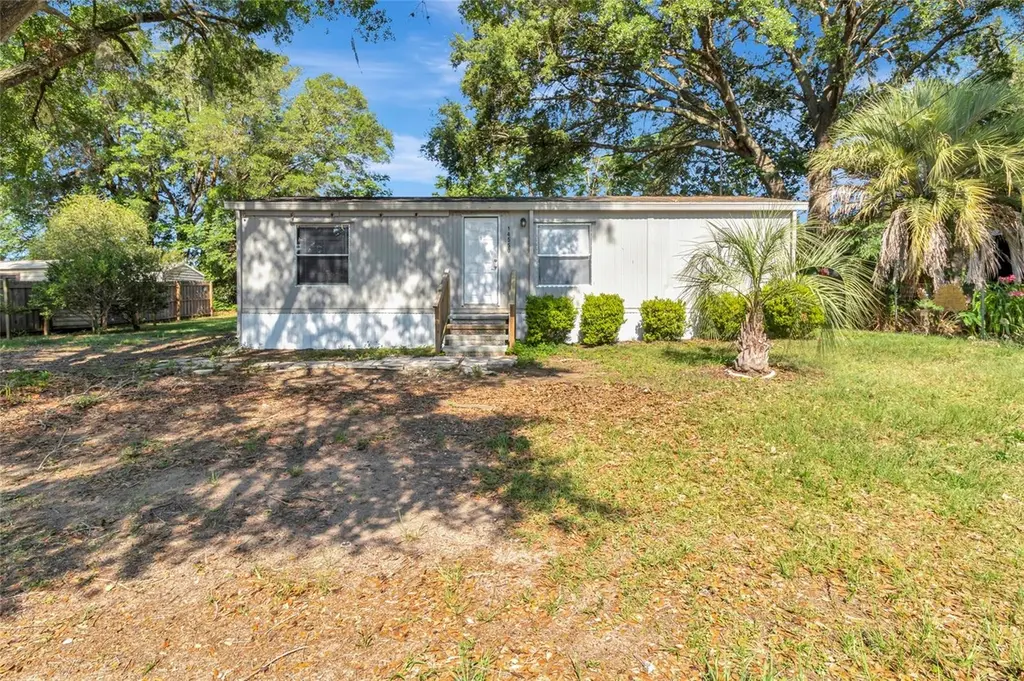
14550 SE 91st Ave · The Villages, FL
Flood risk 1/10 · Minimal
- FEMA flood zone
- X (unshaded)
- Chance of flooding over 30 yrs
- 0.0%
- Est. flood insurance / yr
- $507 – $1,088
Fire risk 3/10 · Minor
- Est. fire insurance / yr
- $947 – $1,759
Heat risk 8/10 · Major
- Hot days now (above 109°F)
- 7 days/yr
- Hot days in 30 yrs
- 21 days/yr
Wind risk 9/10 · Severe
- Chance of severe wind over 30 yrs
- 99.0%
Air-quality risk 3/10 · Minor
- Unhealthy air days now
- 2 days/yr
- Unhealthy air days in 30 yrs
- 2 days/yr
Risk factors via First Street. Map © Google.
Why this score? — see what drove the C- grade
The composite is a weighted blend of 9 inputs, each scored 0–100. Each bar is that input's sub-score; the figure is the points it added to the 100-point composite (weight × sub-score).
- Cash flow +19.9/30.0
- ARV discount +7.5/15.0
- DSCR +6.3/10.0
- 1% rule +4.7/10.0
- Schools +3.6/10.0
- Livability +3.5/5.0
- Rent growth +2.5/5.0
- Condition / age +2.5/5.0
- Appreciation +0.0/10.0
$160,000
🖨 Deal sheet 📄 Offer letter ✓ Due diligence
Listing remarks MLS
The property is being sold as-is, the mobile home does not convey with the sale. It will be up to the buyer to address after the closing. Sale is for the land only.
Key facts
- Near dining
- Near shopping
- New hvac
Tags
Property features AI
Finance
- Other: Property type: Residential; Lot size about 0.17 acre (0 to less than 1/4 acre)
- HOA & community: No association
Exterior
- Utilities: Public water; Public sewer; Broadband/high-speed internet available; Fiber optics
- Home design: Manufactured double-wide home; One story; Faces east
- Construction: Metal siding; Shingle roof; Built on crawlspace
- Exterior features: Sliding doors; Asphalt road access
Interior
- Kitchen: Convection oven; Range; Microwave; Refrigerator; Freezer; Electric water heater
- Bedrooms: 2 bedrooms
- Flooring: Laminate; Crawlspace foundation
- Bathrooms: 2 full bathrooms
- Heating & cooling: Central heating (electric); Central air conditioning
- Interior features: Ceiling fans; Open floorplan; Split bedroom layout; Vaulted ceilings; Walk-in closets
- Laundry & utility: Washer; Dryer; Washer hookup
Neighborhood map
What this means for you Summary
Snapshot
- This is a 2-bed/2.0-bath manufactured listed at $160k.
Deal economics
- At list price, monthly cash flow is $193 ($2k/yr) — positive.
- The deal already cash-flows at list — no discount required.
- To meet the 1% rule (rent ≥ 1% of price), the offer needs to be $155k (3.1% below list).
- Recommended offer: $155k (3.1% below list) — sets the bar for 1% rule.
- Cap rate 7.7% vs local median 5.0% in The Villages — top-decile yield for the area; either an underpriced asset or a hidden risk that comps aren't pricing in. Stress-test before assuming the spread holds.
Location & tenants
- Location reads 70/100 on livability (#431 in FL) — a middle-class / working-renter tenant base. Strengths: crime A+, housing A, employment B+; Watch: amenities F, commute F, health & safety F.
- Marion (rural): math 42% / reading 43% proficiency, ranked #61 of 73 in FL (top 84%) — families likely to look elsewhere, expect single-tenant / working-renter base with shorter leases; 61% free/reduced lunch — lower-income household profile, screen leases tightly.
- Zoned schools: Harbour View Elementary School (math 41% / reading 38%, grade F, #1,513 of 2,144 statewide, top 73%, 819 students, 71% FRL); Lake Weir High School (math 23% / reading 34%, grade F, #458 of 667 statewide, top 69%, 1,483 students, 68% FRL).
- Market conditions: 705 active listings in the ZIP; 2 comparable units currently listed for rent nearby; 7,071 units permitted in Marion County in 2024 (534 in 5+ unit buildings).
Forward outlook
- Local home prices are declining (-3.0%/yr); year-one equity from $1k of loan paydown is wiped out by about $5k of value loss. Plan a longer hold.
- Marion County population projected at +13% by 2050 — modest demand growth; plan on rents tracking national, not racing it.
Negotiation context
- It's been on market 26 days — a 2% lower offer ($158k) is reasonable based on typical stale-listing flexibility.
- 9 sale attempts since 21y ago with the ask held roughly flat each time — persistent listings suggest the price (not the market) is what's stuck; bring a comps-based counter.
- Current owner paid $46k; list at $160k implies a 252% gain — meaningful room to come down on a strong offer.
Risks & watch-outs
- Climate carrying-cost: severe wind risk, 99% chance of damaging wind over 30y; extreme-heat days projected 7→21/yr by 2055 (HVAC capex compounding) — expect insurance premiums to compound above CPI over the hold.
Questions for the listing agent
- Is there a deadline driving the sale (1031 exchange, divorce, estate, relocation)? That informs how much negotiation room exists.
- Schools are A-rated — typically a magnet for longer-tenancy family renters. What's the average tenant stay here, and is there a school-zone premium baked into asking?
- What's the average days-on-market for RENTAL listings here right now (not sales)? A rising rental-DOM trend means longer vacancies and softer asking-rent achievability than the comps imply.
- What's the recent tenant-quality profile in this submarket — average credit score on applications, eviction rate, late-payment / NSF rate, and stable-employment percentage? A property-management company in the area should have these aggregated.
- How much new for-sale + rental construction is in the pipeline within 1–3 miles? Heavy new supply typically softens prices + rents 12–24 months out; constrained supply supports both.
Investment metrics
- 1% rule
- 0.97% ✗
- Cap rate
- 7.74%
- Cash-on-cash
- 5.17%
- DSCR
- 1.23
- GRM
- 8.6
CMA / ARV
- ARV (on-the-fly)
- $89,240
- Comps found
- 3
Show comp detail 3 sales within ~0.75 mi
| Address | Dist | Beds/Ba | Sqft | Sold | Price | $/sf | Match |
|---|---|---|---|---|---|---|---|
| 9352 SE 143rd Ln | 0.32mi | 2/2.0 | 924 (+0%) | 5mo | $134,000 | $145 | 80 |
| 8956 SE 143rd Ln | 0.24mi | 2/2.0 | 1,028 (+12%) | 2mo | $99,900 | $97 | 68 |
| 9195 SE 142nd Pl | 0.37mi | 2/2.0 | 784 (-15%) | 3mo | $52,500 | $67 | 55 |
Match score weights: distance 35% · size 25% · config 20% · recency 20%. Top-matched comps best support the ARV.
Projected returns pro-forma
-3.0% appreciation · 3.0% rent growth · sell at horizon
- IRR
- -8.3%
- Equity multiple
- 0.70×
- Total profit
- $-13,653
- Equity at exit
- $23,857
- IRR
- 1.2%
- Equity multiple
- 1.09×
- Total profit
- $3,854
- Equity at exit
- $13,834
Cash invested: $44,800 (down + closing). Projections, not guarantees.
Landlord ↔ Tenant lean methodology
- Overall (STATE)
- 87 Strongly Landlord-Friendly
- State Florida
- 87 Strongly Landlord-Friendly · R+3
- County
- — inherits STATE
- City
- — inherits STATE
ZIP-level market 34491
- Home prices YoY
- -35.0%
- Active inventory
- 705
- Price-to-rent
- 8.6×
Monthly cashflow live
- Estimated rent
- $1,551 medium interval (Pro) →
- Mortgage (P&I)
- −$839
- Tax from tax record
- −$126 /mo · $1,517/yr
- Insurance
- −$67
- HOA
- −$0
- Vacancy / Maint / Mgmt
- −$326
- Net cashflow
- $193
Break-even live
UW: 25.0% down · 7.5% · 30yr · 1.5% tax · 5.0% vac · 8.0% maint · 8.0% mgmt
Financing live
Cash to close
- Down payment
- $40,000
- Closing costs
- $4,800
- Reserves months
- —
- Total cash needed
- —
Loan-product check · same deal, 3 products live
Conventional
25% down · 7.5% · 30yr
- Down + closing
- —
- Monthly P&I
- —
- Monthly cashflow
- —
- DSCR
- —
- Eligible?
- —
Personal DTI + credit; lowest rate.
DSCR
20% down · 8.5% · 30yr
- Down + closing
- —
- Monthly P&I
- —
- Monthly cashflow
- —
- DSCR
- —
- Eligible?
- —
No personal income docs; deal must DSCR.
Hard money
10% down · 12.0% · 12mo
- Down + closing
- —
- Monthly P&I
- —
- Monthly cashflow
- —
- DSCR
- —
- Eligible?
- —
Short-term bridge; refi at stabilization.
Rent comps 2 comps
| Address | Beds | Baths | Sqft | Rent | $/sqft | DOM | Units | Dist |
|---|---|---|---|---|---|---|---|---|
| 8957 SE 144th St Summerfield, FL | 2.0 | 1.0 | 672 | $1,100 | $1.64 | 21d | 1 | 0.23mi |
| 16152 SE 77th Ct Summerfield, FL | 1.0–3.0 | 1.0–2.0 | 1140 | $1,890 | $1.66 | 13d | 15 | 1.31mi |
Listing history 36 events
-
2026-06-18days on market $160,000 Active 26 DOM
-
2026-06-17days on market $160,000 Active 25 DOM
-
2026-06-16days on market $160,000 Active 24 DOM
-
2026-06-15days on market $160,000 Active 23 DOM
-
2026-06-14days on market $160,000 Active 21 DOM
-
2026-06-13days on market $160,000 Active 20 DOM
-
2026-06-10days on market $160,000 Active 18 DOM
-
2026-06-09days on market $160,000 Active 17 DOM
-
2026-06-08days on market $160,000 Active 16 DOM
-
2026-06-07days on market $160,000 Active 15 DOM
-
2026-06-03days on market $160,000 Active 11 DOM
-
2026-06-02days on market $160,000 Active 10 DOM
-
2026-06-01days on market $160,000 Active 9 DOM
-
2026-05-31days on market $160,000 Active 8 DOM
-
2026-05-30days on market $160,000 Active 7 DOM
-
2026-05-23$160,000 Active
-
2024-05-30soldstatus $45,500 Closed 164-char remark
Show marketing remark (164 chars)
The property is being sold as-is, the mobile home does not convey with the sale. It will be up to the buyer to address after the closing. Sale is for the land only.
-
2024-05-10status Pending 164-char remark
Show marketing remark (164 chars)
The property is being sold as-is, the mobile home does not convey with the sale. It will be up to the buyer to address after the closing. Sale is for the land only.
-
2024-05-10$49,900 Active 164-char remark
Show marketing remark (164 chars)
The property is being sold as-is, the mobile home does not convey with the sale. It will be up to the buyer to address after the closing. Sale is for the land only.
-
2024-05-01status Pending
-
2024-05-01historical
-
2024-04-01$49,900 Active
-
2022-08-31historical
-
2022-08-09$59,900 Active
-
2022-04-27historical
-
2022-02-24status Active
-
2022-02-11status Pending
-
2022-02-09status Active
-
2022-02-04status Pending
-
2021-07-12status Active
-
2021-06-18status Pending
-
2021-04-27$67,500 Active
-
2005-06-17soldstatus $60,000
-
2005-06-01soldstatus $60,000
-
2005-05-10$60,000
-
1987-01-01soldstatus $6,500
ⓘ Source: listings_history table (triggers on properties + properties_extension) + one-shot
backfill from property_details.listing_events for pre-trigger history.
Tax reassessment forecast FL · Resets to sale price
- Current annual tax
- $1,517 · $126/mo
- Projected year-2 tax
- $1,517 · $126/mo
- Expected delta
- $0/yr ($0/mo · 0.0%)
ⓘ Screening estimate from a state-policy table — verify with the county assessor before closing.
Climate risk First Street
- Flood 1/10 Low FEMA zone X (unshaded) · 0% chance over 30 yrs
- Wildfire 3/10 Moderate
- Heat 8/10 Severe 7 d/yr ≥109°F today · 21 d/yr by 30 yrs out
- Wind 9/10 Extreme 99% chance of damaging wind over 30 yrs
- Air quality 3/10 Moderate 2 unhealthy d/yr today · 2 by 30 yrs out
Nearby sold comps map
Loading sold comps map…
Walkable amenities ~0.75 mi
Loading nearby amenities…
Taxation est. · year 1
- Rental income
- $18,610
- − Mortgage interest
- −$8,962
- − Property taxes
- −$1,517
- − Insurance
- −$800
- − Repairs & maintenance
- −$1,489
- − Management
- −$1,489
- − Depreciation
- −$4,655
- Taxable loss
- −$301
- Est. tax savings @ 24.0%
- +$72
- After-tax cash flow
- $2,389/yr
For passive investors: Depreciation is non-cash, so a rental often shows a tax loss while cash-flowing — sheltering income. Rental losses are passive: they offset passive income freely, and up to $25,000/yr can offset ordinary (W-2) income if you actively participate and your MAGI is under $100k (phasing out to $0 by $150k); unused losses carry forward. On sale, claimed depreciation is recaptured at up to 25%, and gains may owe capital-gains tax (a 1031 exchange can defer both). Figures are a year-1 estimate at your 24.0% rate — not tax advice; consult a CPA.
Schools (NCES district)
- District
- Marion
- NCES district ID
- 1201260
- Math proficiency
- 42% ▼ -7.00%
- Reading proficiency
- 43% ▼ -4.00%
- Median HH income
- $40,015
- Composite
- 35.61/100
- National rank
- #4890
- State rank
- #61 of 73 in FL
Livability — The Villages
- Score
- 70/100
- State rank
- #431
- US rank
- #7363
Category grades
Schools grade is shown separately in the Schools card above.
Census & demographics
- County
- Marion County · 315,796 people
- City population
- 83,973
- Metro
- Ocala, FL
- Population (ZIP)
- 33,318
- Household income
- $66,679
- Rent vs Own
- Severe rent burden
- 256.0
Population outlook (Marion County) Hauer SSP2
- Today (2025)
- 365,905 people
- By 2030
- 376,768 · +3.0%
- By 2040
- 396,555 · +8.4%
- By 2050
- 412,723 · +12.8%
- By 2075
- 446,090 · +21.9%
- By 2100
- 436,193 · +19.2%
Race, ethnicity, and origin ACS 2023
- Neighborhood character
- Predominantly White (77%)
- Race & ethnicity
- White 77% Hispanic / Latino 14% Two or more races 9% Black 4% Asian 2%
- Hispanic origin (detail)
- Mexican 3% Puerto Rican 6% Cuban 1%
- Common ancestry
- Lithuanian 3% Slovak 2% Romanian 2%
- Foreign-born
- 8% · Canada, Vietnam, Jamaica
- Languages at home
- 85% English-only · Spanish 11% Vietnamese 1% French/Haitian/Cajun 1%
Political lean MEDSL · Marion
- 2024 margin
- Solid R (+31.6) · D 33.8% · R 65.5%
- 2008→2024 swing
- -20.0pp toward R · 2008: -11.6pp · 2024: -31.6pp
- All cycles
- 2024: R+31.6 2020: R+25.9 2016: R+26.2 2012: R+16.2 2008: R+11.6
Not yet ingested
- Civics
- —
Market trends
- HPI YoY
- ▼ -107.67%
- Current HPI
- 200.0792
- Rent YoY
- —
- Metro
- Ocala, FL
- State GDP YoY
- ▲ 3.28%
- F500 in state
- 36
Industry mix (Fortune 500 HQ in FL)
| Industry | F500 HQs | Revenue |
|---|---|---|
| Industrial Technology | 2 | $29B |
|
||
| Insurance | 2 | $17B |
|
||
| Retail | 1 | $60B |
|
||
| Technology Distribution | 1 | $58B |
|
||
| Homebuilding | 1 | $35B |
|
||
| Technology Manufacturing | 1 | $35B |
|
||
Price history
+2361.5% since first listed21 events — show timeline
- 2026-05-23 Listed $160,000 Stellar MLS as Distributed by MLS Grid
- 2024-05-30 Sold (MLS) $45,500 Stellar MLS as Distributed by MLS Grid
- 2024-05-10 Pending — Stellar MLS as Distributed by MLS Grid
- 2024-05-10 Listed $49,900 Stellar MLS as Distributed by MLS Grid
- 2024-05-01 Pending — Stellar MLS as Distributed by MLS Grid
- 2024-05-01 Listing Removed — Stellar MLS as Distributed by MLS Grid
- 2024-04-01 Listed $49,900 Stellar MLS as Distributed by MLS Grid
- 2022-08-31 Listing Removed — Stellar MLS as Distributed by MLS Grid
- 2022-08-09 Listed $59,900 Stellar MLS as Distributed by MLS Grid
- 2022-04-27 Listing Removed — Stellar MLS as Distributed by MLS Grid
- 2022-02-24 Relisted — Stellar MLS as Distributed by MLS Grid
- 2022-02-11 Pending — Stellar MLS as Distributed by MLS Grid
- 2022-02-09 Relisted — Stellar MLS as Distributed by MLS Grid
- 2022-02-04 Pending — Stellar MLS as Distributed by MLS Grid
- 2021-07-12 Relisted — Stellar MLS as Distributed by MLS Grid
- 2021-06-18 Pending — Stellar MLS as Distributed by MLS Grid
- 2021-04-27 Listed $67,500 Stellar MLS as Distributed by MLS Grid
- 2005-06-17 Sold (MLS) $60,000 Stellar MLS as Distributed by MLS Grid
- 2005-06-01 Sold (Public Records) $60,000 Public Records
- 2005-05-10 Listed $60,000 Stellar MLS as Distributed by MLS Grid
- 1987-01-01 Sold (Public Records) $6,500 Public Records
Property tax history
+8.3%/yrLatest (2025): $1,517 · +16.6% YoY. Source: county tax records.
Cash-flow waterfall
monthlySold comps — $/sqft
last 12 mo · ≤1 miLoading sold comps…