601 NE 3rd Pl · Earth, TX
Flood risk 1/10 · Minimal
- FEMA flood zone
- —
- Chance of flooding over 30 yrs
- 0.0%
- Est. flood insurance / yr
- —
Fire risk 4/10 · Minor
- Est. fire insurance / yr
- $1,222 – $2,270
Heat risk 4/10 · Minor
- Hot days now (above 97°F)
- 7 days/yr
- Hot days in 30 yrs
- 20 days/yr
Wind risk 2/10 · Minimal
- Chance of severe wind over 30 yrs
- —
Air-quality risk 1/10 · Minimal
- Unhealthy air days now
- 0 days/yr
- Unhealthy air days in 30 yrs
- 0 days/yr
Risk factors via First Street. Map © Google.
Why this score? — see what drove the B grade
The composite is a weighted blend of 9 inputs, each scored 0–100. Each bar is that input's sub-score; the figure is the points it added to the 100-point composite (weight × sub-score).
- Cash flow +30.0/30.0
- DSCR +10.0/10.0
- 1% rule +8.6/10.0
- ARV discount +7.5/15.0
- Appreciation +5.9/10.0
- Schools +3.2/10.0
- Livability +3.2/5.0
- Rent growth +2.5/5.0
- Condition / age +2.5/5.0
$85,000
🖨 Deal sheet 📄 Offer letter ✓ Due diligence
Listing remarks
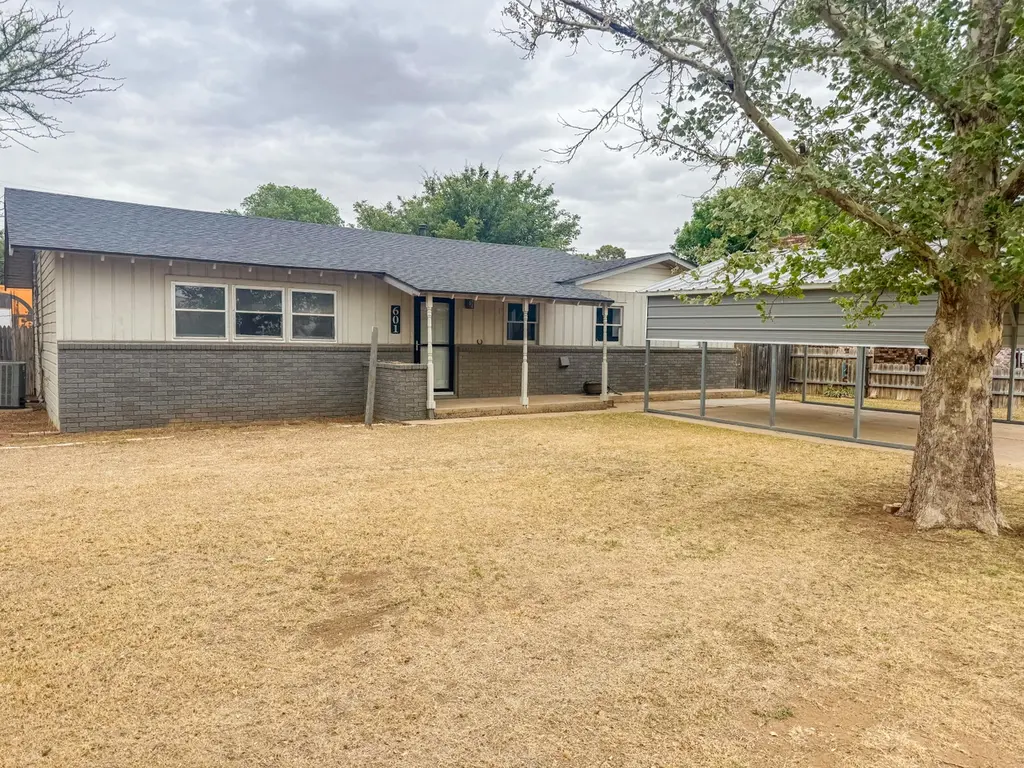
Earth, TX! Great 3/2 with a carport and boxcar, adding additional storage in the back! This little home is in great condition but could use some updating and work in the backyard! Nice curb appeal, sits on a corner lot AND priced to SELL! This one will not last long, would be an excellent investment opportunity! NO OWNER FINANCING. Call today to schedule your private showing!
Key facts
- Carport
- Additional storage
- Corner lot
Tags
Property features AI
Exterior
- Parking: Carport (1 space); Driveway parking
- Utilities: Public water; Public sewer; Electricity connected
- Home design: Single-family residence; Residential property; Listed as fixer
- Construction: Pillar/post/pier foundation; Composition roof; Construction materials: Unknown; Built area: 1,590 above-grade finished
- Exterior features: Storage building/area; Fenced backyard; Front yard
Interior
- Kitchen: Cooktop; Dishwasher
- Flooring: Carpet; Vinyl
- Bathrooms: 2 full bathrooms
- Heating & cooling: Central heating; Central electric air conditioning; Ceiling fan cooling
- Interior features: Ceiling fans throughout; Built-in storage
- Laundry & utility: Laundry room with washer and electric dryer hookups
Neighborhood map
What this means for you Summary
Snapshot
- This is a 3-bed/1.0-bath single-family listed at $85k.
Deal economics
- At list price, monthly cash flow is $327 ($4k/yr) — positive.
- The deal already cash-flows at list — no discount required.
- Meets the 1% rule at list price ($1k rent vs $85k).
- Recommended offer: $82k (3.0% below list) — sets the bar for market timing.
Location & tenants
- Location reads 64/100 on livability (#778 in TX) — a middle-class / working-renter tenant base. Strengths: cost of living A+, housing A, crime A-; Watch: health & safety C-, employment D+, amenities F.
- Springlake-Earth ISD (rural): math 33% / reading 36% proficiency, ranked #916 of 1,141 in TX (top 80%) — families likely to look elsewhere, expect single-tenant / working-renter base with shorter leases; 66% free/reduced lunch — lower-income household profile, screen leases tightly.
- Zoned schools: Springlake-Earth Elem/Middle School (math 52% / reading 47%, grade D, #865 of 4,322 statewide, top 21%, 179 students, 81% FRL); Springlake-Earth H S (math 44% / reading 54%, grade D, #509 of 1,632 statewide, top 34%, 131 students, 67% FRL).
- Zoned-school proficiency averages 50% at this address vs 34% district-wide (+15 pts) — the actual schools serving this property are materially stronger than the Springlake-Earth ISD average implies; a family-tenant draw the district grade alone would hide.
- Market conditions: 4 active listings in the ZIP.
Forward outlook
- In year one you build about $2k of equity ($588 loan paydown + $2k appreciation (1.8% local appreciation)).
- Lamb County population projected at -20% by 2050 — secular population decline; favor cash flow + early exit over multi-decade hold.
- At projected returns (1.8% appreciation + 3.0% rent growth), your $24k cash investment doubles in ~4 years — after that, you're playing with house money.
Negotiation context
- It's been on market 43 days — a 3% lower offer ($82k) is reasonable based on typical stale-listing flexibility.
Risks & watch-outs
- Watch-outs: built in 1950 — expect roof / HVAC / electrical / plumbing capex.
Questions for the listing agent
- It's been on market 43 days. Have you received any prior offers? Is the seller open to a 3% concession, seller financing, or rate buy-down credit?
- Built in 1950 — when were the roof, HVAC, electrical panel, plumbing, and water heater last replaced?
- Is there a deadline driving the sale (1031 exchange, divorce, estate, relocation)? That informs how much negotiation room exists.
- Schools are F-rated, which usually means shorter tenancies and higher turnover. Who's the typical renter profile here, and what's been the actual vacancy rate?
- What's the average days-on-market for RENTAL listings here right now (not sales)? A rising rental-DOM trend means longer vacancies and softer asking-rent achievability than the comps imply.
- What's the recent tenant-quality profile in this submarket — average credit score on applications, eviction rate, late-payment / NSF rate, and stable-employment percentage? A property-management company in the area should have these aggregated.
- How much new for-sale + rental construction is in the pipeline within 1–3 miles? Heavy new supply typically softens prices + rents 12–24 months out; constrained supply supports both.
Investment metrics
- 1% rule
- 1.36% ✓
- Cap rate
- 10.91%
- Cash-on-cash
- 16.50%
- DSCR
- 1.73
- GRM
- 6.1
CMA / ARV
No comps found within radius.
Projected returns pro-forma
1.83% appreciation · 3.0% rent growth · sell at horizon
- IRR
- 20.4%
- Equity multiple
- 2.09×
- Total profit
- $25,954
- Equity at exit
- $32,747
- IRR
- 22.6%
- Equity multiple
- 3.94×
- Total profit
- $69,940
- Equity at exit
- $46,566
Cash invested: $23,800 (down + closing). Projections, not guarantees.
Landlord ↔ Tenant lean methodology
- Overall (STATE)
- 87 Strongly Landlord-Friendly
- State Texas
- 87 Strongly Landlord-Friendly · R+5
- County
- — inherits STATE
- City
- — inherits STATE
ZIP-level market 79031
- Home prices YoY
- 2.2%
- Active inventory
- 4
- Price-to-rent
- 6.1×
Monthly cashflow live
- Estimated rent
- $1,158 medium interval (Pro) →
- Mortgage (P&I)
- −$446
- Tax from tax record
- −$107 /mo · $1,281/yr
- Insurance
- −$35
- HOA
- −$0
- Vacancy / Maint / Mgmt
- −$243
- Net cashflow
- $327
Break-even live
UW: 25.0% down · 7.5% · 30yr · 1.5% tax · 5.0% vac · 8.0% maint · 8.0% mgmt
Financing live
Cash to close
- Down payment
- $21,250
- Closing costs
- $2,550
- Reserves months
- —
- Total cash needed
- —
Loan-product check · same deal, 3 products live
Conventional
25% down · 7.5% · 30yr
- Down + closing
- —
- Monthly P&I
- —
- Monthly cashflow
- —
- DSCR
- —
- Eligible?
- —
Personal DTI + credit; lowest rate.
DSCR
20% down · 8.5% · 30yr
- Down + closing
- —
- Monthly P&I
- —
- Monthly cashflow
- —
- DSCR
- —
- Eligible?
- —
No personal income docs; deal must DSCR.
Hard money
10% down · 12.0% · 12mo
- Down + closing
- —
- Monthly P&I
- —
- Monthly cashflow
- —
- DSCR
- —
- Eligible?
- —
Short-term bridge; refi at stabilization.
Listing history 16 events
-
2026-06-18days on market $85,000 Active 43 DOM
-
2026-06-17days on market $85,000 Active 42 DOM
-
2026-06-16days on market $85,000 Active 41 DOM
-
2026-06-15days on market $85,000 Active 40 DOM
-
2026-06-15days on market $85,000 Active 39 DOM
-
2026-06-13days on market $85,000 Active 38 DOM
-
2026-06-12days on market $85,000 Active 37 DOM
-
2026-06-09days on market $85,000 Active 34 DOM
-
2026-06-08days on market $85,000 Active 33 DOM
-
2026-06-08days on market $85,000 Active 32 DOM
-
2026-06-05days on market $85,000 Active 30 DOM
-
2026-06-03days on market $85,000 Active 28 DOM
-
2026-06-02days on market $85,000 Active 27 DOM
-
2026-06-01days on market $85,000 Active 26 DOM
-
2026-05-31days on market $85,000 Active 25 DOM
-
2026-05-06$85,000 Active 378-char remark
ⓘ Source: listings_history table (triggers on properties + properties_extension) + one-shot
backfill from property_details.listing_events for pre-trigger history.
Tax reassessment forecast TX · Resets to sale price
- Current annual tax
- $1,281 · $107/mo
- Projected year-2 tax
- $1,556 · $130/mo
- Expected delta
- +$275/yr (+$23/mo · 21.5%)
ⓘ Screening estimate from a state-policy table — verify with the county assessor before closing.
Climate risk First Street
- Flood 1/10 Low 0% chance over 30 yrs
- Wildfire 4/10 Moderate
- Heat 4/10 Moderate 7 d/yr ≥97°F today · 20 d/yr by 30 yrs out
- Wind 2/10 Low
- Air quality 1/10 Low 0 unhealthy d/yr today · 0 by 30 yrs out
Nearby sold comps map
Loading sold comps map…
Walkable amenities ~0.75 mi
Loading nearby amenities…
Taxation est. · year 1
- Rental income
- $13,900
- − Mortgage interest
- −$4,761
- − Property taxes
- −$1,281
- − Insurance
- −$425
- − Repairs & maintenance
- −$1,112
- − Management
- −$1,112
- − Depreciation
- −$2,473
- Taxable income
- $2,736
- Est. tax owed @ 24.0%
- −$657
- After-tax cash flow
- $3,270/yr
For passive investors: Depreciation is non-cash, so a rental often shows a tax loss while cash-flowing — sheltering income. Rental losses are passive: they offset passive income freely, and up to $25,000/yr can offset ordinary (W-2) income if you actively participate and your MAGI is under $100k (phasing out to $0 by $150k); unused losses carry forward. On sale, claimed depreciation is recaptured at up to 25%, and gains may owe capital-gains tax (a 1031 exchange can defer both). Figures are a year-1 estimate at your 24.0% rate — not tax advice; consult a CPA.
Schools (NCES district)
- District
- Springlake-Earth ISD
- NCES district ID
- 4841250
- Math proficiency
- 33% ▲ 13.00%
- Reading proficiency
- 36% ▲ 1.00%
- Median HH income
- $43,363
- Composite
- 31.95/100
- National rank
- #11045
- State rank
- #916 of 1141 in TX
Livability — Earth
- Score
- 64/100
- State rank
- #778
- US rank
- #14178
Category grades
Schools grade is shown separately in the Schools card above.
Census & demographics
- Census place
- Earth, TX
- Population (ZIP)
- 1,213
Population outlook (Lamb County) Hauer SSP2
- Today (2025)
- 12,357 people
- By 2030
- 11,878 · -3.9%
- By 2040
- 10,950 · -11.4%
- By 2050
- 9,929 · -19.6%
- By 2075
- 7,355 · -40.5%
- By 2100
- 4,603 · -62.7%
Race, ethnicity, and origin ACS 2023
- Neighborhood character
- Majority Hispanic (58%)
- Race & ethnicity
- Hispanic / Latino 58% White 34% Two or more races 26% Native American 4% Black 3%
- Hispanic origin (detail)
- Mexican 56%
- Foreign-born
- 9% · Canada
- Languages at home
- 55% English-only · Spanish 45%
Political lean MEDSL · Lamb
- 2024 margin
- Solid R (+64.3) · D 17.6% · R 81.9%
- 2008→2024 swing
- -15.9pp toward R · 2008: -48.4pp · 2024: -64.3pp
- All cycles
- 2024: R+64.3 2020: R+60.8 2016: R+58.1 2012: R+50.3 2008: R+48.4
Not yet ingested
- Civics
- —
Market trends
- HPI YoY
- ▲ 1.83%
- Current HPI
- 83.7743
- Rent YoY
- —
- Metro
- —
- State GDP YoY
- ▲ 3.95%
- F500 in state
- 110
Industry mix (Fortune 500 HQ in TX)
| Industry | F500 HQs | Revenue |
|---|---|---|
| Energy | 16 | $1,198B |
|
||
| Technology | 5 | $198B |
|
||
| Engineering / Construction | 4 | $72B |
|
||
| Energy Services | 3 | $60B |
|
||
| Utilities | 3 | $41B |
|
||
| Healthcare | 2 | $330B |
|
||
Price history
1 event — show timeline
- 2026-05-06 Listed $85,000 LARMLS
Property tax history
+5.1%/yrLatest (2025): $1,281 · +8.2% YoY. Source: county tax records.
Cash-flow waterfall
monthlySold comps — $/sqft
last 12 mo · ≤1 miLoading sold comps…