 5-Plex
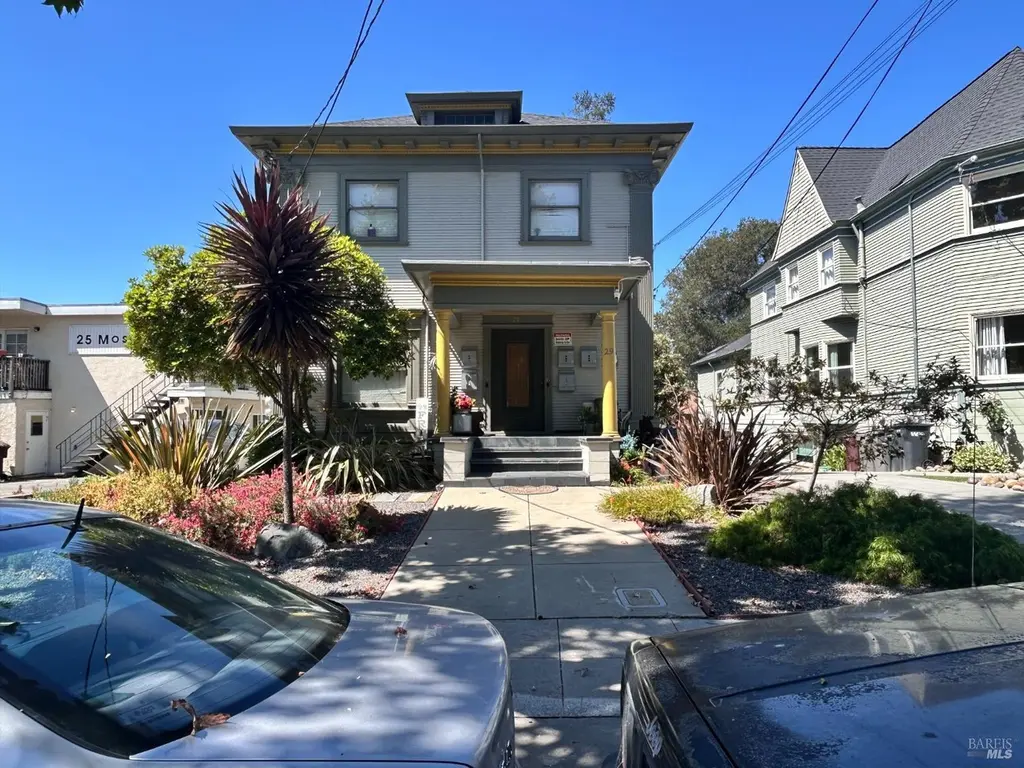
29 Moss Ave · Oakland, CA
Flood risk 1/10 · Minimal
- FEMA flood zone
- X (unshaded)
- Chance of flooding over 30 yrs
- 0.0%
- Est. flood insurance / yr
- $507 – $1,088
Fire risk 1/10 · Minimal
- Est. fire insurance / yr
- $659 – $1,223
Heat risk 3/10 · Minor
- Hot days now (above 84°F)
- 7 days/yr
- Hot days in 30 yrs
- 15 days/yr
Wind risk 1/10 · Minimal
- Chance of severe wind over 30 yrs
- —
Air-quality risk 9/10 · Severe
- Unhealthy air days now
- 16 days/yr
- Unhealthy air days in 30 yrs
- 16 days/yr
Risk factors via First Street. Map © Google.
Why this score? — see what drove the C grade
The composite is a weighted blend of 9 inputs, each scored 0–100. Each bar is that input's sub-score; the figure is the points it added to the 100-point composite (weight × sub-score).
- Cash flow +21.0/30.0
- ARV discount +13.2/15.0
- DSCR +6.7/10.0
- 1% rule +4.6/10.0
- Livability +3.6/5.0
- Rent growth +3.3/5.0
- Schools +3.0/10.0
- Condition / age +2.5/5.0
- Appreciation +0.0/10.0
$1,600,000
🖨 Deal sheet 📄 Offer letter ✓ Due diligence
Multi-family units
County records classify this as Multi-Family (2-4 Unit). Listing-text estimate: 5 units. estimate disagrees with records
Listing remarks MLS
Historic Charm Meets Modern Investment! Experience the best of the Grand Lake District at 29 Moss Avenue. Own this impressive 5-unit Victorian that perfectly balances its 1914 architectural soul with high-demand modern updates. A lovely building in one of Oakland's most walkable and iconic neighborhoods, sits moments from the neoclassical Grand Lake Theater and the vibrant shops of Grand Avenue. Four of the five units are updated, complemented with seller-owned solar power and separately metered electricity for each unit. This is truly a commuter's dream! With easy access nestled just north of I-580, offering a quick skip into San Francisco or easy access to the rest of the East Bay via nearby BART. This building has walkable charm, and friendly neighbors! This street is adorable with its "small-town" feel, winding hillside streets leading directly to local cafes, boutiques, and the famous Saturday Farmers Market. In fact, it is a historic area known as part of the "Linda Vista Terrace," this building offers a rare opportunity to own a piece of Oakland's preserved history,whether you're looking for a turnkey investment, or a historic gem in a "signature" Oakland neighborhood, this is the one you want
Key facts
- 5,998 sq ft lot
- 5 parking spots
- Built 1914
Neighborhood map
What this means for you Summary
Snapshot
- This is a 5 × 6-bed/4.0-bath units multifamily listed at $1.60M.
Deal economics
- At list price, monthly cash flow is $2k ($27k/yr) — positive. Per door: $451/mo.
- The deal already cash-flows at list — no discount required.
- To meet the 1% rule (rent ≥ 1% of price), the offer needs to be $1.54M (3.9% below list).
- Recommended offer: $1.54M (3.9% below list) — sets the bar for 1% rule.
- Cap rate 8.0% vs local median 2.4% in Oakland — top-decile yield for the area; either an underpriced asset or a hidden risk that comps aren't pricing in. Stress-test before assuming the spread holds.
Location & tenants
- Location reads 71/100 on livability (#224 in CA) — a middle-class / working-renter tenant base. Strengths: amenities A+, commute A+, employment A+; Watch: schools C-, crime F, cost of living F.
- Oakland Unified (urban): math 27% / reading 33% proficiency, ranked #1,007 of 1,400 in CA (top 72%) — families likely to look elsewhere, expect single-tenant / working-renter base with shorter leases; 68% free/reduced lunch — lower-income household profile, screen leases tightly.
- Market conditions: Rents rising (+3.3%/yr); 107 active listings in the ZIP; high-income renter base; 1,742 units permitted in Alameda County in 2024 (856 in 5+ unit buildings).
- At $15,374/mo this rent would consume 137% of the median local household income ($135k/yr) (locally 1614% of renters already pay >50% of income on rent) — very limited rent-growth headroom before tenants either downsize or default.
Forward outlook
- Local home prices are declining (-3.0%/yr); year-one equity from $11k of loan paydown is wiped out by about $48k of value loss. Plan a longer hold.
- Alameda County population projected at +34% by 2050 — long-run rental-demand tailwind backs the buy-and-hold thesis.
Negotiation context
- It's been on market 35 days — a 3% lower offer ($1.55M) is reasonable based on typical stale-listing flexibility.
- Current owner paid $235k; list at $1.60M implies a 581% gain — meaningful room to come down on a strong offer.
Risks & watch-outs
- Watch-outs: built in 1914 — expect roof / HVAC / electrical / plumbing capex.
Questions for the listing agent
- It's been on market 35 days. Have you received any prior offers? Is the seller open to a 4% concession, seller financing, or rate buy-down credit?
- Can we see the unit-by-unit rent roll, current vacancy, and any below-market leases? What's the average tenancy length?
- What capital expenditures (roof, boiler, parking lot, exteriors) have been made in the last 5 years, and what's planned in the next 2?
- Built in 1914 — when were the roof, HVAC, electrical panel, plumbing, and water heater last replaced?
- Is there a deadline driving the sale (1031 exchange, divorce, estate, relocation)? That informs how much negotiation room exists.
- Crime grade is F in this area — have there been break-ins, vandalism, or insurance claims at this property in the last 3 years? What carrier currently insures it and at what premium?
- What's the average days-on-market for RENTAL listings here right now (not sales)? A rising rental-DOM trend means longer vacancies and softer asking-rent achievability than the comps imply.
- What's the recent tenant-quality profile in this submarket — average credit score on applications, eviction rate, late-payment / NSF rate, and stable-employment percentage? A property-management company in the area should have these aggregated.
- How much new apartment / multifamily construction is in the pipeline within 1–3 miles? Heavy new supply (>2% of stock underway) typically softens rents 12–24 months out; light construction supports rent growth.
Investment metrics
- 1% rule
- 0.96% ✗
- Cap rate
- 7.98%
- Cash-on-cash
- 6.04%
- DSCR
- 1.27
- GRM
- 8.7
CMA / ARV
- ARV (median comp)
- $1,834,185
- List price
- $1,600,000
- Delta
- -12.77%
- Verdict
- UNDERPRICED
- Comps
- 20 within 1.0 mi
Show comp detail 4 sales within ~0.75 mi
| Address | Dist | Beds/Ba | Sqft | Sold | Price | $/sf | Match |
|---|---|---|---|---|---|---|---|
| 3501 Richmond Blvd | 0.36mi | 8/4.0 (+1) | 3,288 (+3%) | 24mo | $1,600,000 | $487 | 49 |
| 987 Vermont | 0.50mi | 8/4.0 (+1) | 3,324 (+4%) | 15mo | $1,365,000 | $411 | 48 |
| 2731 Harrison St | 0.48mi | 7/4.0 | 3,474 (+9%) | 19mo | $1,025,000 | $295 | 42 |
| 2719 Harrison St | 0.49mi | 8/4.0 (+1) | 3,648 (+14%) | 11mo | $1,500,000 | $411 | 35 |
Match score weights: distance 35% · size 25% · config 20% · recency 20%. Top-matched comps best support the ARV.
Projected returns pro-forma
-3.0% appreciation · 3.34% rent growth · sell at horizon
- IRR
- -6.7%
- Equity multiple
- 0.75×
- Total profit
- $-110,957
- Equity at exit
- $238,565
- IRR
- 3.3%
- Equity multiple
- 1.24×
- Total profit
- $108,021
- Equity at exit
- $138,339
Cash invested: $448,000 (down + closing). Projections, not guarantees.
Landlord ↔ Tenant lean methodology
- Overall (CITY)
- 0 Strongly Tenant-Friendly
- State California
- 18 Strongly Tenant-Friendly · D+13
- County
- — inherits STATE
- City Oakland
- 0 Strongly Tenant-Friendly · D+62
ZIP-level market 94610
- Rents YoY
- 3.3%
- Active inventory
- 107
- Price-to-rent
- 43.4×
Monthly cashflow live
- Estimated rent
- $15,374 medium interval (Pro) →
- Mortgage (P&I)
- −$8,391
- Tax from tax record
- −$835 /mo · $10,018/yr
- Insurance
- −$667
- HOA
- −$0
- Vacancy / Maint / Mgmt
- −$3,229
- Net cashflow
- $2,253
Break-even live
5-unit breakdown (identical units grouped — click to expand)
| Units | Beds | Baths | Est. rent |
|---|---|---|---|
| 5× units | 6 | 4 | $15,375 |
| #1 | 6 | 4 | $3,075 |
| #2 | 6 | 4 | $3,075 |
| #3 | 6 | 4 | $3,075 |
| #4 | 6 | 4 | $3,075 |
| #5 | 6 | 4 | $3,075 |
| Total (5 units) | $15,374 | ||
UW: 25.0% down · 7.5% · 30yr · 1.5% tax · 5.0% vac · 8.0% maint · 8.0% mgmt
Financing live
Cash to close
- Down payment
- $400,000
- Closing costs
- $48,000
- Reserves months
- —
- Total cash needed
- —
Loan-product check · same deal, 3 products live
Conventional
25% down · 7.5% · 30yr
- Down + closing
- —
- Monthly P&I
- —
- Monthly cashflow
- —
- DSCR
- —
- Eligible?
- —
Personal DTI + credit; lowest rate.
DSCR
20% down · 8.5% · 30yr
- Down + closing
- —
- Monthly P&I
- —
- Monthly cashflow
- —
- DSCR
- —
- Eligible?
- —
No personal income docs; deal must DSCR.
Hard money
10% down · 12.0% · 12mo
- Down + closing
- —
- Monthly P&I
- —
- Monthly cashflow
- —
- DSCR
- —
- Eligible?
- —
Short-term bridge; refi at stabilization.
Listing history 16 events
-
2026-06-18days on market $1,600,000 Active 35 DOM
-
2026-06-17days on market $1,600,000 Active 34 DOM
-
2026-06-16days on market $1,600,000 Active 33 DOM
-
2026-06-15days on market $1,600,000 Active 32 DOM
-
2026-06-13days on market $1,600,000 Active 30 DOM
-
2026-06-13days on market $1,600,000 Active 29 DOM
-
2026-06-09days on market $1,600,000 Active 26 DOM
-
2026-06-08days on market $1,600,000 Active 25 DOM
-
2026-06-07days on market $1,600,000 Active 24 DOM
-
2026-06-04days on market $1,600,000 Active 21 DOM
-
2026-06-03days on market $1,600,000 Active 20 DOM
-
2026-06-02days on market $1,600,000 Active 19 DOM
-
2026-06-01days on market $1,600,000 Active 18 DOM
-
2026-05-31days on market $1,600,000 Active 17 DOM
-
2026-05-13$1,600,000 Active 1255-char remark
Show marketing remark (1255 chars)
Historic Charm Meets Modern Investment! Experience the best of the Grand Lake District at 29 Moss Avenue. Own this impressive 5-unit Victorian that perfectly balances its 1914 architectural soul with high-demand modern updates. A lovely building in one of Oakland's most walkable and iconic neighborhoods, sits moments from the neoclassical Grand Lake Theater and the vibrant shops of Grand Avenue. Four of the five units are updated, complemented with seller-owned solar power and separately metered electricity for each unit. This is truly a commuter's dream! With easy access nestled just north of I-580, offering a quick skip into San Francisco or easy access to the rest of the East Bay via nearby BART. This building has walkable charm, and friendly neighbors! This street is adorable with its "small-town" feel, winding hillside streets leading directly to local cafes, boutiques, and the famous Saturday Farmers Market. In fact, it is a historic area known as part of the "Linda Vista Terrace," this building offers a rare opportunity to own a piece of Oakland's preserved history,whether you're looking for a turnkey investment, or a historic gem in a "signature" Oakland neighborhood, this is the one you want
-
1987-06-30soldstatus $235,000
ⓘ Source: listings_history table (triggers on properties + properties_extension) + one-shot
backfill from property_details.listing_events for pre-trigger history.
Tax reassessment forecast CA · Resets to sale price
- Current annual tax
- $10,018 · $835/mo
- Projected year-2 tax
- $12,160 · $1,013/mo
- Expected delta
- +$2,142/yr (+$178/mo · 21.4%)
ⓘ Screening estimate from a state-policy table — verify with the county assessor before closing.
Climate risk First Street
- Flood 1/10 Low FEMA zone X (unshaded) · 0% chance over 30 yrs
- Wildfire 1/10 Low
- Heat 3/10 Moderate 7 d/yr ≥84°F today · 15 d/yr by 30 yrs out
- Wind 1/10 Low
- Air quality 9/10 Extreme 16 unhealthy d/yr today · 16 by 30 yrs out
Nearby sold comps map
Loading sold comps map…
Walkable amenities ~0.75 mi
Loading nearby amenities…
Taxation est. · year 1
- Rental income
- $184,488
- − Mortgage interest
- −$89,625
- − Property taxes
- −$10,018
- − Insurance
- −$8,000
- − Repairs & maintenance
- −$14,759
- − Management
- −$14,759
- − Depreciation
- −$46,545
- Taxable income
- $781
- Est. tax owed @ 24.0%
- −$188
- After-tax cash flow
- $26,853/yr
For passive investors: Depreciation is non-cash, so a rental often shows a tax loss while cash-flowing — sheltering income. Rental losses are passive: they offset passive income freely, and up to $25,000/yr can offset ordinary (W-2) income if you actively participate and your MAGI is under $100k (phasing out to $0 by $150k); unused losses carry forward. On sale, claimed depreciation is recaptured at up to 25%, and gains may owe capital-gains tax (a 1031 exchange can defer both). Figures are a year-1 estimate at your 24.0% rate — not tax advice; consult a CPA.
Schools (NCES district)
- District
- Oakland Unified
- NCES district ID
- 0628050
- Math proficiency
- 27% ▬ 0.00%
- Reading proficiency
- 33% ▬ 0.00%
- Median HH income
- $55,194
- Composite
- 29.52/100
- National rank
- #11769
- State rank
- #1007 of 1400 in CA
Livability — Oakland
- Score
- 71/100
- State rank
- #224
- US rank
- #7245
Category grades
Schools grade is shown separately in the Schools card above.
Census & demographics
- Census place
- Oakland, CA
- County
- Alameda County · 1,614,355 people
- City population
- 385,993
- Metro
- San Francisco-Oakland-Berkeley, CA
- Population (ZIP)
- 32,628
- Household income
- $134,507
- Rent vs Own
- Severe rent burden
- 1614.0
Population outlook (Alameda County) Hauer SSP2
- Today (2025)
- 1,928,884 people
- By 2030
- 2,069,146 · +7.3%
- By 2040
- 2,338,405 · +21.2%
- By 2050
- 2,586,608 · +34.1%
- By 2075
- 3,061,911 · +58.7%
- By 2100
- 3,234,133 · +67.7%
Race, ethnicity, and origin ACS 2023
- Neighborhood character
- Diverse neighborhood (Simpson 0.69)
- Race & ethnicity
- White 50% Asian 17% Black 13% Two or more races 13% Hispanic / Latino 11%
- Hispanic origin (detail)
- Mexican 6%
- Common ancestry
- Italian 3% Lithuanian 3% Scotch-Irish 2%
- Foreign-born
- 18% · China, Canada, Vietnam
- Languages at home
- 77% English-only · Spanish 7% Chinese 4% Other Asian/Pacific 3%
Political lean MEDSL · Alameda
- 2024 margin
- Solid D (+53.6) · D 74.6% · R 21.0% · Other 4.4%
- 2008→2024 swing
- -5.9pp toward R · 2008: 59.5pp · 2024: 53.6pp
- All cycles
- 2024: D+53.6 2020: D+62.5 2016: D+64.4 2012: D+59.8 2008: D+59.5
Not yet ingested
- Civics
- —
Market trends
- HPI YoY
- ▼ -1222.50%
- Current HPI
- 290.482
- Rent YoY
- ▲ 3.34%
- Metro
- San Francisco-Oakland-Berkeley, CA
- State GDP YoY
- ▲ 3.21%
- F500 in state
- 116
Industry mix (Fortune 500 HQ in CA)
| Industry | F500 HQs | Revenue |
|---|---|---|
| Technology | 27 | $1,492B |
|
||
| Financial Services | 3 | $174B |
|
||
| Retail | 3 | $44B |
|
||
| Insurance | 3 | $26B |
|
||
| Media / Entertainment | 2 | $115B |
|
||
| Pharmaceuticals / Biotech | 2 | $62B |
|
||
Price history
+580.9% since first listed2 events — show timeline
- 2026-05-13 Listed $1,600,000 BAREIS
- 1987-06-30 Sold (Public Records) $235,000 Public Records
Property tax history
+3.0%/yrLatest (2025): $10,018 · +4.8% YoY. Source: county tax records.
Cash-flow waterfall
monthlySold comps — $/sqft
last 12 mo · ≤1 miLoading sold comps…