4820 Old Harrisburg Rd · Tyrone, PA
Flood risk 1/10 · Minimal
- FEMA flood zone
- X (unshaded)
- Chance of flooding over 30 yrs
- 0.0%
- Est. flood insurance / yr
- $507 – $1,088
Fire risk 1/10 · Minimal
- Est. fire insurance / yr
- $511 – $949
Heat risk 5/10 · Moderate
- Hot days now (above 102°F)
- 7 days/yr
- Hot days in 30 yrs
- 16 days/yr
Wind risk 3/10 · Minor
- Chance of severe wind over 30 yrs
- 5.0%
Air-quality risk 2/10 · Minimal
- Unhealthy air days now
- 1 days/yr
- Unhealthy air days in 30 yrs
- 2 days/yr
Risk factors via First Street. Map © Google.
Why this score? — see what drove the B grade
The composite is a weighted blend of 9 inputs, each scored 0–100. Each bar is that input's sub-score; the figure is the points it added to the 100-point composite (weight × sub-score).
- Cash flow +30.0/30.0
- 1% rule +10.0/10.0
- DSCR +10.0/10.0
- ARV discount +7.5/15.0
- Livability +3.9/5.0
- Schools +3.7/10.0
- Rent growth +2.5/5.0
- Condition / age +2.5/5.0
- Appreciation +0.0/10.0
$94,900
🖨 Deal sheet 📄 Offer letter ✓ Due diligence
Listing remarks MLS
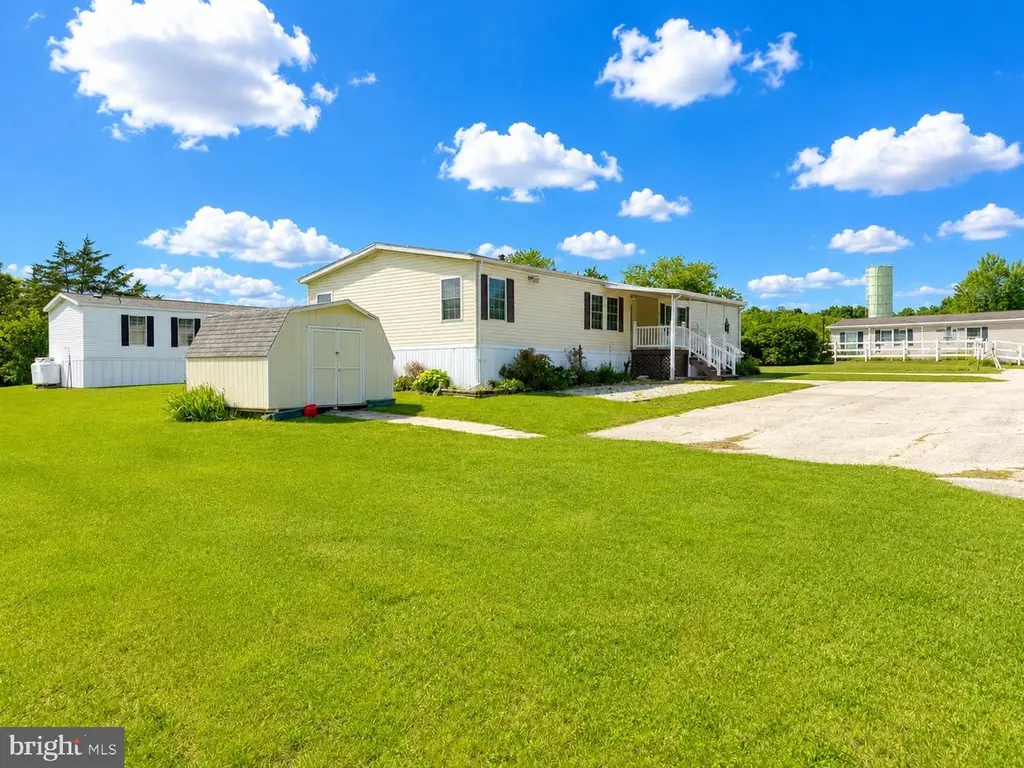
Enjoy the comforts of a quiet, clean, well-managed community while appreciating your spacious home on a large corner lot. This 2005 Fleetwood Anniversary provides a large living room/kitchen area leading to a master bedroom with walk-in closet and master bath on one side and 2 smaller bedrooms with a shared full bath on the other. The lot has plenty of parking space with 2 full driveways and a semi-private backyard overlooking stunning farm fields and hunting game lands. The home boasts several improvements in the past few months, including vinyl flooring in the living room, new storm doors, rebuilt decks, new skirting, new master bathroom vanity. Also includes a brand newer refrigerator and washer/dryer set. Buyer must qualify to rent the lot through RHP property management. Current lot rent, including water/sewer and community/road maintenance is $634.50/month.
Key facts
- Double-wide home
- Gourmet kitchen
- Stone fireplace
Tags
Property features AI
Finance
- Other: Property manager present; Not in a federal flood zone; Accessible with 2+ access exits; Pets allowed with breed and size/weight restrictions; Corner lot designation
- Financial info: Monthly ground rent payment; Ground rent amount reported
- HOA & community: Walnut Grove Mobile Home Park (ground rent monthly)
Exterior
- Parking: Asphalt driveway with 2 driveway spaces (total 2 garage/parking spaces)
- Utilities: Public water; Public sewer; Electric hot water; 100 amp electrical service; Cable internet; Municipal trash not provided
- Home design: Manufactured double-wide home; Southeast-facing main entrance; Estimated year built; Ground rent tenancy
- Construction: Vinyl siding; Shingle roof; Crawl space foundation; Double-hung windows; Building not winterized; Imperial make
- Exterior features: Corner lot/unit; Porch(es)
Interior
- Kitchen: Built-in range; Built-in microwave; Dishwasher; Refrigerator; Kitchen island
- Bedrooms: Three bedrooms on the main level
- Flooring: Carpet; Laminate plank; Vinyl
- Bathrooms: Two full bathrooms (both on the main level)
- Heating & cooling: Forced air heating; Propane (leased) heating fuel; Central air conditioning (electric)
- Interior features: Open floor plan with formal dining area; Gourmet kitchen with island; Master bathroom; Jetted tub and walk-in/stall shower; Recessed lighting; Chair railings; Walk-in closets; Window treatments; Paneled walls
- Laundry & utility: Washer and electric dryer in unit (main floor laundry); Has laundry
Neighborhood map
What this means for you Summary
Snapshot
- This is a 3-bed/2.0-bath manufactured listed at $95k.
Deal economics
- At list price, monthly cash flow is $647 ($8k/yr) — positive.
- The deal already cash-flows at list — no discount required.
- Meets the 1% rule at list price ($2k rent vs $95k).
- Cap rate 14.5% vs local median 3.5% in Tyrone — top-decile yield for the area; either an underpriced asset or a hidden risk that comps aren't pricing in. Stress-test before assuming the spread holds.
Location & tenants
- Location reads 77/100 on livability (#319 in PA, #2,838 nationally) — a middle-class / working-renter tenant base. Strengths: cost of living A+, housing A+, health & safety A+; Watch: amenities D, commute F, employment F.
- Upper Adams SD (rural): math 33% / reading 52% proficiency, ranked #298 of 539 in PA (top 55%) — families likely to look elsewhere, expect single-tenant / working-renter base with shorter leases.
- Zoned schools: Biglerville Hs (math 62% / reading 24%, grade F, #215 of 437 statewide, top 50%, 529 students, 39% FRL) — zoned schools at 39% FRL track the district average.
- Market conditions: 313 active listings in the ZIP; solid renter incomes; 403 units permitted in Adams County in 2024 (0 in 5+ unit buildings).
Forward outlook
- Local home prices are declining (-3.0%/yr); year-one equity from $656 of loan paydown is wiped out by about $3k of value loss. Plan a longer hold.
- Adams County population projected at -10% by 2050 — secular population decline; favor cash flow + early exit over multi-decade hold.
- At projected returns (-3.0% appreciation + 3.0% rent growth), your $27k cash investment doubles in ~5 years — after that, you're playing with house money.
Negotiation context
- Only 3 days on market — expect competitive offers; lowballing is unlikely to land.
- 36 sale attempts since 24y ago with the ask held roughly flat each time — persistent listings suggest the price (not the market) is what's stuck; bring a comps-based counter.
- Current owner paid $80k; 19% above their basis — modest negotiation headroom, anchor on the comps not their cost.
Risks & watch-outs
- Climate carrying-cost: extreme-heat days projected 7→16/yr by 2055 (HVAC capex compounding) — expect insurance premiums to compound above CPI over the hold.
Questions for the listing agent
- Is there a deadline driving the sale (1031 exchange, divorce, estate, relocation)? That informs how much negotiation room exists.
- Schools are A-rated — typically a magnet for longer-tenancy family renters. What's the average tenant stay here, and is there a school-zone premium baked into asking?
- What's the average days-on-market for RENTAL listings here right now (not sales)? A rising rental-DOM trend means longer vacancies and softer asking-rent achievability than the comps imply.
- What's the recent tenant-quality profile in this submarket — average credit score on applications, eviction rate, late-payment / NSF rate, and stable-employment percentage? A property-management company in the area should have these aggregated.
- How much new for-sale + rental construction is in the pipeline within 1–3 miles? Heavy new supply typically softens prices + rents 12–24 months out; constrained supply supports both.
Investment metrics
- 1% rule
- 1.66% ✓
- Cap rate
- 14.48%
- Cash-on-cash
- 29.24%
- DSCR
- 2.30
- GRM
- 5.0
CMA / ARV
No comps found within radius.
Projected returns pro-forma
-3.0% appreciation · 3.0% rent growth · sell at horizon
- IRR
- 23.6%
- Equity multiple
- 1.97×
- Total profit
- $25,842
- Equity at exit
- $14,150
- IRR
- 31.5%
- Equity multiple
- 3.84×
- Total profit
- $75,549
- Equity at exit
- $8,205
Cash invested: $26,572 (down + closing). Projections, not guarantees.
Landlord ↔ Tenant lean methodology
- Overall (STATE)
- 62 Landlord-Friendly
- State Pennsylvania
- 62 Landlord-Friendly · EVEN
- County
- — inherits STATE
- City
- — inherits STATE
ZIP-level market 17325
- Home prices YoY
- -22.4%
- Active inventory
- 313
- Price-to-rent
- 5.0×
Monthly cashflow live
- Estimated rent
- $1,578 medium interval (Pro) →
- Mortgage (P&I)
- −$498
- Tax from tax record
- −$62 /mo · $742/yr
- Insurance
- −$40
- HOA
- −$0
- Vacancy / Maint / Mgmt
- −$331
- Net cashflow
- $647
Break-even live
UW: 25.0% down · 7.5% · 30yr · 1.5% tax · 5.0% vac · 8.0% maint · 8.0% mgmt
Financing live
Cash to close
- Down payment
- $23,725
- Closing costs
- $2,847
- Reserves months
- —
- Total cash needed
- —
Loan-product check · same deal, 3 products live
Conventional
25% down · 7.5% · 30yr
- Down + closing
- —
- Monthly P&I
- —
- Monthly cashflow
- —
- DSCR
- —
- Eligible?
- —
Personal DTI + credit; lowest rate.
DSCR
20% down · 8.5% · 30yr
- Down + closing
- —
- Monthly P&I
- —
- Monthly cashflow
- —
- DSCR
- —
- Eligible?
- —
No personal income docs; deal must DSCR.
Hard money
10% down · 12.0% · 12mo
- Down + closing
- —
- Monthly P&I
- —
- Monthly cashflow
- —
- DSCR
- —
- Eligible?
- —
Short-term bridge; refi at stabilization.
Listing history 3 events
-
2026-06-15days on market $94,900 Active 3 DOM
-
2026-06-12remarks 693-char remark
-
2026-06-12$94,900 Active 1 DOM
ⓘ Source: listings_history table (triggers on properties + properties_extension) + one-shot
backfill from property_details.listing_events for pre-trigger history.
Tax reassessment forecast PA · Partial reset (capped growth)
- Current annual tax
- $742 · $62/mo
- Projected year-2 tax
- $1,121 · $93/mo
- Expected delta
- +$379/yr (+$32/mo · 51.0%)
ⓘ Screening estimate from a state-policy table — verify with the county assessor before closing.
Climate risk First Street
- Flood 1/10 Low FEMA zone X (unshaded) · 0% chance over 30 yrs
- Wildfire 1/10 Low
- Heat 5/10 Major 7 d/yr ≥102°F today · 16 d/yr by 30 yrs out
- Wind 3/10 Moderate 5% chance of damaging wind over 30 yrs
- Air quality 2/10 Low 1 unhealthy d/yr today · 2 by 30 yrs out
Nearby sold comps map
Loading sold comps map…
Walkable amenities ~0.75 mi
Loading nearby amenities…
Taxation est. · year 1
- Rental income
- $18,933
- − Mortgage interest
- −$5,316
- − Property taxes
- −$742
- − Insurance
- −$474
- − Repairs & maintenance
- −$1,515
- − Management
- −$1,515
- − Depreciation
- −$2,761
- Taxable income
- $6,610
- Est. tax owed @ 24.0%
- −$1,587
- After-tax cash flow
- $6,182/yr
For passive investors: Depreciation is non-cash, so a rental often shows a tax loss while cash-flowing — sheltering income. Rental losses are passive: they offset passive income freely, and up to $25,000/yr can offset ordinary (W-2) income if you actively participate and your MAGI is under $100k (phasing out to $0 by $150k); unused losses carry forward. On sale, claimed depreciation is recaptured at up to 25%, and gains may owe capital-gains tax (a 1031 exchange can defer both). Figures are a year-1 estimate at your 24.0% rate — not tax advice; consult a CPA.
Schools (NCES district)
- District
- Upper Adams SD
- NCES district ID
- 4224300
- Math proficiency
- 33% ▼ -17.00%
- Reading proficiency
- 52% ▼ -14.00%
- Median HH income
- $56,964
- Composite
- 37.16/100
- National rank
- #4482
- State rank
- #298 of 539 in PA
Livability — Tyrone
- Score
- 77/100
- State rank
- #319
- US rank
- #2838
Category grades
Schools grade is shown separately in the Schools card above.
Census & demographics
- Census place
- Heidlersburg, PA
- County
- Adams County · 30,373 people
- City population
- 13,000
- Metro
- Gettysburg, PA
- Population (ZIP)
- 30,373
- Household income
- $80,948
- Rent vs Own
- Severe rent burden
- 447.0
Population outlook (Adams County) Hauer SSP2
- Today (2025)
- 102,494 people
- By 2030
- 101,890 · -0.6%
- By 2040
- 98,417 · -4.0%
- By 2050
- 92,014 · -10.2%
- By 2075
- 76,128 · -25.7%
- By 2100
- 58,931 · -42.5%
Race, ethnicity, and origin ACS 2023
- Neighborhood character
- Predominantly White (83%)
- Race & ethnicity
- White 83% Hispanic / Latino 9% Two or more races 5% Black 4% Asian 2%
- Hispanic origin (detail)
- Mexican 4% Puerto Rican 2%
- Common ancestry
- Romanian 3% Lithuanian 3% Serbian 2%
- Foreign-born
- 5% · Canada, China, Vietnam
- Languages at home
- 92% English-only · Spanish 4% Other Indo-European 1% Russian/Polish/Slavic 1%
Political lean MEDSL · Adams
- 2024 margin
- Solid R (+33.6) · D 32.7% · R 66.4%
- 2008→2024 swing
- -14.1pp toward R · 2008: -19.6pp · 2024: -33.6pp
- All cycles
- 2024: R+33.6 2020: R+34.1 2016: R+36.4 2012: R+27.6 2008: R+19.6
Not yet ingested
- Civics
- —
Market trends
- HPI YoY
- ▼ -81.49%
- Current HPI
- 282.6594
- Rent YoY
- —
- Metro
- Gettysburg, PA
- State GDP YoY
- ▲ 1.68%
- F500 in state
- 34
Industry mix (Fortune 500 HQ in PA)
| Industry | F500 HQs | Revenue |
|---|---|---|
| Healthcare | 2 | $309B |
|
||
| Insurance | 2 | $27B |
|
||
| Telecommunications / Media | 1 | $124B |
|
||
| Industrial Distribution | 1 | $22B |
|
||
| Financial Services | 1 | $20B |
|
||
| Chemicals / Materials | 1 | $18B |
|
||
Price history
+126.5% since first listed97 events — show timeline
- 2026-06-12 Listed $94,900 BRIGHT MLS
- 2024-10-25 Sold (MLS) $80,000 BRIGHT MLS
- 2024-09-24 Pending — BRIGHT MLS
- 2024-09-04 Listed $80,000 BRIGHT MLS
- 2024-05-03 Sold (MLS) $84,500 BRIGHT MLS
- 2024-04-19 Sold (MLS) $65,000 BRIGHT MLS
- 2024-04-06 Pending — BRIGHT MLS
- 2024-04-04 Listed $85,000 BRIGHT MLS
- 2024-03-30 Pending — BRIGHT MLS
- 2024-03-12 Listed $69,000 BRIGHT MLS
- 2024-01-23 Sold (MLS) $60,000 BRIGHT MLS
- 2024-01-23 Pending — BRIGHT MLS
- 2023-12-15 Listed $65,000 BRIGHT MLS
- 2023-12-03 Coming Soon $65,000 BRIGHT MLS
- 2023-08-24 Sold (MLS) $65,000 BRIGHT MLS
- 2023-08-01 Pending — BRIGHT MLS
- 2023-06-24 Price Changed $65,000 BRIGHT MLS
- 2023-05-18 Price Changed $69,000 BRIGHT MLS
- 2023-05-04 Listed $75,000 BRIGHT MLS
- 2023-01-20 Sold (MLS) $49,900 BRIGHT MLS
- 2022-12-14 Pending — BRIGHT MLS
- 2022-12-12 Listed $49,900 BRIGHT MLS
- 2022-06-01 Sold (MLS) $59,000 BRIGHT MLS
- 2022-05-13 Pending — BRIGHT MLS
- 2022-05-04 Listed $59,000 BRIGHT MLS
- 2021-06-21 Listing Removed — BRIGHT MLS
- 2021-06-18 Sold (MLS) $27,500 BRIGHT MLS
- 2021-06-08 Pending — BRIGHT MLS
- 2021-06-04 Relisted — BRIGHT MLS
- 2021-05-21 Contingent — BRIGHT MLS
- 2021-05-20 Price Changed $27,500 BRIGHT MLS
- 2021-05-14 Pending — BRIGHT MLS
- 2021-05-13 Listed $30,000 BRIGHT MLS
- 2021-04-30 Relisted — BRIGHT MLS
- 2021-03-17 Sold (MLS) $54,900 BRIGHT MLS
- 2021-03-15 Pending — BRIGHT MLS
- 2021-03-10 Pending — BRIGHT MLS
- 2021-03-02 Relisted — BRIGHT MLS
- 2021-02-26 Pending — BRIGHT MLS
- 2021-02-25 Listed $29,900 BRIGHT MLS
- 2021-01-30 Contingent — BRIGHT MLS
- 2020-10-22 Relisted — BRIGHT MLS
- 2020-10-10 Pending — BRIGHT MLS
- 2020-10-08 Listed $54,900 BRIGHT MLS
- 2020-08-14 Sold (MLS) $32,000 BRIGHT MLS
- 2020-07-31 Pending — BRIGHT MLS
- 2020-07-19 Contingent — BRIGHT MLS
- 2020-06-18 Listed $32,000 BRIGHT MLS
- 2020-05-12 Listing Removed — BRIGHT MLS
- 2020-05-12 Listing Removed — BRIGHT MLS
- 2020-05-12 Listing Removed — BRIGHT MLS
- 2019-10-25 Sold (MLS) $35,000 BRIGHT MLS
- 2019-10-04 Pending — BRIGHT MLS
- 2019-10-02 Contingent — BRIGHT MLS
- 2019-09-13 Relisted — BRIGHT MLS
- 2019-09-11 Pending — BRIGHT MLS
- 2019-09-10 Price Changed $42,500 BRIGHT MLS
- 2019-08-24 Listed $47,500 BRIGHT MLS
- 2018-06-28 Sold (MLS) $35,000 BRIGHT MLS
- 2018-06-01 Listing Removed — BRIGHT MLS
- 2018-04-26 Listed $42,000 BRIGHT MLS
- 2016-07-07 Sold (MLS) $30,500 BRIGHT MLS
- 2016-06-14 Listing Removed — BRIGHT MLS
- 2016-03-08 Listed $37,900 BRIGHT MLS
- 2015-11-18 Sold (MLS) $24,000 BRIGHT MLS
- 2015-10-31 Listing Removed — BRIGHT MLS
- 2015-10-01 Listing Removed — BRIGHT MLS
- 2015-09-09 Listed $29,000 BRIGHT MLS
- 2015-07-22 Listed $51,900 BRIGHT MLS
- 2015-04-15 Listed $35,000 BRIGHT MLS
- 2014-12-31 Listing Removed — BRIGHT MLS
- 2014-08-18 Listing Removed — BRIGHT MLS
- 2014-07-30 Listed $35,000 BRIGHT MLS
- 2014-07-22 Listed $37,500 BRIGHT MLS
- 2014-06-26 Listed $37,500 BRIGHT MLS
- 2014-01-06 Listing Removed — BRIGHT MLS
- 2013-12-31 Listing Removed — BRIGHT MLS
- 2013-11-26 Listed $40,000 BRIGHT MLS
- 2013-11-11 Listed $58,000 BRIGHT MLS
- 2013-01-13 Listed $40,000 BRIGHT MLS
- 2010-03-19 Listing Removed — BRIGHT MLS
- 2009-08-10 Listed $40,900 BRIGHT MLS
- 2006-10-24 Listing Removed — BRIGHT MLS
- 2006-06-23 Listed $76,900 BRIGHT MLS
- 2005-02-28 Sold (MLS) $52,000 BRIGHT MLS
- 2004-08-06 Listing Removed — BRIGHT MLS
- 2004-08-06 Listed $50,000 BRIGHT MLS
- 2004-05-31 Listing Removed — BRIGHT MLS
- 2003-12-04 Listed $45,000 BRIGHT MLS
- 2003-04-07 Listing Removed — BRIGHT MLS
- 2003-03-13 Listing Removed — BRIGHT MLS
- 2003-01-18 Listing Removed — BRIGHT MLS
- 2002-12-31 Listing Removed — BRIGHT MLS
- 2002-11-05 Listed $24,900 BRIGHT MLS
- 2002-10-28 Listing Removed — BRIGHT MLS
- 2002-10-17 Listed $21,500 BRIGHT MLS
- 2002-09-16 Listed $41,900 BRIGHT MLS
Property tax history
+2.7%/yrLatest (2026): $742 · +0.0% YoY. Source: county tax records.
Cash-flow waterfall
monthlySold comps — $/sqft
last 12 mo · ≤1 miLoading sold comps…