 🏷️ Likely Rental
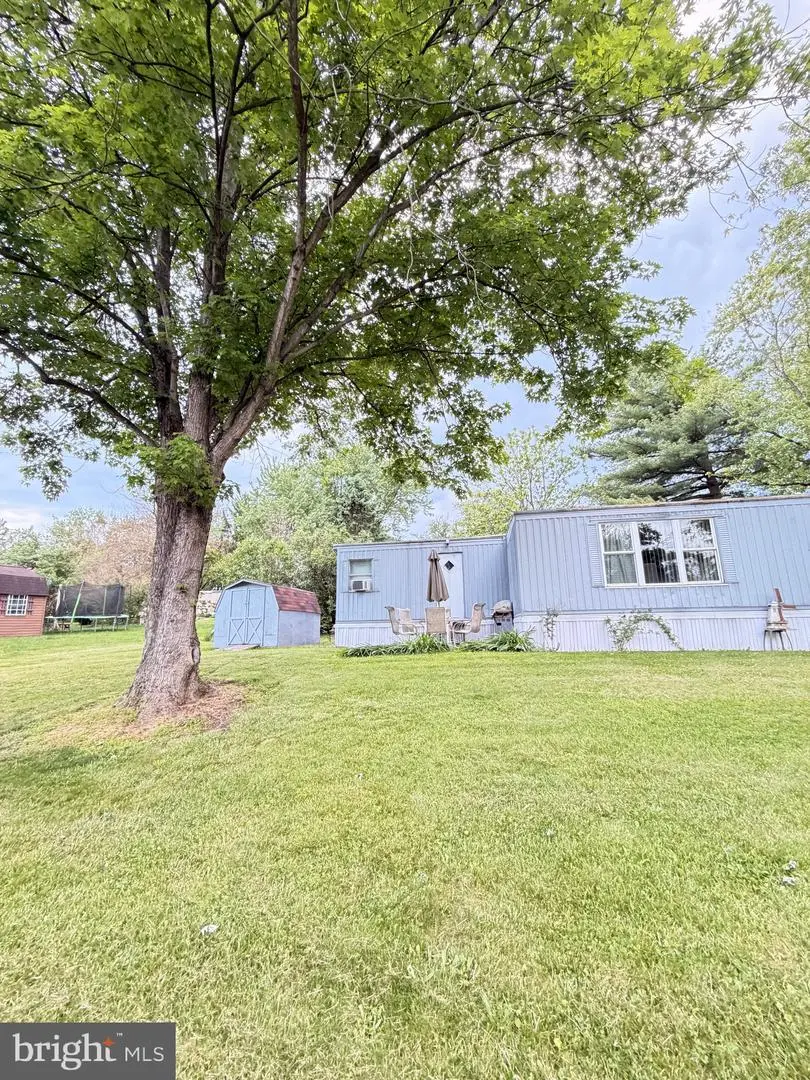
34 Cypress Ln · Middlesex, PA
Flood risk 1/10 · Minimal
- FEMA flood zone
- X (unshaded)
- Chance of flooding over 30 yrs
- 0.0%
- Est. flood insurance / yr
- $507 – $1,088
Fire risk 2/10 · Minimal
- Est. fire insurance / yr
- $511 – $949
Heat risk 5/10 · Moderate
- Hot days now (above 101°F)
- 7 days/yr
- Hot days in 30 yrs
- 15 days/yr
Wind risk 2/10 · Minimal
- Chance of severe wind over 30 yrs
- 4.0%
Air-quality risk 2/10 · Minimal
- Unhealthy air days now
- 1 days/yr
- Unhealthy air days in 30 yrs
- 1 days/yr
Risk factors via First Street. Map © Google.
Why this score? — see what drove the C- grade
The composite is a weighted blend of 9 inputs, each scored 0–100. Each bar is that input's sub-score; the figure is the points it added to the 100-point composite (weight × sub-score).
- Cash flow +15.0/30.0
- ARV discount +15.0/15.0
- Schools +5.6/10.0
- 1% rule +5.0/10.0
- DSCR +5.0/10.0
- Rent growth +2.5/5.0
- Livability +2.5/5.0
- Condition / age +2.5/5.0
- Appreciation +0.0/10.0
$29,900
🖨 Deal sheet 📄 Offer letter ✓ Due diligence
Listing remarks
Here’s a cleaner, more professional listing description you can use: ⸻ For Sale – As Is | Country Manor West MHP Spacious 2-bedroom, 2.5-bath home located in the desirable Country Manor West Mobile Home Park community featuring access to a community pool. Home features: * 2 bedrooms * 1 bathrooms (there’s plumbing ran already for a second bathroom in the bedroom, half bathroom was originally there) just need a toilet and sink! * 2 porches * Storage shed included * Community pool access Lot rent is $710/month and includes water, sewer, and trash services. Important Details: * Sold as-is * No rent-to-own * Price negotiable * Buyer must be park approved *
Key facts
- Community pool
- Built 1974
- Listed 34 days
Property features AI
Finance
- Other: Annual ground rent listed as an income/expense item
- Financial info: Land lease payment $710 per month; Land lease years remaining reported as 0; Improvement assessed at $2,400
Exterior
- Parking: Off-site parking available; Driveway
- Utilities: Public sewer; Community water
- Home design: Manufactured home; Above-grade finished area reported by assessor
- Construction: Shingle siding; Other structures above and below grade
- Exterior features: Community pool (in-ground, fenced, filtered); Not in a federal flood zone; Ground rent exists (paid annually)
Interior
- Bedrooms: 2 bedrooms on main level
- Bathrooms: 1 full bathroom on main level
- Heating & cooling: Baseboard electric heating; Electric hot water
- Interior features: No basement; Living area sourced from assessor
Neighborhood map
What this means for you Summary
Snapshot
- This is a 2-bed/1.5-bath manufactured listed at $30k.
Deal economics
- At list price, monthly cash flow is $1k ($14k/yr) — positive.
- The deal already cash-flows at list — no discount required.
- Meets the 1% rule at list price ($2k rent vs $30k).
- Recommended offer: $29k (3.0% below list) — sets the bar for market timing.
Location & tenants
- Location reads: area grade C — affects rentability + tenant quality, not the cash-flow math above.
- Cumberland Valley SD (suburban): math 54% / reading 71% proficiency, ranked #52 of 539 in PA (top 10%) — acceptable for families but not a draw, mixed tenant base, ~2y average lease; only 13% free/reduced lunch — higher-income household profile.
- Zoned schools: Cumberland Valley Hs (math 66% / reading 24%, grade D-, #191 of 437 statewide, top 44%, 3,035 students, 25% FRL).
- Zoned-school proficiency averages 45% at this address vs 62% district-wide (-17 pts) — the specific schools serving this property underperform the Cumberland Valley SD average; the district grade overstates school quality for this exact location.
- Market conditions: 188 active listings in the ZIP; solid renter incomes; 1,052 units permitted in Cumberland County in 2024 (310 in 5+ unit buildings).
Forward outlook
- Local home prices are declining (-3.0%/yr); year-one equity from $207 of loan paydown is wiped out by about $897 of value loss. Plan a longer hold.
- Cumberland County population projected at +17% by 2050 — long-run rental-demand tailwind backs the buy-and-hold thesis.
- At projected returns (-3.0% appreciation + 3.0% rent growth), your $8k cash investment doubles in ~1 year — after that, you're playing with house money.
Negotiation context
- It's been on market 34 days — a 3% lower offer ($29k) is reasonable based on typical stale-listing flexibility.
Risks & watch-outs
- Climate carrying-cost: extreme-heat days projected 7→15/yr by 2055 (HVAC capex compounding) — expect insurance premiums to compound above CPI over the hold.
Questions for the listing agent
- It's been on market 34 days. Have you received any prior offers? Is the seller open to a 3% concession, seller financing, or rate buy-down credit?
- Built in 1974 — when were the roof, HVAC, electrical panel, plumbing, and water heater last replaced?
- Is there a deadline driving the sale (1031 exchange, divorce, estate, relocation)? That informs how much negotiation room exists.
- What's the average days-on-market for RENTAL listings here right now (not sales)? A rising rental-DOM trend means longer vacancies and softer asking-rent achievability than the comps imply.
- What's the recent tenant-quality profile in this submarket — average credit score on applications, eviction rate, late-payment / NSF rate, and stable-employment percentage? A property-management company in the area should have these aggregated.
- How much new for-sale + rental construction is in the pipeline within 1–3 miles? Heavy new supply typically softens prices + rents 12–24 months out; constrained supply supports both.
Investment metrics
- 1% rule
- 5.86% ✓
- Cap rate
- 53.57%
- Cash-on-cash
- 168.84%
- DSCR
- 8.51
- GRM
- 1.4
CMA / ARV
- ARV (median comp)
- $38,834
- List price
- $29,900
- Delta
- -23.01%
- Verdict
- UNDERPRICED
- Comps
- 20 within 1.0 mi
Show comp detail 2 sales within ~0.75 mi
| Address | Dist | Beds/Ba | Sqft | Sold | Price | $/sf | Match |
|---|---|---|---|---|---|---|---|
| 52 Buckeye Ln | 0.11mi | 2/1.0 | 1,032 (+13%) | 6mo | $1,500 | $1 | 66 |
| 41 Cherry Ln | 0.12mi | 2/1.5 | 792 (-13%) | 7mo | $35,000 | $44 | 66 |
Match score weights: distance 35% · size 25% · config 20% · recency 20%. Top-matched comps best support the ARV.
Projected returns pro-forma
-3.0% appreciation · 3.0% rent growth · sell at horizon
- IRR
- —
- Equity multiple
- 9.39×
- Total profit
- $70,205
- Equity at exit
- $4,458
- IRR
- —
- Equity multiple
- 19.85×
- Total profit
- $157,845
- Equity at exit
- $2,585
Cash invested: $8,372 (down + closing). Projections, not guarantees.
Landlord ↔ Tenant lean methodology
- Overall (STATE)
- 62 Landlord-Friendly
- State Pennsylvania
- 62 Landlord-Friendly · EVEN
- County
- — inherits STATE
- City
- — inherits STATE
ZIP-level market 17015
- Home prices YoY
- -25.2%
- Active inventory
- 188
- Price-to-rent
- 1.4×
Monthly cashflow live
- Estimated rent
- $1,753 medium interval (Pro) →
- Mortgage (P&I)
- −$157
- Tax est. 1.5%
- −$37 /mo · $448/yr
- Insurance
- −$12
- HOA
- −$0
- Vacancy / Maint / Mgmt
- −$368
- Net cashflow
- $1,178
Break-even live
UW: 25.0% down · 7.5% · 30yr · 1.5% tax · 5.0% vac · 8.0% maint · 8.0% mgmt
Financing live
Cash to close
- Down payment
- $7,475
- Closing costs
- $897
- Reserves months
- —
- Total cash needed
- —
Loan-product check · same deal, 3 products live
Conventional
25% down · 7.5% · 30yr
- Down + closing
- —
- Monthly P&I
- —
- Monthly cashflow
- —
- DSCR
- —
- Eligible?
- —
Personal DTI + credit; lowest rate.
DSCR
20% down · 8.5% · 30yr
- Down + closing
- —
- Monthly P&I
- —
- Monthly cashflow
- —
- DSCR
- —
- Eligible?
- —
No personal income docs; deal must DSCR.
Hard money
10% down · 12.0% · 12mo
- Down + closing
- —
- Monthly P&I
- —
- Monthly cashflow
- —
- DSCR
- —
- Eligible?
- —
Short-term bridge; refi at stabilization.
Listing history 18 events
-
2026-06-18days on market $29,900 Active 34 DOM
-
2026-06-17days on market $29,900 Active 33 DOM
-
2026-06-16days on market $29,900 Active 32 DOM
-
2026-06-15days on market $29,900 Active 31 DOM
-
2026-06-14days on market $29,900 Active 29 DOM
-
2026-06-13days on market $29,900 Active 28 DOM
-
2026-06-10days on market $29,900 Active 26 DOM
-
2026-06-09days on market $29,900 Active 25 DOM
-
2026-06-08days on market $29,900 Active 24 DOM
-
2026-06-07days on market $29,900 Active 23 DOM
-
2026-06-05days on market $29,900 Active 20 DOM
-
2026-06-03days on market $29,900 Active 19 DOM
-
2026-06-02days on market $29,900 Active 18 DOM
-
2026-06-01days on market $29,900 Active 17 DOM
-
2026-05-31days on market $29,900 Active 16 DOM
-
2026-05-31days on market $29,900 Active 15 DOM
-
2026-05-16$29,900 Active 820-char remark
-
2026-05-15historical $29,900 820-char remark
ⓘ Source: listings_history table (triggers on properties + properties_extension) + one-shot
backfill from property_details.listing_events for pre-trigger history.
Climate risk First Street
- Flood 1/10 Low FEMA zone X (unshaded) · 0% chance over 30 yrs
- Wildfire 2/10 Low
- Heat 5/10 Major 7 d/yr ≥101°F today · 15 d/yr by 30 yrs out
- Wind 2/10 Low 4% chance of damaging wind over 30 yrs
- Air quality 2/10 Low 1 unhealthy d/yr today · 1 by 30 yrs out
Nearby sold comps map
Loading sold comps map…
Walkable amenities ~0.75 mi
Loading nearby amenities…
Taxation est. · year 1
- Rental income
- $21,031
- − Mortgage interest
- −$1,675
- − Property taxes
- −$448
- − Insurance
- −$150
- − Repairs & maintenance
- −$1,683
- − Management
- −$1,683
- − Depreciation
- −$870
- Taxable income
- $14,524
- Est. tax owed @ 24.0%
- −$3,486
- After-tax cash flow
- $10,650/yr
For passive investors: Depreciation is non-cash, so a rental often shows a tax loss while cash-flowing — sheltering income. Rental losses are passive: they offset passive income freely, and up to $25,000/yr can offset ordinary (W-2) income if you actively participate and your MAGI is under $100k (phasing out to $0 by $150k); unused losses carry forward. On sale, claimed depreciation is recaptured at up to 25%, and gains may owe capital-gains tax (a 1031 exchange can defer both). Figures are a year-1 estimate at your 24.0% rate — not tax advice; consult a CPA.
Schools (NCES district)
- District
- Cumberland Valley SD
- NCES district ID
- 4207110
- Math proficiency
- 54% ▼ -6.00%
- Reading proficiency
- 71% ▼ -7.00%
- Median HH income
- $78,135
- Composite
- 55.77/100
- National rank
- #1218
- State rank
- #52 of 539 in PA
Livability — Middlesex
No livability data for this city. (Only ~50 U.S. cities are tracked.)
Census & demographics
- County
- Cumberland County · 257,673 people
- Metro
- Harrisburg-Carlisle, PA
- Population (ZIP)
- 24,385
- Household income
- $86,981
- Rent vs Own
- Severe rent burden
- 172.0
Population outlook (Cumberland County) Hauer SSP2
- Today (2025)
- 267,950 people
- By 2030
- 278,105 · +3.8%
- By 2040
- 296,552 · +10.7%
- By 2050
- 312,937 · +16.8%
- By 2075
- 349,233 · +30.3%
- By 2100
- 361,875 · +35.1%
Race, ethnicity, and origin ACS 2023
- Neighborhood character
- Predominantly White (94%)
- Race & ethnicity
- White 94% Two or more races 2% Hispanic / Latino 2%
- Common ancestry
- Romanian 3% Lithuanian 2% Slovak 2%
- Foreign-born
- 2% · Canada
- Languages at home
- 97% English-only · German/W. Germanic 1% Spanish 1% Other Indo-European 1%
Political lean MEDSL · Cumberland
- 2024 margin
- Lean R (+9.4) · D 44.6% · R 54.1% · Other 1.3%
- 2008→2024 swing
- +4.2pp toward D · 2008: -13.6pp · 2024: -9.4pp
- All cycles
- 2024: R+9.4 2020: R+10.6 2016: R+18.6 2012: R+18.5 2008: R+13.6
Not yet ingested
- Civics
- —
Market trends
- HPI YoY
- ▼ -89.66%
- Current HPI
- 265.9175
- Rent YoY
- —
- Metro
- Harrisburg-Carlisle, PA
- State GDP YoY
- ▲ 1.68%
- F500 in state
- 34
Industry mix (Fortune 500 HQ in PA)
| Industry | F500 HQs | Revenue |
|---|---|---|
| Healthcare | 2 | $309B |
|
||
| Insurance | 2 | $27B |
|
||
| Telecommunications / Media | 1 | $124B |
|
||
| Industrial Distribution | 1 | $22B |
|
||
| Financial Services | 1 | $20B |
|
||
| Chemicals / Materials | 1 | $18B |
|
||
Price history
+0.0% since first listed2 events — show timeline
- 2026-05-16 Listed $29,900 BRIGHT MLS
- 2026-05-15 Coming Soon $29,900 BRIGHT MLS
Property tax history
+3.4%/yrLatest (2026): $43 · +3.2% YoY. Source: county tax records.
Cash-flow waterfall
monthlySold comps — $/sqft
last 12 mo · ≤1 miLoading sold comps…