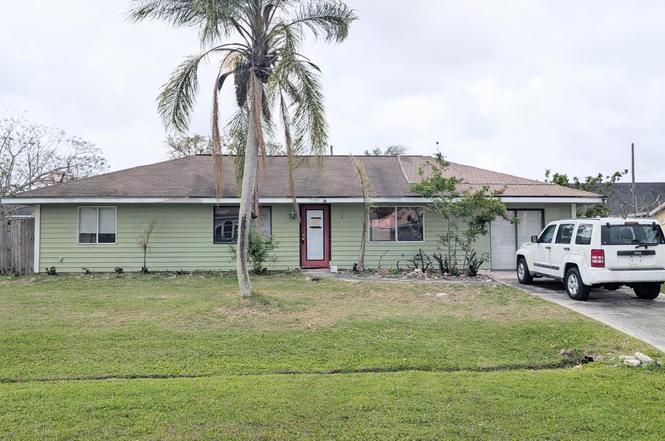
2481 SE Addison St · Port St. Lucie, FL
Flood risk 5/10 · Moderate
- FEMA flood zone
- X (shaded)
- Chance of flooding over 30 yrs
- 0.35%
- Est. flood insurance / yr
- $507 – $1,088
Fire risk 2/10 · Minimal
- Est. fire insurance / yr
- $947 – $1,759
Heat risk 10/10 · Severe
- Hot days now (above 106°F)
- 7 days/yr
- Hot days in 30 yrs
- 25 days/yr
Wind risk 10/10 · Severe
- Chance of severe wind over 30 yrs
- 99.0%
Air-quality risk 2/10 · Minimal
- Unhealthy air days now
- 1 days/yr
- Unhealthy air days in 30 yrs
- 1 days/yr
Risk factors via First Street. Map © Google.
Why this score? — see what drove the D+ grade
The composite is a weighted blend of 9 inputs, each scored 0–100. Each bar is that input's sub-score; the figure is the points it added to the 100-point composite (weight × sub-score).
- ARV discount +15.0/15.0
- Cash flow +11.9/30.0
- 1% rule +4.6/10.0
- Schools +3.7/10.0
- Rent growth +3.6/5.0
- DSCR +3.5/10.0
- Livability +2.5/5.0
- Condition / age +2.5/5.0
- Appreciation +0.0/10.0
$240,000
🖨 Deal sheet 📄 Offer letter ✓ Due diligence
Listing remarks
Opportunity awaits in this 3-bedroom, 2-bath home located in the heart of Port St. Lucie! Situated on a generously sized lot, this property offers a large backyard with plenty of room to create your own outdoor oasis, add a pool, or expand. This home is perfect for investors or buyers looking to customize and add value. While it does need some work, key components include an HVAC system (2014), water heater (2012), and a shingle roof (2005)—providing a solid starting point for renovations Conveniently located near major roadways including US-1 and the Florida Turnpike, making commuting a breeze. Enjoy close proximity to shopping, dining, and everyday conveniences, as well as just a sh
Key facts
- Large backyard
- Water heater
- Shingle roof
Tags
Property features AI
Finance
- Other: Property condition is resale
- Financial info: No investment/multifamily financial details listed
- HOA & community: No HOA information listed
Exterior
- Parking: 2 open parking spaces (total parking for 2 vehicles)
- Security: No security features listed
- Utilities: Public water available; Septic tank for sewer; Water service available
- Home design: Single family residence; One-story; Resale property; Faces east
- Construction: Frame and stucco construction; Shingle roof; Built as a single-story structure
- Exterior features: Not waterfront
Interior
- Kitchen: No kitchen appliance details provided
- Bedrooms: 2 bedrooms on the main level
- Flooring: Carpet; Ceramic tile
- Bathrooms: 2 full bathrooms
- Heating & cooling: Central heating; Central air conditioning
- Interior features: No additional interior features listed
- Laundry & utility: Laundry in garage
Neighborhood map
What this means for you Summary
Snapshot
- This is a 3-bed/2.0-bath single-family listed at $240k.
Deal economics
- At list price, monthly cash flow is $-61 ($-732/yr) — negative.
- To cash-flow at today's rent, offer at most $229k (4.5% below list).
- To meet the 1% rule (rent ≥ 1% of price), the offer needs to be $231k (3.8% below list).
- Recommended offer: $226k (6.0% below list) — sets the bar for market timing.
- Cap rate 6.0% vs local median 3.9% in Port St. Lucie — top-decile yield for the area; either an underpriced asset or a hidden risk that comps aren't pricing in. Stress-test before assuming the spread holds.
Location & tenants
- Location reads: area grade D — affects rentability + tenant quality, not the cash-flow math above.
- St. Lucie (urban): math 40% / reading 48% proficiency, ranked #51 of 73 in FL (top 70%) — families likely to look elsewhere, expect single-tenant / working-renter base with shorter leases.
- Market conditions: Rents rising fast (+4.5%/yr); 352 active listings in the ZIP; 15 comparable units currently listed for rent nearby; rentals at typical pace (median 23d on market — plan ~3-4 weeks tenant-placement turnaround); solid renter incomes; 4,868 units permitted in St. Lucie County in 2024 (268 in 5+ unit buildings).
- This rent runs 34% of the median local income ($81k/yr) — at the standard rent-burdened threshold; future hikes will face affordability resistance.
Forward outlook
- Local home prices are declining (-3.0%/yr); year-one equity from $2k of loan paydown is wiped out by about $7k of value loss. Plan a longer hold.
- St. Lucie County population projected at +20% by 2050 — long-run rental-demand tailwind backs the buy-and-hold thesis.
Negotiation context
- It's been on market 76 days — a 6% lower offer ($226k) is reasonable based on typical stale-listing flexibility.
- Current owner paid $63k; list at $240k implies a 282% gain — meaningful room to come down on a strong offer.
Risks & watch-outs
- Watch-outs: property tax is 2.6% of price.
- Climate carrying-cost: moderate flood risk; severe wind risk, 99% chance of damaging wind over 30y; extreme-heat days projected 7→25/yr by 2055 (HVAC capex compounding) — expect insurance premiums to compound above CPI over the hold.
Questions for the listing agent
- What do current leases actually rent for vs. the listed asking? Can we see a recent rent roll and the last 12 months of T-12 income?
- It's been on market 76 days. Have you received any prior offers? Is the seller open to a 6% concession, seller financing, or rate buy-down credit?
- Property tax is high relative to price — has the assessment been appealed recently, and will the sale trigger a re-assessment?
- Why hasn't it sold? Are there any deal-killer items the seller is aware of (foundation, flood, title, zoning, code violations)?
- Is there a deadline driving the sale (1031 exchange, divorce, estate, relocation)? That informs how much negotiation room exists.
- The area grade is low — what's the realistic commute time and amenity access for the typical tenant pool here? Any planned neighborhood developments (good or bad) we should know about?
- What's the average days-on-market for RENTAL listings here right now (not sales)? A rising rental-DOM trend means longer vacancies and softer asking-rent achievability than the comps imply.
- What's the recent tenant-quality profile in this submarket — average credit score on applications, eviction rate, late-payment / NSF rate, and stable-employment percentage? A property-management company in the area should have these aggregated.
- How much new for-sale + rental construction is in the pipeline within 1–3 miles? Heavy new supply typically softens prices + rents 12–24 months out; constrained supply supports both.
Investment metrics
- 1% rule
- 0.96% ✗
- Cap rate
- 5.99%
- Cash-on-cash
- -1.09%
- DSCR
- 0.95
- GRM
- 8.7
CMA / ARV
- ARV (on-the-fly)
- $302,016
- Comps found
- 5
Show comp detail 5 sales within ~0.75 mi
| Address | Dist | Beds/Ba | Sqft | Sold | Price | $/sf | Match |
|---|---|---|---|---|---|---|---|
| 2365 SE Aneci St | 0.39mi | 3/2.0 | 1,176 (+3%) | 13mo | $325,000 | $276 | 67 |
| 2142 SE Watercrest St | 0.61mi | 3/2.0 | 1,176 (+3%) | 2mo | $300,000 | $255 | 65 |
| 2252 SE Aneci St | 0.54mi | 3/2.0 | 1,176 (+3%) | 8mo | $280,000 | $238 | 64 |
| 2290 SE Glover St | 0.52mi | 2/2.0 (-1) | 1,176 (+3%) | 21mo | $310,000 | $264 | 48 |
| 2243 SE Haddon St | 0.61mi | 3/2.0 | 1,027 (-10%) | 22mo | $340,000 | $331 | 36 |
Match score weights: distance 35% · size 25% · config 20% · recency 20%. Top-matched comps best support the ARV.
Projected returns pro-forma
-3.0% appreciation · 4.54% rent growth · sell at horizon
- IRR
- -16.1%
- Equity multiple
- 0.42×
- Total profit
- $-38,968
- Equity at exit
- $35,785
- IRR
- -4.8%
- Equity multiple
- 0.66×
- Total profit
- $-22,840
- Equity at exit
- $20,751
Cash invested: $67,200 (down + closing). Projections, not guarantees.
Landlord ↔ Tenant lean methodology
- Overall (STATE)
- 87 Strongly Landlord-Friendly
- State Florida
- 87 Strongly Landlord-Friendly · R+3
- County
- — inherits STATE
- City
- — inherits STATE
ZIP-level market 34984
- Home prices YoY
- -24.5%
- Rents YoY
- 4.5%
- Active inventory
- 352
- Price-to-rent
- 8.7×
Monthly cashflow live
- Estimated rent
- $2,310 high interval (Pro) →
- Mortgage (P&I)
- −$1,259
- Tax from tax record
- −$527 /mo · $6,327/yr
- Insurance
- −$100
- HOA
- −$0
- Vacancy / Maint / Mgmt
- −$485
- Net cashflow
- $-61
Break-even live
UW: 25.0% down · 7.5% · 30yr · 1.5% tax · 5.0% vac · 8.0% maint · 8.0% mgmt
Financing live
Cash to close
- Down payment
- $60,000
- Closing costs
- $7,200
- Reserves months
- —
- Total cash needed
- —
Loan-product check · same deal, 3 products live
Conventional
25% down · 7.5% · 30yr
- Down + closing
- —
- Monthly P&I
- —
- Monthly cashflow
- —
- DSCR
- —
- Eligible?
- —
Personal DTI + credit; lowest rate.
DSCR
20% down · 8.5% · 30yr
- Down + closing
- —
- Monthly P&I
- —
- Monthly cashflow
- —
- DSCR
- —
- Eligible?
- —
No personal income docs; deal must DSCR.
Hard money
10% down · 12.0% · 12mo
- Down + closing
- —
- Monthly P&I
- —
- Monthly cashflow
- —
- DSCR
- —
- Eligible?
- —
Short-term bridge; refi at stabilization.
Rent comps 15 comps
| Address | Beds | Baths | Sqft | Rent | $/sqft | DOM | Units | Dist |
|---|---|---|---|---|---|---|---|---|
| 2249 SE Glover St Port Saint Lucie, FL | 3.0 | 2.0 | 1401 | $2,500 | $1.78 | 21d | 1 | 0.56mi |
| 2506 SE Anchorage Cv #2 Port St Lucie, FL | 2.0 | 2.0 | 1018 | $1,750 | $1.72 | 23d | 1 | 0.68mi |
| 2512 SE Anchorage Cv #2 Port St. Lucie, FL | 2.0 | 2.0 | 1018 | $1,850 | $1.82 | 23d | 1 | 0.69mi |
| 2500 SE Anchorage Cv Unit B2 Port Saint Lucie, FL | 2.0 | 2.0 | 1018 | $1,800 | $1.77 | 23d | 1 | 0.80mi |
| 431 SE Dalva Ave Port Saint Lucie, FL | 3.0 | 2.0 | 1176 | $2,150 | $1.83 | 23d | 1 | 0.81mi |
| 601 SE Polynesian Ave Port Saint Lucie, FL | 2.0 | 2.0 | 1143 | $2,000 | $1.75 | 13d | 1 | 1.09mi |
| 2174 SW Wayne St Port Saint Lucie, FL | 3.0 | 2.0 | 1463 | $2,370 | $1.62 | 23d | 1 | 1.27mi |
| 3100 SE Pruitt Rd Unit G207 Port Saint Lucie, FL | 2.0 | 2.0 | 1426 | $1,795 | $1.26 | 23d | 1 | 1.31mi |
| 1981 SE Shelter Dr Port Saint Lucie, FL | 3.0 | 2.0 | 1320 | $2,000 | $1.52 | 23d | 1 | 1.32mi |
| 233 SW Chapman Ave Port Saint Lucie, FL | 3.0 | 2.0 | 1467 | $1,250 | $0.85 | 21d | 1 | 1.36mi |
| 3110 SE Card Ter Port Saint Lucie, FL | 3.0 | 2.0 | 1253 | $2,450 | $1.96 | 13d | 1 | 1.37mi |
| 262 SW Crescent Ave Port Saint Lucie, FL | 3.0 | 2.0 | 1482 | $2,600 | $1.75 | 23d | 1 | 1.43mi |
| 3031 SE Galt Cir Port Saint Lucie, FL | 3.0 | 2.0 | 1266 | $2,800 | $2.21 | 13d | 1 | 1.44mi |
| 279 SW Glenwood Dr Port Saint Lucie, FL | 3.0 | 2.0 | 1393 | $2,975 | $2.14 | 23d | 1 | 1.48mi |
| 2342 SW Bayshore Blvd Port Saint Lucie, FL | 3.0 | 2.0 | 1176 | $2,300 | $1.96 | 23d | 1 | 1.50mi |
Listing history 21 events
-
2026-06-18days on market $240,000 Active 76 DOM
-
2026-06-17days on market $240,000 Active 75 DOM
-
2026-06-16statusdays on market $240,000 Active 74 DOM
-
2026-06-15days on market $240,000 Active Under Contract 73 DOM
-
2026-06-14days on market $240,000 Active Under Contract 71 DOM
-
2026-06-13days on market $240,000 Active Under Contract 70 DOM
-
2026-06-10days on market $240,000 Active Under Contract 68 DOM
-
2026-06-09days on market $240,000 Active Under Contract 67 DOM
-
2026-06-08days on market $240,000 Active Under Contract 66 DOM
-
2026-06-07days on market $240,000 Active Under Contract 65 DOM
-
2026-06-05days on market $240,000 Active Under Contract 62 DOM
-
2026-06-03days on market $240,000 Active Under Contract 61 DOM
-
2026-06-02days on market $240,000 Active Under Contract 60 DOM
-
2026-06-01days on market $240,000 Active Under Contract 59 DOM
-
2026-05-31days on market $240,000 Active Under Contract 58 DOM
-
2026-05-30days on market $240,000 Active Under Contract 57 DOM
-
2026-05-07historical Active Under Contract
-
2026-04-02$240,000 Active
-
2000-07-07soldstatus $62,900
-
1993-01-29soldstatus $55,000
-
1992-09-16soldstatus $39,500
ⓘ Source: listings_history table (triggers on properties + properties_extension) + one-shot
backfill from property_details.listing_events for pre-trigger history.
Tax reassessment forecast FL · Resets to sale price
- Current annual tax
- $6,327 · $527/mo
- Projected year-2 tax
- $6,327 · $527/mo
- Expected delta
- $0/yr ($0/mo · 0.0%)
ⓘ Screening estimate from a state-policy table — verify with the county assessor before closing.
Climate risk First Street
- Flood 5/10 Major FEMA zone X (shaded) · 35% chance over 30 yrs
- Wildfire 2/10 Low
- Heat 10/10 Extreme 7 d/yr ≥106°F today · 25 d/yr by 30 yrs out
- Wind 10/10 Extreme 99% chance of damaging wind over 30 yrs
- Air quality 2/10 Low 1 unhealthy d/yr today · 1 by 30 yrs out
Nearby sold comps map
Loading sold comps map…
Walkable amenities ~0.75 mi
Loading nearby amenities…
Taxation est. · year 1
- Rental income
- $27,719
- − Mortgage interest
- −$13,444
- − Property taxes
- −$6,327
- − Insurance
- −$1,200
- − Repairs & maintenance
- −$2,218
- − Management
- −$2,218
- − Depreciation
- −$6,982
- Taxable loss
- −$4,669
- Est. tax savings @ 24.0%
- +$1,121
- After-tax cash flow
- $388/yr
For passive investors: Depreciation is non-cash, so a rental often shows a tax loss while cash-flowing — sheltering income. Rental losses are passive: they offset passive income freely, and up to $25,000/yr can offset ordinary (W-2) income if you actively participate and your MAGI is under $100k (phasing out to $0 by $150k); unused losses carry forward. On sale, claimed depreciation is recaptured at up to 25%, and gains may owe capital-gains tax (a 1031 exchange can defer both). Figures are a year-1 estimate at your 24.0% rate — not tax advice; consult a CPA.
Schools (NCES district)
- District
- St. Lucie
- NCES district ID
- 1201770
- Math proficiency
- 40% ▼ -11.00%
- Reading proficiency
- 48% ▼ -4.00%
- Median HH income
- $44,737
- Composite
- 37.28/100
- National rank
- #4449
- State rank
- #51 of 73 in FL
Livability — Port St. Lucie
No livability data for this city. (Only ~50 U.S. cities are tracked.)
Census & demographics
- Census place
- Port St. Lucie, FL
- County
- Saint Lucie County · 337,150 people
- City population
- 221,051
- Metro
- Port St. Lucie, FL
- Population (ZIP)
- 20,151
- Household income
- $80,725
- Rent vs Own
- Severe rent burden
- 266.0
Population outlook (St. Lucie County) Hauer SSP2
- Today (2025)
- 338,016 people
- By 2030
- 355,687 · +5.2%
- By 2040
- 385,521 · +14.1%
- By 2050
- 406,106 · +20.1%
- By 2075
- 441,054 · +30.5%
- By 2100
- 436,885 · +29.2%
Race, ethnicity, and origin ACS 2023
- Neighborhood character
- Diverse neighborhood (Simpson 0.62)
- Race & ethnicity
- White 55% Black 20% Hispanic / Latino 18% Two or more races 8% Asian 2%
- Hispanic origin (detail)
- Mexican 1% Puerto Rican 8% Cuban 3%
- Common ancestry
- Hispanic 2% Romanian 1% Scotch-Irish 1%
- Foreign-born
- 15% · Canada, Jamaica, China
- Languages at home
- 77% English-only · Spanish 15% French/Haitian/Cajun 5% Other Indo-European 1%
Political lean MEDSL · St. Lucie
- 2024 margin
- Lean R (+9.1) · D 45.1% · R 54.2%
- 2008→2024 swing
- -21.2pp toward R · 2008: 12.1pp · 2024: -9.1pp
- All cycles
- 2024: R+9.1 2020: R+1.6 2016: R+2.5 2012: D+7.9 2008: D+12.1
Not yet ingested
- Civics
- —
Market trends
- HPI YoY
- ▼ -121.06%
- Current HPI
- 373.9523
- Rent YoY
- ▲ 4.54%
- Metro
- Port St. Lucie, FL
- State GDP YoY
- ▲ 3.28%
- F500 in state
- 36
Industry mix (Fortune 500 HQ in FL)
| Industry | F500 HQs | Revenue |
|---|---|---|
| Industrial Technology | 2 | $29B |
|
||
| Insurance | 2 | $17B |
|
||
| Retail | 1 | $60B |
|
||
| Technology Distribution | 1 | $58B |
|
||
| Homebuilding | 1 | $35B |
|
||
| Technology Manufacturing | 1 | $35B |
|
||
Price history
+507.6% since first listed5 events — show timeline
- 2026-05-07 Contingent — Beaches MLS
- 2026-04-02 Listed $240,000 Beaches MLS
- 2000-07-07 Sold (Public Records) $62,900 Public Records
- 1993-01-29 Sold (Public Records) $55,000 Public Records
- 1992-09-16 Sold (Public Records) $39,500 Public Records
Property tax history
+18.7%/yrLatest (2025): $6,327 · -1.0% YoY. Source: county tax records.
Cash-flow waterfall
monthlySold comps — $/sqft
last 12 mo · ≤1 miLoading sold comps…