 🏗️ New Construction
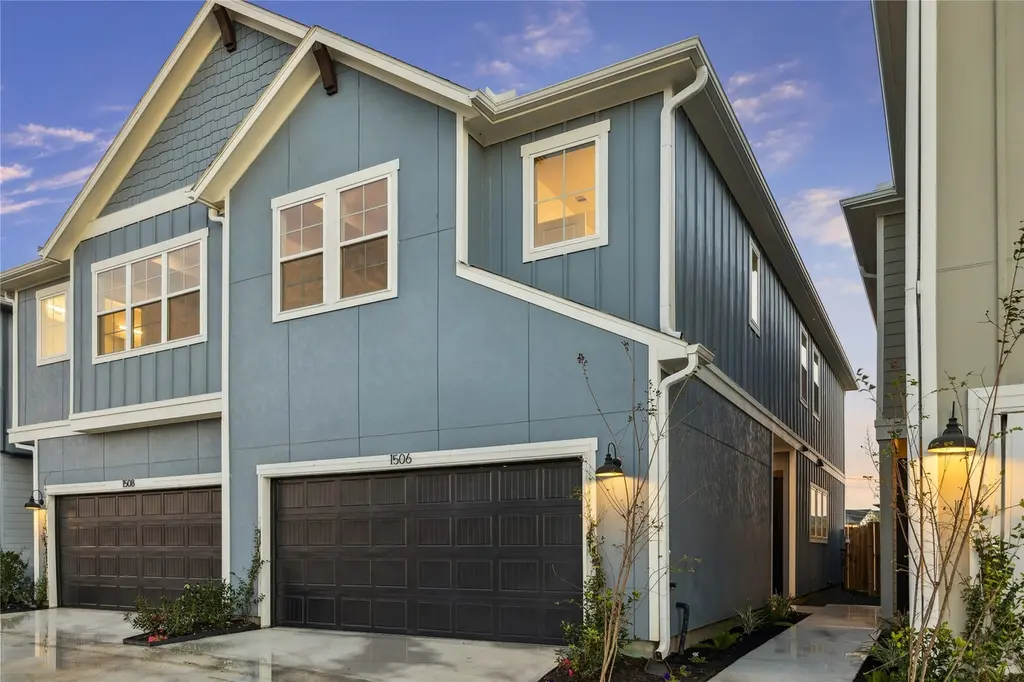
1516 Colonial Gorge Dr · Houston, TX
Flood risk No data
- FEMA flood zone
- —
- Chance of flooding over 30 yrs
- —
- Est. flood insurance / yr
- —
Fire risk No data
- Est. fire insurance / yr
- —
Heat risk No data
- Hot days now (above threshold)
- —
- Hot days in 30 yrs
- —
Wind risk No data
- Chance of severe wind over 30 yrs
- —
Air-quality risk No data
- Unhealthy air days now
- —
- Unhealthy air days in 30 yrs
- —
Risk factors via First Street. Map © Google.
Why this score? — see what drove the F grade
The composite is a weighted blend of 9 inputs, each scored 0–100. Each bar is that input's sub-score; the figure is the points it added to the 100-point composite (weight × sub-score).
- Cash flow +8.6/30.0
- ARV discount +7.5/15.0
- Schools +5.7/10.0
- Livability +3.7/5.0
- Condition / age +2.5/5.0
- DSCR +2.4/10.0
- Rent growth +2.3/5.0
- 1% rule +2.0/10.0
- Appreciation +0.0/10.0
$327,900
🖨 Deal sheet (PDF) 📄 Offer letter ✓ Due diligence
Listing remarks
This 4-bedroom home offers the perfect blend of comfort and convenience within a gated community. Designed with desirable first-floor living, the home provides a functional layout ideal for both everyday living and easy entertaining. The primary suite features a generous walk-in closet and a well-appointed bath complete with dual vanities, a floating tub, and a separate shower. Enjoy quick access to I-10 and Highway 99, along with close proximity to the new Katy Asiatown, Memorial Hermann Katy Hospital, and many of the area’s popular shopping, dining, and entertainment destinations. Set in one of Katy’s growing areas, this home offers accessibility, comfort, and an exceptional l
Key facts
- Gated community
- Dual vanities
- Walk-in closet
Tags
Property features AI
Finance
- HOA & community: Managed by Beacon Residential Management; Gated community; Annual association fee (amount provided to listing): covers common areas, recreation facilities, water, and sewer
Exterior
- Parking: Attached garage with 2 spaces
- Security: Prewired for security; Owned security system; Smoke detectors
- Utilities: Public water; Public sewer
- Home design: Residential property; New construction (2026); Two-story home; Full ownership; Slab foundation; Cement and wood siding
- Construction: Built in 2026; Cement siding and wood siding; Slab foundation; Composition roof
- Exterior features: Prewired security; Owned security system; Smoke detectors; Composition roof
Interior
- Kitchen: Dishwasher; Gas cooktop; Gas oven; Microwave; Garbage disposal
- Bedrooms: 5 total rooms (includes bedrooms and other living spaces)
- Flooring: Carpet; Engineered hardwood; Tile
- Bathrooms: 2 full bathrooms; 1 half bathroom
- Heating & cooling: Central gas heating; Central electric air conditioning; HVAC system included
- Interior features: Breakfast bar; Double vanity; Kitchen island; Primary bathroom with bath; Pantry; Quartz countertops; Soaking tub; Separate shower; Tub/shower combination; Vanity; Ceiling fans; Programmable thermostat; Low emissivity windows; Ventilation for improved indoor air quality
Neighborhood map
What this means for you Summary
Snapshot
- This is a 3-bed/2.5-bath townhouse listed at $328k.
Deal economics
- At list price, monthly cash flow is $-293 ($-4k/yr) — negative.
- To cash-flow at today's rent, offer at most $292k (10.9% below list).
- To meet the 1% rule (rent ≥ 1% of price), the offer needs to be $240k (26.7% below list).
- Recommended offer: $240k (26.7% below list) — sets the bar for 1% rule.
- Cap rate 5.3% vs local median 3.2% in Houston — top-decile yield for the area; either an underpriced asset or a hidden risk that comps aren't pricing in. Stress-test before assuming the spread holds.
Location & tenants
- Location reads 74/100 on livability (#184 in TX, #4,771 nationally) — a middle-class / working-renter tenant base. Strengths: amenities A+, cost of living A+, housing A+; Watch: crime F.
- Katy ISD (suburban): math 61% / reading 63% proficiency, ranked #29 of 826 in TX (top 4%) — acceptable for families but not a draw, mixed tenant base, ~2y average lease.
- Zoned schools: Robert King El (math 41% / reading 44%, grade F, #1,313 of 4,322 statewide, top 31%, 981 students, 68% FRL); Katy J H (math 52% / reading 51%, grade C, #318 of 1,662 statewide, top 20%, 1,094 students, 53% FRL); Katy H S (math 62% / reading 74%, grade B, #150 of 1,632 statewide, top 10%, 3,330 students, 38% FRL) — zoned schools average 53% FRL vs 27% district-wide (25 pts higher); higher-poverty schools than district average — tighter screening recommended.
- Market conditions: Rents soft (-0.8%/yr); 2742 active listings in the ZIP; 39 comparable units currently listed for rent nearby; rentals leasing fast (median 4d on market — plan ~1-2 weeks tenant-placement turnaround); high-income renter base; 29,883 units permitted in Harris County in 2024 (8,621 in 5+ unit buildings).
Forward outlook
- Local home prices are declining (-3.0%/yr); year-one equity from $2k of loan paydown is wiped out by about $10k of value loss. Plan a longer hold.
- Harris County population projected at +47% by 2050 — long-run rental-demand tailwind backs the buy-and-hold thesis.
Negotiation context
- Only 11 days on market — expect competitive offers; lowballing is unlikely to land.
- 2 sale attempts with the ask held roughly flat each time — persistent listings suggest the price (not the market) is what's stuck; bring a comps-based counter.
Questions for the listing agent
- What do current leases actually rent for vs. the listed asking? Can we see a recent rent roll and the last 12 months of T-12 income?
- What does the HOA fee cover, when was the last increase, and are there any pending special assessments or reserve-fund shortfalls?
- Is there a deadline driving the sale (1031 exchange, divorce, estate, relocation)? That informs how much negotiation room exists.
- Schools are D-rated, which usually means shorter tenancies and higher turnover. Who's the typical renter profile here, and what's been the actual vacancy rate?
- Crime grade is F in this area — have there been break-ins, vandalism, or insurance claims at this property in the last 3 years? What carrier currently insures it and at what premium?
- The area grade is low — what's the realistic commute time and amenity access for the typical tenant pool here? Any planned neighborhood developments (good or bad) we should know about?
- What's the average days-on-market for RENTAL listings here right now (not sales)? A rising rental-DOM trend means longer vacancies and softer asking-rent achievability than the comps imply.
- What's the recent tenant-quality profile in this submarket — average credit score on applications, eviction rate, late-payment / NSF rate, and stable-employment percentage? A property-management company in the area should have these aggregated.
- How much new for-sale + rental construction is in the pipeline within 1–3 miles? Heavy new supply typically softens prices + rents 12–24 months out; constrained supply supports both.
Investment metrics
- 1% rule
- 0.70% ✗
- Cap rate
- 5.27%
- Cash-on-cash
- -3.66%
- DSCR
- 0.84
- GRM
- 11.9
CMA / ARV
- ARV (on-the-fly)
- $343,911
- Comps found
- 2
Show comp detail 2 sales within ~0.75 mi
| Address | Dist | Beds/Ba | Sqft | Sold | Price | $/sf | Match |
|---|---|---|---|---|---|---|---|
| 1514 Colonial Gorge Dr | 0.00mi | 4/2.5 (+1) | 1,925 (-1%) | 0mo | $324,900 | $169 | 93 |
| 24404 Colonial Mound Dr | 0.05mi | 3/2.5 | 1,809 (-7%) | 0mo | $319,900 | $177 | 86 |
Match score weights: distance 35% · size 25% · config 20% · recency 20%. Top-matched comps best support the ARV.
Projected returns pro-forma
-3.0% appreciation · 0.0% rent growth · sell at horizon
- IRR
- -25.6%
- Equity multiple
- 0.15×
- Total profit
- $-81,537
- Equity at exit
- $51,278
- IRR
- -33.7%
- Equity multiple
- -0.27×
- Total profit
- $-122,593
- Equity at exit
- $29,735
Cash invested: $96,295 (down + closing). Projections, not guarantees.
Landlord ↔ Tenant lean methodology
- Overall (STATE)
- 87 Strongly Landlord-Friendly
- State Texas
- 87 Strongly Landlord-Friendly · R+5
- County
- — inherits STATE
- City
- — inherits STATE
ZIP-level market 77493
- Rents YoY
- -0.8%
- Active inventory
- 2742
- Price-to-rent
- 11.4×
Monthly cashflow live
- Estimated rent
- $2,403 high interval (Pro) →
- Mortgage (P&I)
- −$1,804
- Tax from tax record
- −$162 /mo · $1,940/yr
- Insurance
- −$143
- HOA
- −$83
- Lot rent
- −$0
- Vacancy / Maint / Mgmt
- −$505
- Net cashflow
- $-293
Break-even live
Sensitivity live
| Price | -10% $-99 | -5% $-196 | +0% $-293 | +5% $-391 | +10% $-488 |
|---|---|---|---|---|---|
| Rent | -10% $-483 | -5% $-388 | +0% $-293 | +5% $-199 | +10% $-104 |
| Rate | -1.0pp $-120 | -0.5pp $-206 | base $-293 | +0.5pp $-383 | +1.0pp $-473 |
UW: 25.0% down · 7.5% · 30yr · 1.5% tax · 5.0% vac · 8.0% maint · 8.0% mgmt
Financing live
Cash to close
- Down payment
- $85,978
- Closing costs
- $10,317
- Reserves months
- —
- Total cash needed
- —
Loan-product check · same deal, 3 products live
Conventional
25% down · 7.5% · 30yr
- Down + closing
- —
- Monthly P&I
- —
- Monthly cashflow
- —
- DSCR
- —
- Eligible?
- —
Personal DTI + credit; lowest rate.
DSCR
20% down · 8.5% · 30yr
- Down + closing
- —
- Monthly P&I
- —
- Monthly cashflow
- —
- DSCR
- —
- Eligible?
- —
No personal income docs; deal must DSCR.
Hard money
10% down · 12.0% · 12mo
- Down + closing
- —
- Monthly P&I
- —
- Monthly cashflow
- —
- DSCR
- —
- Eligible?
- —
Short-term bridge; refi at stabilization.
Rent comps 39 comps
| Address | Beds | Baths | Sqft | Rent | $/sqft | DOM | Units | Dist |
|---|---|---|---|---|---|---|---|---|
| 1508 Colonial Gorge Dr Katy, TX | 4.0 | 2.5 | 1904 | $2,650 | $1.39 | 19d | 1 | 0.04mi |
| 1330 W Park Green Dr Katy, TX | 1.0–3.0 | 1.0–2.0 | 1058 | $2,297 | $2.17 | 1d | 15 | 0.15mi |
| 1330 W Park Green Dr Katy, TX | 1.0–3.0 | 1.0–2.0 | 1058 | $2,222 | $2.10 | 46d | 16 | 0.15mi |
| 1330 Park West Green Dr Unit 1363 Katy, TX | 3.0 | 2.0 | 1451 | $2,212 | $1.52 | 17d | 1 | 0.17mi |
| 24002 Colonial Pkwy Katy, TX | 1.0–3.0 | 1.0–2.0 | 1072 | $2,262 | $2.11 | 0d | 31 | 0.18mi |
| 1700 Katy Fort Bend Rd Katy, TX | 1.0–3.0 | 1.0–2.0 | 1094 | $2,415 | $2.21 | 4d | 33 | 0.61mi |
| 24414 Leachwood Dr Katy, TX | 4.0 | 2.0 | 1701 | $2,195 | $1.29 | 21d | 1 | 0.65mi |
| 24151 Bella Dolce Ln Unit 3174 Katy, TX | 3.0 | 2.0 | 1509 | $2,254 | $1.49 | 12d | 1 | 0.72mi |
| 24151 Bella Dolce Ln Unit 1 Katy, TX | 3.0 | 2.5 | 1509 | $2,313 | $1.53 | 46d | 1 | 0.72mi |
| 24151 Bella Dolce Ln Unit 3112 Katy, TX | 3.0 | 2.0 | 1509 | $2,214 | $1.47 | 1d | 1 | 0.72mi |
| 24151 Bella Dolce Ln Unit 24184 Katy, TX | 3.0 | 2.0 | 1509 | $2,496 | $1.65 | 46d | 1 | 0.72mi |
| 24929 Katy Ranch Rd Katy, TX | 1.0–3.0 | 1.0–2.0 | 1096 | $1,767 | $1.61 | 0d | 23 | 0.73mi |
| 24117 Bella Dolce Ln Katy, TX | 2.0 | 1.0–2.0 | 896 | $2,010 | $2.24 | 1d | 27 | 0.74mi |
| 24982 Katy Ranch Rd Unit 24982 Katy, TX | 3.0 | 2.0 | 1378 | $2,124 | $1.54 | 46d | 1 | 0.76mi |
| 2031 Wigmaker Dr Katy, TX | 3.0 | 2.0 | 1430 | $1,800 | $1.26 | 7d | 1 | 0.81mi |
| 24949 Katy Ranch Rd Unit 3174 Katy, TX | 3.0 | 2.0 | 1378 | $2,124 | $1.54 | 1d | 1 | 0.82mi |
| 24949 Katy Ranch Rd Unit 3187 Katy, TX | 3.0 | 2.0 | 1378 | $2,073 | $1.50 | 1d | 1 | 0.82mi |
| 150 Cobia Dr Unit 3187 Katy, TX | 3.0 | 2.0 | 1454 | $1,954 | $1.34 | 1d | 1 | 0.84mi |
| 150 Cobia Dr Unit 3174 Katy, TX | 3.0 | 2.0 | 1454 | $1,994 | $1.37 | 12d | 1 | 0.84mi |
| 150 Cobia Dr Unit 183 Katy, TX | 3.0 | 2.0 | 1454 | $2,005 | $1.38 | 46d | 1 | 0.84mi |
| 24949 Katy Ranch Rd Katy, TX | 3.0 | 2.0 | 1378 | $2,275 | $1.65 | 46d | 1 | 0.85mi |
| 2150 Katy Fort Bend Rd Unit 3174 Katy, TX | 3.0 | 2.0 | 1272 | $1,848 | $1.45 | 1d | 1 | 1.00mi |
| 2150 Katy Fort Bend Rd Unit 2183 Katy, TX | 3.0 | 2.0 | 1272 | $1,821 | $1.43 | 46d | 1 | 1.00mi |
| 24758 Grand Harbor Dr Unit 24791 Katy, TX | 3.0 | 2.0 | 1437 | $2,114 | $1.47 | 46d | 1 | 1.01mi |
| 24758 Grand Harbor Dr Unit 3174 Katy, TX | 3.0 | 2.0 | 1437 | $2,063 | $1.44 | 1d | 1 | 1.01mi |
| 24758 Grand Harbor Dr Unit 3047 Katy, TX | 3.0 | 2.0 | 1437 | $2,114 | $1.47 | 13d | 1 | 1.02mi |
| 302 Cobia Dr Katy, TX | 1.0–3.0 | 1.0–2.5 | 1217 | $2,469 | $2.03 | 0d | 22 | 1.03mi |
| 23615 Western Centre Dr Katy, TX | 1.0–3.0 | 1.0–2.0 | 1051 | $2,230 | $2.12 | 0d | 31 | 1.05mi |
| 24764 Grand Harbor Dr Katy, TX | 3.0 | 2.0 | 1340 | $1,909 | $1.42 | 46d | 1 | 1.09mi |
| 24757 Grand Harbor Dr Katy, TX | 1.0–3.0 | 1.0–2.0 | 1009 | $1,889 | $1.87 | 5d | 22 | 1.11mi |
| 1724 Partnership Way Katy, TX | 3.0 | 1.0–3.5 | 1536 | $3,340 | $2.17 | 0d | 86 | 1.12mi |
| 23414 W Fernhurst Dr Katy, TX | 1.0–3.0 | 1.0–3.0 | 1352 | $3,099 | $2.29 | 1d | 30 | 1.12mi |
| 1002 Katy Gap Rd Katy, TX | 1.0–3.0 | 1.0–2.0 | 996 | $2,104 | $2.11 | 0d | 112 | 1.13mi |
| 1616 Partnership Way Katy, TX | 3.0 | 1.0–3.0 | 1283 | $2,940 | $2.29 | 1d | 49 | 1.17mi |
| 10 Cobia Dr Katy, TX | 3.0 | 2.0 | 1454 | $2,275 | $1.56 | 46d | 1 | 1.24mi |
| 1646 Chilton Ln Katy, TX | 3.0 | 2.0 | 1442 | $2,000 | $1.39 | 7d | 1 | 1.25mi |
| 23400 Kingsland Blvd Katy, TX | 1.0–3.0 | 1.0–2.0 | 1062 | $2,314 | $2.18 | 1d | 22 | 1.39mi |
| 23615 Kingsland Blvd Katy, TX | 1.0–2.0 | 1.0–2.0 | 979 | $2,349 | $2.40 | 1d | 12 | 1.47mi |
| 125 Prairie Ln Katy, TX | 3.0 | 1.0–3.0 | 1292 | $3,125 | $2.42 | 1d | 200 | 1.49mi |
HOA detail
- Monthly dues
- $83 · $996/yr
- Likely covers
- security
Listing history 20 events
-
2026-06-22days on market $327,900 Active 11 DOM
-
2026-06-21days on market $327,900 Active 10 DOM
-
2026-06-18days on market $327,900 Active 7 DOM
-
2026-06-17days on market $327,900 Active 6 DOM
-
2026-06-16days on market $327,900 Active 5 DOM
-
2026-06-15days on market $327,900 Active 4 DOM
-
2026-06-13days on market $327,900 Active 2 DOM
-
2026-06-09days on market $327,900 Active 12 DOM
-
2026-06-08days on market $327,900 Active 11 DOM
-
2026-06-07days on market $327,900 Active 10 DOM
-
2026-06-04days on market $327,900 Active 7 DOM
-
2026-06-03days on market $327,900 Active 6 DOM
-
2026-06-02days on market $327,900 Active 5 DOM
-
2026-06-01days on market $327,900 Active 4 DOM
-
2026-05-31days on market $327,900 Active 3 DOM
-
2026-05-28$327,900 Active
-
2025-10-14historical
-
2025-06-24status Pending
-
2025-04-25status Pending
-
2025-04-23$349,700 Active
ⓘ Source: listings_history table (triggers on properties + properties_extension) + one-shot
backfill from property_details.listing_events for pre-trigger history.
Tax reassessment forecast TX · Resets to sale price
- Current annual tax
- $1,940 · $162/mo
- Projected year-2 tax
- $6,001 · $500/mo
- Expected delta
- +$4,060/yr (+$338/mo · 209.3%)
ⓘ Screening estimate from a state-policy table — verify with the county assessor before closing.
Nearby sold comps map
Loading sold comps map…
Walkable amenities ~0.75 mi
Loading nearby amenities…
Taxation est. · year 1
- Rental income
- $28,831
- − Mortgage interest
- −$19,264
- − Property taxes
- −$1,940
- − Insurance
- −$1,720
- − Repairs & maintenance
- −$2,306
- − Management
- −$2,306
- − HOA
- −$996
- − Depreciation
- −$10,005
- Taxable loss
- −$9,707
- Est. tax savings @ 24.0%
- +$2,330
- After-tax cash flow
- $-1,192/yr
For passive investors: Depreciation is non-cash, so a rental often shows a tax loss while cash-flowing — sheltering income. Rental losses are passive: they offset passive income freely, and up to $25,000/yr can offset ordinary (W-2) income if you actively participate and your MAGI is under $100k (phasing out to $0 by $150k); unused losses carry forward. On sale, claimed depreciation is recaptured at up to 25%, and gains may owe capital-gains tax (a 1031 exchange can defer both). Figures are a year-1 estimate at your 24.0% rate — not tax advice; consult a CPA.
Schools (NCES district)
- District
- Katy ISD
- NCES district ID
- 4825170
- Math proficiency
- 61% ▼ -7.00%
- Reading proficiency
- 63% ▼ -3.00%
- Median HH income
- $90,312
- Composite
- 56.59/100
- National rank
- #1146
- State rank
- #29 of 826 in TX
Livability — Houston
- Score
- 74/100
- State rank
- #184
- US rank
- #4771
Category grades
Schools grade is shown separately in the Schools card above.
Census & demographics
- County
- Harris County · 4,702,590 people
- City population
- 3,226,434
- Metro
- Houston-The Woodlands-Sugar Land, TX
- Population (ZIP)
- 71,484
- Household income
- $118,464
- Rent vs Own
- Severe rent burden
- 913.0
Population outlook (Harris County) Hauer SSP2
- Today (2025)
- 5,571,493 people
- By 2030
- 6,089,821 · +9.3%
- By 2040
- 7,142,806 · +28.2%
- By 2050
- 8,185,864 · +46.9%
- By 2075
- 10,574,329 · +89.8%
- By 2100
- 12,109,958 · +117.4%
Race, ethnicity, and origin ACS 2023
- Neighborhood character
- Highly diverse neighborhood (Simpson 0.73)
- Race & ethnicity
- White 36% Hispanic / Latino 33% Two or more races 16% Black 15% Asian 12%
- Hispanic origin (detail)
- Mexican 20%
- Common ancestry
- Lithuanian 2% Slovak 1% Italian 1%
- Foreign-born
- 21% · Canada, Vietnam, Jamaica
- Languages at home
- 64% English-only · Spanish 22% Vietnamese 5% French/Haitian/Cajun 4%
Political lean MEDSL · Harris
- 2024 margin
- Lean D (+5.5) · D 52.0% · R 46.4% · Other 1.6%
- 2008→2024 swing
- +3.9pp toward D · 2008: 1.6pp · 2024: 5.5pp
- All cycles
- 2024: D+5.5 2020: D+13.3 2016: D+12.4 2012: D+0.1 2008: D+1.6
Not yet ingested
- Civics
- —
Market trends
- HPI YoY
- ▼ -140.65%
- Current HPI
- 233.1683
- Rent YoY
- ▼ -0.80%
- Metro
- Houston-The Woodlands-Sugar Land, TX
- State GDP YoY
- ▲ 3.95%
- F500 in state
- 110
Industry mix (Fortune 500 HQ in TX)
| Industry | F500 HQs | Revenue |
|---|---|---|
| Energy | 16 | $1,198B |
|
||
| Technology | 5 | $198B |
|
||
| Engineering / Construction | 4 | $72B |
|
||
| Energy Services | 3 | $60B |
|
||
| Utilities | 3 | $41B |
|
||
| Healthcare | 2 | $330B |
|
||
Price history
-6.2% since first listed5 events — show timeline
- 2026-05-28 Listed $327,900 HARMLS
- 2025-10-14 Listing Removed — HARMLS
- 2025-06-24 Pending — HARMLS
- 2025-04-25 Pending — HARMLS
- 2025-04-23 Listed $349,700 HARMLS
Cash-flow waterfall
monthlySold comps — $/sqft
last 12 mo · ≤1 miLoading sold comps…