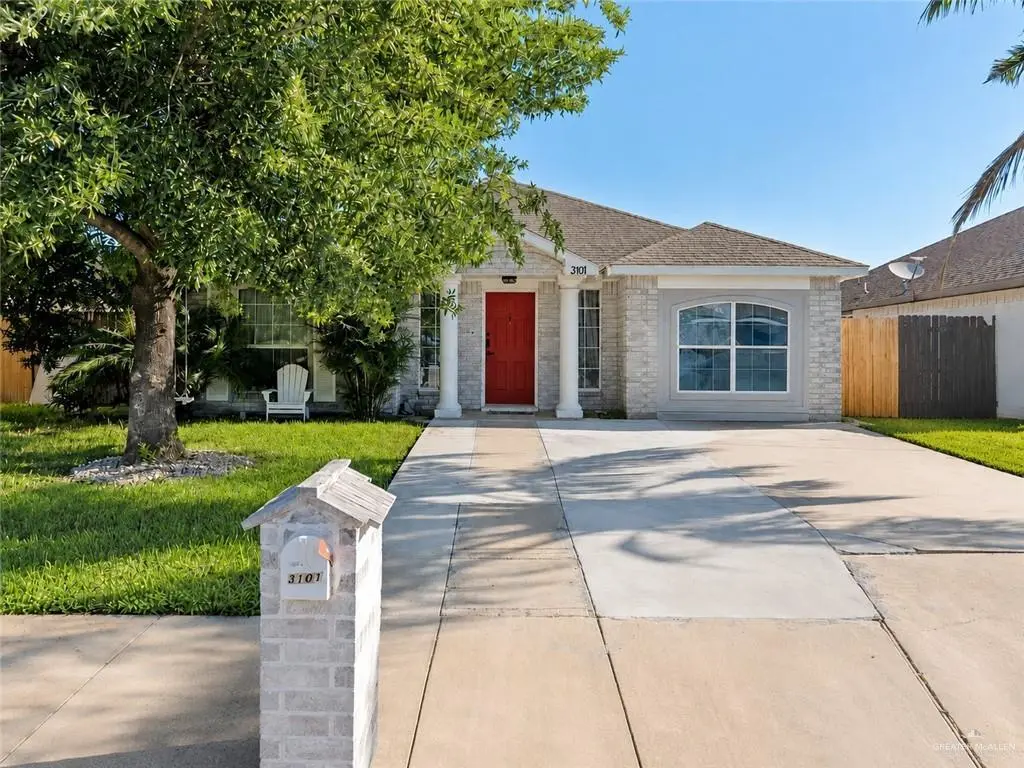
3101 E Camelia Ave · Hidalgo, TX
Flood risk 1/10 · Minimal
- FEMA flood zone
- X (shaded)
- Chance of flooding over 30 yrs
- 0.0%
- Est. flood insurance / yr
- $507 – $1,088
Fire risk 5/10 · Moderate
- Est. fire insurance / yr
- $1,222 – $2,270
Heat risk 9/10 · Severe
- Hot days now (above 111°F)
- 7 days/yr
- Hot days in 30 yrs
- 23 days/yr
Wind risk 8/10 · Major
- Chance of severe wind over 30 yrs
- 96.0%
Air-quality risk 1/10 · Minimal
- Unhealthy air days now
- 0 days/yr
- Unhealthy air days in 30 yrs
- 0 days/yr
Risk factors via First Street. Map © Google.
Why this score? — see what drove the D+ grade
The composite is a weighted blend of 9 inputs, each scored 0–100. Each bar is that input's sub-score; the figure is the points it added to the 100-point composite (weight × sub-score).
- Cash flow +11.7/30.0
- Appreciation +10.0/10.0
- ARV discount +9.3/15.0
- 1% rule +4.0/10.0
- DSCR +3.4/10.0
- Livability +3.4/5.0
- Rent growth +2.5/5.0
- Schools +2.5/10.0
- Condition / age +2.5/5.0
$190,000
🖨 Deal sheet 📄 Offer letter ✓ Due diligence
Listing remarks
Welcome to this beautifully maintained 4-bedroom, 2-bath home located in the heart of Hidalgo! Move-in ready and designed with comfort and style in mind, this home features an inviting open-concept layout with granite countertops throughout and custom kitchen cabinetry that offers both elegance and functionality. The spacious primary suite includes a double vanity sink, a large walk-in closet, and plenty of room to unwind. A dedicated laundry area adds convenience to everyday living. Step outside to enjoy the large backyard, perfect for entertaining, gatherings, or creating your dream outdoor space. The stunning brick exterior and beautiful landscaping provide exceptional curb appeal and ma
Key facts
- Brick exterior
- Large backyard
- Granite countertops
Tags
Property features AI
Finance
- Other: Lot approximately 0.1377 acres (50 x 120); Wood fencing
- HOA & community: No homeowners association; Community sidewalks
Exterior
- Parking: No garage
- Security: Smoke detectors; Carbon monoxide detectors
- Utilities: Public water; City sewer; Internet access; Paved road access
- Home design: Not new construction
- Construction: Brick construction; Shingle roof; Slab foundation; Built area approximately 1,776
- Exterior features: Sprinkler system; Sidewalks; Storage structure
Interior
- Kitchen: Microwave; Refrigerator; Stove/Range
- Bedrooms: Master bedroom with walk-in closet(s)
- Flooring: Tile flooring
- Bathrooms: 2 full bathrooms
- Heating & cooling: Central heating; Central air conditioning; Attic fans; Thermostat
- Interior features: Granite countertops; Bonus room; Built-in features; Ceiling fans; Fireplace; Split bedroom floor plan; Window coverings (other)
- Laundry & utility: Laundry area with washer/dryer connections; Washer included; Dryer included; Electric water heater; Tankless water heater
Neighborhood map
What this means for you Summary
Snapshot
- This is a 3-bed/2.0-bath single-family listed at $190k.
Deal economics
- At list price, monthly cash flow is $-56 ($-675/yr) — negative.
- To cash-flow at today's rent, offer at most $180k (5.2% below list).
- To meet the 1% rule (rent ≥ 1% of price), the offer needs to be $170k (10.5% below list).
- Recommended offer: $170k (10.5% below list) — sets the bar for 1% rule.
- Cap rate 5.9% vs local median 4.2% in Hidalgo — top-decile yield for the area; either an underpriced asset or a hidden risk that comps aren't pricing in. Stress-test before assuming the spread holds.
Location & tenants
- Location reads 68/100 on livability (#488 in TX) — a middle-class / working-renter tenant base. Strengths: cost of living A+, housing A+, crime A-; Watch: amenities F, commute F, employment F.
- Valley View ISD (suburban): math 24% / reading 38% proficiency, ranked #631 of 826 in TX (top 76%) — families likely to look elsewhere, expect single-tenant / working-renter base with shorter leases; 85% free/reduced lunch — lower-income household profile, screen leases tightly.
- Zoned schools: Valley View South El (math 50% / reading 70%, grade B-, #409 of 4,322 statewide, top 10%, 341 students, 97% FRL); Valley View J H (math 23% / reading 35%, grade F, #1,103 of 1,662 statewide, top 67%, 483 students, 95% FRL); Valley View H S (math 12% / reading 47%, grade F, #1,112 of 1,632 statewide, top 70%, 1,170 students, 96% FRL).
- Market conditions: 98 active listings in the ZIP; 5 comparable units currently listed for rent nearby; rentals at typical pace (median 23d on market — plan ~3-4 weeks tenant-placement turnaround); 7,378 units permitted in Hidalgo County in 2024 (641 in 5+ unit buildings).
Forward outlook
- In year one you build about $20k of equity ($1k loan paydown + $19k appreciation (10.0% local appreciation)).
- Hidalgo County population projected at +28% by 2050 — long-run rental-demand tailwind backs the buy-and-hold thesis.
- At projected returns (10.0% appreciation + 3.0% rent growth), your $53k cash investment doubles in ~3 years — after that, you're playing with house money.
- By year 2, paydown + projected appreciation supports a ~$33k cash-out refi (75% LTV) — recoverable capital for the next deal without selling this one.
Negotiation context
- It's been on market 34 days — a 3% lower offer ($184k) is reasonable based on typical stale-listing flexibility.
Risks & watch-outs
- Climate carrying-cost: severe wind risk, 96% chance of damaging wind over 30y; moderate wildfire risk; extreme-heat days projected 7→23/yr by 2055 (HVAC capex compounding) — expect insurance premiums to compound above CPI over the hold.
Questions for the listing agent
- What do current leases actually rent for vs. the listed asking? Can we see a recent rent roll and the last 12 months of T-12 income?
- It's been on market 34 days. Have you received any prior offers? Is the seller open to a 10% concession, seller financing, or rate buy-down credit?
- Is there a deadline driving the sale (1031 exchange, divorce, estate, relocation)? That informs how much negotiation room exists.
- Schools are D-rated, which usually means shorter tenancies and higher turnover. Who's the typical renter profile here, and what's been the actual vacancy rate?
- The area grade is low — what's the realistic commute time and amenity access for the typical tenant pool here? Any planned neighborhood developments (good or bad) we should know about?
- What's the average days-on-market for RENTAL listings here right now (not sales)? A rising rental-DOM trend means longer vacancies and softer asking-rent achievability than the comps imply.
- What's the recent tenant-quality profile in this submarket — average credit score on applications, eviction rate, late-payment / NSF rate, and stable-employment percentage? A property-management company in the area should have these aggregated.
- How much new for-sale + rental construction is in the pipeline within 1–3 miles? Heavy new supply typically softens prices + rents 12–24 months out; constrained supply supports both.
Investment metrics
- 1% rule
- 0.90% ✗
- Cap rate
- 5.94%
- Cash-on-cash
- -1.27%
- DSCR
- 0.94
- GRM
- 9.3
CMA / ARV
- ARV (on-the-fly)
- $198,120
- Comps found
- 12
Show comp detail 12 sales within ~0.75 mi
| Address | Dist | Beds/Ba | Sqft | Sold | Price | $/sf | Match |
|---|---|---|---|---|---|---|---|
| 2823 Tampico St | 0.39mi | 3/2.0 | 1,550 (+2%) | 4mo | $194,999 | $126 | 76 |
| 3110 E Brazil St | 0.25mi | 3/2.5 | 1,605 (+5%) | 12mo | $265,000 | $165 | 67 |
| 406 28th St | 0.18mi | 4/2.0 (+1) | 1,433 (-6%) | 16mo | $101,500 | $71 | 63 |
| 2202 E Esperanza Ave | 0.58mi | 3/2.0 | 1,522 (-0%) | 14mo | $210,000 | $138 | 61 |
| 3008 E Brazil Ave | 0.25mi | 3/2.0 | 1,744 (+14%) | 10mo | $280,000 | $161 | 56 |
| 2111 E Ithica Ave | 0.69mi | 3/2.0 | 1,534 (+1%) | 16mo | $205,000 | $134 | 54 |
| 2703 Torreon St | 0.61mi | 3/2.0 | 1,371 (-10%) | 2mo | $239,000 | $174 | 54 |
| 309 Sabinas St | 0.37mi | 3/2.0 | 1,344 (-12%) | 18mo | $175,000 | $130 | 48 |
| 2114 Monterrey St | 0.69mi | 4/2.0 (+1) | 1,397 (-8%) | 2mo | $179,500 | $128 | 47 |
| 2204 Gardenia Ave | 0.60mi | 3/2.0 | 1,325 (-13%) | 8mo | $140,000 | $106 | 44 |
| 2108 E Esperanza Dr | 0.61mi | 3/2.0 | 1,709 (+12%) | 22mo | $219,500 | $128 | 33 |
| 203 Russel Ct | 0.62mi | 4/2.5 (+1) | 1,315 (-14%) | 23mo | $159,000 | $121 | 22 |
Match score weights: distance 35% · size 25% · config 20% · recency 20%. Top-matched comps best support the ARV.
Projected returns pro-forma
10.0% appreciation · 3.0% rent growth · sell at horizon
- IRR
- 23.4%
- Equity multiple
- 2.88×
- Total profit
- $99,976
- Equity at exit
- $171,167
- IRR
- 20.8%
- Equity multiple
- 6.59×
- Total profit
- $297,387
- Equity at exit
- $369,128
Cash invested: $53,200 (down + closing). Projections, not guarantees.
Landlord ↔ Tenant lean methodology
- Overall (STATE)
- 87 Strongly Landlord-Friendly
- State Texas
- 87 Strongly Landlord-Friendly · R+5
- County
- — inherits STATE
- City
- — inherits STATE
ZIP-level market 78557
- Home prices YoY
- 17.9%
- Active inventory
- 98
- Price-to-rent
- 9.3×
Monthly cashflow live
- Estimated rent
- $1,701 high interval (Pro) →
- Mortgage (P&I)
- −$996
- Tax from tax record
- −$324 /mo · $3,890/yr
- Insurance
- −$79
- HOA
- −$0
- Vacancy / Maint / Mgmt
- −$357
- Net cashflow
- $-56
Break-even live
UW: 25.0% down · 7.5% · 30yr · 1.5% tax · 5.0% vac · 8.0% maint · 8.0% mgmt
Financing live
Cash to close
- Down payment
- $47,500
- Closing costs
- $5,700
- Reserves months
- —
- Total cash needed
- —
Loan-product check · same deal, 3 products live
Conventional
25% down · 7.5% · 30yr
- Down + closing
- —
- Monthly P&I
- —
- Monthly cashflow
- —
- DSCR
- —
- Eligible?
- —
Personal DTI + credit; lowest rate.
DSCR
20% down · 8.5% · 30yr
- Down + closing
- —
- Monthly P&I
- —
- Monthly cashflow
- —
- DSCR
- —
- Eligible?
- —
No personal income docs; deal must DSCR.
Hard money
10% down · 12.0% · 12mo
- Down + closing
- —
- Monthly P&I
- —
- Monthly cashflow
- —
- DSCR
- —
- Eligible?
- —
Short-term bridge; refi at stabilization.
Rent comps 5 comps
| Address | Beds | Baths | Sqft | Rent | $/sqft | DOM | Units | Dist |
|---|---|---|---|---|---|---|---|---|
| 2509 Coma St Hidalgo, TX | 4.0 | 2.5 | 1804 | $1,750 | $0.97 | 23d | 1 | 0.34mi |
| 704 S 17th St Hidalgo, TX | 3.0 | 2.0 | 1666 | $1,650 | $0.99 | 23d | 1 | 1.00mi |
| 607 Buccaneer Dr Unit 4 Hidalgo, TX | 3.0 | 2.0 | 1068 | $1,600 | $1.50 | 43d | 1 | 1.17mi |
| 605 Buccaneer Dr Unit 3 Hidalgo, TX | 3.0 | 2.0 | 1068 | $1,400 | $1.31 | 23d | 1 | 1.18mi |
| 2304 E Tamarindo Ave Hidalgo, TX | 3.0 | 2.0 | 1442 | $1,950 | $1.35 | 23d | 1 | 1.46mi |
Listing history 19 events
-
2026-06-19days on market $190,000 Active 34 DOM
-
2026-06-18days on market $190,000 Active 33 DOM
-
2026-06-17days on market $190,000 Active 32 DOM
-
2026-06-16days on market $190,000 Active 31 DOM
-
2026-06-15days on market $190,000 Active 30 DOM
-
2026-06-14days on market $190,000 Active 28 DOM
-
2026-06-12days on market $190,000 Active 27 DOM
-
2026-06-09days on market $190,000 Active 24 DOM
-
2026-06-08days on market $190,000 Active 23 DOM
-
2026-06-07days on market $190,000 Active 22 DOM
-
2026-06-05days on market $190,000 Active 19 DOM
-
2026-06-03days on market $190,000 Active 18 DOM
-
2026-06-03price $190,000 Active 17 DOM
-
2026-06-02days on market $220,000 Active 17 DOM
-
2026-06-01days on market $220,000 Active 16 DOM
-
2026-05-31days on market $220,000 Active 15 DOM
-
2026-05-30days on market $220,000 Active 14 DOM
-
2026-05-16$220,000 Active
-
2016-03-15soldstatus
ⓘ Source: listings_history table (triggers on properties + properties_extension) + one-shot
backfill from property_details.listing_events for pre-trigger history.
Tax reassessment forecast TX · Resets to sale price
- Current annual tax
- $3,890 · $324/mo
- Projected year-2 tax
- $3,890 · $324/mo
- Expected delta
- $0/yr ($0/mo · 0.0%)
ⓘ Screening estimate from a state-policy table — verify with the county assessor before closing.
Climate risk First Street
- Flood 1/10 Low FEMA zone X (shaded) · 0% chance over 30 yrs
- Wildfire 5/10 Major
- Heat 9/10 Extreme 7 d/yr ≥111°F today · 23 d/yr by 30 yrs out
- Wind 8/10 Severe 96% chance of damaging wind over 30 yrs
- Air quality 1/10 Low 0 unhealthy d/yr today · 0 by 30 yrs out
Nearby sold comps map
Loading sold comps map…
Walkable amenities ~0.75 mi
Loading nearby amenities…
Taxation est. · year 1
- Rental income
- $20,407
- − Mortgage interest
- −$10,643
- − Property taxes
- −$3,890
- − Insurance
- −$950
- − Repairs & maintenance
- −$1,633
- − Management
- −$1,633
- − Depreciation
- −$5,527
- Taxable loss
- −$3,868
- Est. tax savings @ 24.0%
- +$928
- After-tax cash flow
- $254/yr
For passive investors: Depreciation is non-cash, so a rental often shows a tax loss while cash-flowing — sheltering income. Rental losses are passive: they offset passive income freely, and up to $25,000/yr can offset ordinary (W-2) income if you actively participate and your MAGI is under $100k (phasing out to $0 by $150k); unused losses carry forward. On sale, claimed depreciation is recaptured at up to 25%, and gains may owe capital-gains tax (a 1031 exchange can defer both). Figures are a year-1 estimate at your 24.0% rate — not tax advice; consult a CPA.
Schools (NCES district)
- District
- Valley View ISD
- NCES district ID
- 4843800
- Math proficiency
- 24% ▼ -42.00%
- Reading proficiency
- 38% ▼ -16.00%
- Median HH income
- $33,158
- Composite
- 25.37/100
- National rank
- #7473
- State rank
- #631 of 826 in TX
Livability — Hidalgo
- Score
- 68/100
- State rank
- #488
- US rank
- #9681
Category grades
Schools grade is shown separately in the Schools card above.
Census & demographics
- Census place
- Hidalgo, TX
- City population
- 14,250
- Population (ZIP)
- 14,250
Population outlook (Hidalgo County) Hauer SSP2
- Today (2025)
- 955,232 people
- By 2030
- 1,009,774 · +5.7%
- By 2040
- 1,120,332 · +17.3%
- By 2050
- 1,225,036 · +28.2%
- By 2075
- 1,439,189 · +50.7%
- By 2100
- 1,533,429 · +60.5%
Race, ethnicity, and origin ACS 2023
- Neighborhood character
- Predominantly Hispanic (99%)
- Race & ethnicity
- Hispanic / Latino 99% Two or more races 47%
- Hispanic origin (detail)
- Mexican 93%
- Foreign-born
- 39% · Canada
- Languages at home
- 6% English-only · Spanish 94%
Political lean MEDSL · Hidalgo
- 2024 margin
- Toss-up / Even · D 48.1% · R 51.0%
- 2008→2024 swing
- -41.6pp toward R · 2008: 38.7pp · 2024: -2.9pp
- All cycles
- 2024: R+2.9 2020: D+17.1 2016: D+40.5 2012: D+41.8 2008: D+38.7
Not yet ingested
- Civics
- —
Market trends
- HPI YoY
- ▲ 34.26%
- Current HPI
- 225.701
- Rent YoY
- —
- Metro
- —
- State GDP YoY
- ▲ 3.95%
- F500 in state
- 110
Industry mix (Fortune 500 HQ in TX)
| Industry | F500 HQs | Revenue |
|---|---|---|
| Energy | 16 | $1,198B |
|
||
| Technology | 5 | $198B |
|
||
| Engineering / Construction | 4 | $72B |
|
||
| Energy Services | 3 | $60B |
|
||
| Utilities | 3 | $41B |
|
||
| Healthcare | 2 | $330B |
|
||
Price history
2 events — show timeline
- 2026-05-16 Listed $220,000 MCALLENMLS
- 2016-03-15 Sold (Public Records) — Public Records
Property tax history
+5.2%/yrLatest (2025): $3,890 · -6.2% YoY. Source: county tax records.
Cash-flow waterfall
monthlySold comps — $/sqft
last 12 mo · ≤1 miLoading sold comps…