 🏷️ Likely Rental
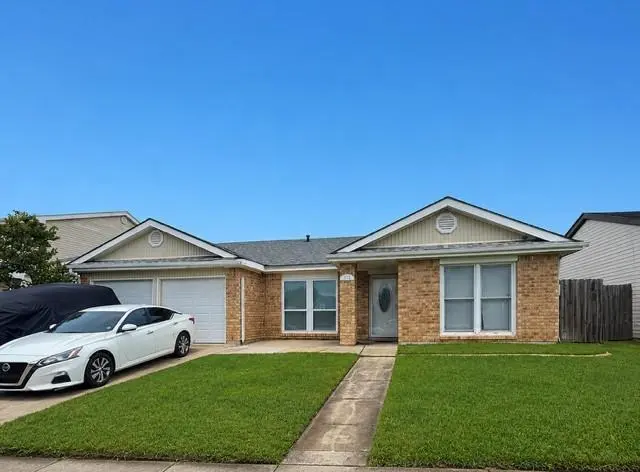
3728 Sue Ker Dr · Woodmere, LA
Flood risk 8/10 · Major
- FEMA flood zone
- X
- Chance of flooding over 30 yrs
- 0.6%
- Est. flood insurance / yr
- $507 – $1,088
Fire risk 1/10 · Minimal
- Est. fire insurance / yr
- $1,269 – $2,357
Heat risk 10/10 · Severe
- Hot days now (above 108°F)
- 7 days/yr
- Hot days in 30 yrs
- 21 days/yr
Wind risk 9/10 · Severe
- Chance of severe wind over 30 yrs
- 99.0%
Air-quality risk 3/10 · Minor
- Unhealthy air days now
- 2 days/yr
- Unhealthy air days in 30 yrs
- 3 days/yr
Risk factors via First Street. Map © Google.
Why this score? — see what drove the B- grade
The composite is a weighted blend of 9 inputs, each scored 0–100. Each bar is that input's sub-score; the figure is the points it added to the 100-point composite (weight × sub-score).
- Cash flow +30.0/30.0
- 1% rule +10.0/10.0
- DSCR +10.0/10.0
- ARV discount +7.5/15.0
- Livability +3.1/5.0
- Schools +2.5/10.0
- Condition / age +2.5/5.0
- Rent growth +1.5/5.0
- Appreciation +0.0/10.0
$110,000
🖨 Deal sheet 📄 Offer letter ✓ Due diligence
Listing remarks MLS
***Seller is calling for highest & best. All offers due by Monday june 8th at 8 PM with all offers having an expiration of Tuesday, June 9 at 8 PM ***PRICED TO SELL! Home has been tenant occupied for many years, spacious 4 bedrooms, large formal living & dining room, roof replaced post Ida then patch work done past 6 months , under termite contract via Billiot, flood zone x (no insurance currently on the property), HVAC outside 2013 inside 2012 serviced May 2026. Tenant to vacate by 6/21/26. No repairs will be done as inspections are solely for buyer informational purposes only.
Key facts
- 5,998 sq ft lot
- Garage
- Built 1985
Property features AI
Finance
- Other: Property is human-modified
Exterior
- Parking: Garage with three or more spaces
- Utilities: Public water; Public sewer
- Home design: Single-story; Entry level not specified; Facing direction not specified
- Construction: Brick construction; Shingle roof; Slab foundation; Built year not specified
- Exterior features: City lot; Rectangular lot; Lot dimensions approximately 60 x 100
Interior
- Kitchen: Dishwasher; Oven; Refrigerator
- Bedrooms: Total of 7 rooms (bedroom count not specified)
- Bathrooms: 2 full bathrooms
- Heating & cooling: Central heating; Central air conditioning
- Interior features: Average condition
Neighborhood map
What this means for you Summary
Snapshot
- This is a 4-bed/2.0-bath single-family listed at $110k.
Deal economics
- At list price, monthly cash flow is $982 ($12k/yr) — positive.
- The deal already cash-flows at list — no discount required.
- Meets the 1% rule at list price ($2k rent vs $110k).
- Cap rate 17.7% vs local median 6.7% in Woodmere — top-decile yield for the area; either an underpriced asset or a hidden risk that comps aren't pricing in. Stress-test before assuming the spread holds.
Location & tenants
- Location reads 62/100 on livability (#216 in LA) — a middle-class / working-renter tenant base. Strengths: cost of living A+, housing A+; Watch: schools F, crime F, amenities F.
- Jefferson Parish (suburban): math 24% / reading 34% proficiency, ranked #44 of 98 in LA (top 45%) — low school quality limits family demand, transient renter base, plan for 1-2y turnover; 70% free/reduced lunch — lower-income household profile, screen leases tightly.
- Market conditions: Rents falling (-3.9%/yr); 187 active listings in the ZIP; 5 comparable units currently listed for rent nearby; rentals at typical pace (median 24d on market — plan ~3-4 weeks tenant-placement turnaround); 40% of comp listings sitting > 30 days — soft ceiling on asking rent; 518 units permitted in Jefferson Parish in 2024 (43 in 5+ unit buildings).
- This rent runs 43% of the median local income ($62k/yr) — at the standard rent-burdened threshold; future hikes will face affordability resistance.
Forward outlook
- Local home prices are declining (-3.0%/yr); year-one equity from $761 of loan paydown is wiped out by about $3k of value loss. Plan a longer hold.
- At projected returns (-3.0% appreciation + 0.0% rent growth), your $31k cash investment doubles in ~4 years — after that, you're playing with house money.
Negotiation context
- Only 7 days on market — expect competitive offers; lowballing is unlikely to land.
- 4 sale attempts since 13y ago with the ask held roughly flat each time — persistent listings suggest the price (not the market) is what's stuck; bring a comps-based counter.
- Current owner paid $60k; list at $110k implies a 83% gain — meaningful room to come down on a strong offer.
Risks & watch-outs
- Watch-outs: flood insurance adds $66/mo.
- Climate carrying-cost: severe flood risk; severe wind risk, 99% chance of damaging wind over 30y; extreme-heat days projected 7→21/yr by 2055 (HVAC capex compounding) — expect insurance premiums to compound above CPI over the hold.
Questions for the listing agent
- What's the actual annual flood-insurance premium (NFIP or private), and is the property in a SFHA with mandatory coverage?
- Is there a deadline driving the sale (1031 exchange, divorce, estate, relocation)? That informs how much negotiation room exists.
- Schools are F-rated, which usually means shorter tenancies and higher turnover. Who's the typical renter profile here, and what's been the actual vacancy rate?
- Crime grade is F in this area — have there been break-ins, vandalism, or insurance claims at this property in the last 3 years? What carrier currently insures it and at what premium?
- What's the average days-on-market for RENTAL listings here right now (not sales)? A rising rental-DOM trend means longer vacancies and softer asking-rent achievability than the comps imply.
- What's the recent tenant-quality profile in this submarket — average credit score on applications, eviction rate, late-payment / NSF rate, and stable-employment percentage? A property-management company in the area should have these aggregated.
- How much new for-sale + rental construction is in the pipeline within 1–3 miles? Heavy new supply typically softens prices + rents 12–24 months out; constrained supply supports both.
Investment metrics
- 1% rule
- 2.04% ✓
- Cap rate
- 17.73%
- Cash-on-cash
- 40.84%
- DSCR
- 2.82
- GRM
- 4.1
CMA / ARV
- ARV (on-the-fly)
- $229,092
- Comps found
- 12
Show comp detail 12 sales within ~0.75 mi
| Address | Dist | Beds/Ba | Sqft | Sold | Price | $/sf | Match |
|---|---|---|---|---|---|---|---|
| 3809 Agateway Dr | 0.08mi | 4/2.0 | 2,200 (-2%) | 8mo | $225,000 | $102 | 86 |
| 3832 Burntwood Dr | 0.19mi | 4/2.5 | 2,300 (+2%) | 1mo | $269,900 | $117 | 84 |
| 3716 Inwood Dr | 0.34mi | 3/2.5 (-1) | 2,196 (-2%) | 1mo | $175,000 | $80 | 72 |
| 3177 Primwood Dr | 0.48mi | 4/2.5 | 2,278 (+1%) | 3mo | $238,500 | $105 | 71 |
| 3148 Keithway Dr | 0.44mi | 4/2.0 | 2,196 (-2%) | 6mo | $219,500 | $100 | 71 |
| 3812 Chadwood Dr | 0.47mi | 4/2.5 | 2,300 (+2%) | 3mo | $207,000 | $90 | 70 |
| 2932 Keith Way Dr | 0.24mi | 4/2.0 | 2,018 (-10%) | 5mo | $255,000 | $126 | 68 |
| 3701 Dulaney St | 0.19mi | 3/2.0 (-1) | 1,986 (-12%) | 1mo | $232,000 | $117 | 66 |
| 3804 Glenoak Dr | 0.29mi | 3/2.5 (-1) | 2,160 (-4%) | 9mo | $205,000 | $95 | 66 |
| 3836 Morriswood Dr | 0.20mi | 3/2.5 (-1) | 2,100 (-6%) | 9mo | $168,000 | $80 | 65 |
| 3884 Chinkapin St | 0.67mi | 4/2.5 | 2,275 (+1%) | 1mo | $233,000 | $102 | 64 |
| 3864 Nathan Kornman Dr | 0.59mi | 3/2.0 (-1) | 1,986 (-12%) | 2mo | $228,000 | $115 | 47 |
Match score weights: distance 35% · size 25% · config 20% · recency 20%. Top-matched comps best support the ARV.
Projected returns pro-forma
-3.0% appreciation · 0.0% rent growth · sell at horizon
- IRR
- 30.9%
- Equity multiple
- 2.24×
- Total profit
- $38,195
- Equity at exit
- $16,401
- IRR
- 36.3%
- Equity multiple
- 3.88×
- Total profit
- $88,618
- Equity at exit
- $9,511
Cash invested: $30,800 (down + closing). Projections, not guarantees.
Landlord ↔ Tenant lean methodology
- Overall (STATE)
- 90 Strongly Landlord-Friendly
- State Louisiana
- 90 Strongly Landlord-Friendly · R+12
- County
- — inherits STATE
- City
- — inherits STATE
ZIP-level market 70058
- Rents YoY
- -3.9%
- Active inventory
- 187
- Price-to-rent
- 4.1×
Monthly cashflow live
- Estimated rent
- $2,240 high interval (Pro) →
- Mortgage (P&I)
- −$577
- Tax from tax record
- −$99 /mo · $1,185/yr
- Insurance
- −$46
- Flood insurance flood zone
- −$66 /mo · $798/yr
- HOA
- −$0
- Vacancy / Maint / Mgmt
- −$470
- Net cashflow
- $982
Break-even live
UW: 25.0% down · 7.5% · 30yr · 1.5% tax · 5.0% vac · 8.0% maint · 8.0% mgmt
Financing live
Cash to close
- Down payment
- $27,500
- Closing costs
- $3,300
- Reserves months
- —
- Total cash needed
- —
Loan-product check · same deal, 3 products live
Conventional
25% down · 7.5% · 30yr
- Down + closing
- —
- Monthly P&I
- —
- Monthly cashflow
- —
- DSCR
- —
- Eligible?
- —
Personal DTI + credit; lowest rate.
DSCR
20% down · 8.5% · 30yr
- Down + closing
- —
- Monthly P&I
- —
- Monthly cashflow
- —
- DSCR
- —
- Eligible?
- —
No personal income docs; deal must DSCR.
Hard money
10% down · 12.0% · 12mo
- Down + closing
- —
- Monthly P&I
- —
- Monthly cashflow
- —
- DSCR
- —
- Eligible?
- —
Short-term bridge; refi at stabilization.
Rent comps 5 comps
| Address | Beds | Baths | Sqft | Rent | $/sqft | DOM | Units | Dist |
|---|---|---|---|---|---|---|---|---|
| 2323 N Harper Dr Harvey, LA | 3.0 | 2.0 | 1678 | $3,000 | $1.79 | 43d | 1 | 1.16mi |
| 2713 W Friendship Dr Harvey, LA | 3.0 | 2.0 | 1750 | $1,850 | $1.06 | 23d | 1 | 1.24mi |
| 2424 Oakmere Dr Harvey, LA | 4.0 | 2.0 | 3000 | $2,400 | $0.80 | 23d | 1 | 1.38mi |
| 4016 S Dells St Harvey, LA | 4.0 | 2.0 | 1750 | $2,000 | $1.14 | 43d | 1 | 1.43mi |
| 2278 Telestar St Harvey, LA | 4.0 | 2.0 | 2121 | $2,450 | $1.16 | 23d | 1 | 1.45mi |
Listing history 10 events
-
2026-06-18status $110,000 Pending 7 DOM
-
2026-06-18days on market $110,000 Active 7 DOM
-
2026-06-17statusdays on market $110,000 Active 6 DOM
-
2026-06-16remarks 636-char remark
-
2026-06-13status $110,000 Pending 5 DOM
-
2026-06-10days on market $110,000 Active 5 DOM
-
2026-06-09days on market $110,000 Active 4 DOM
-
2026-06-08days on market $110,000 Active 3 DOM
-
2026-06-07remarks 602-char remark
-
2026-06-07$110,000 Active 2 DOM
ⓘ Source: listings_history table (triggers on properties + properties_extension) + one-shot
backfill from property_details.listing_events for pre-trigger history.
Tax reassessment forecast LA · Resets to sale price
- Current annual tax
- $1,185 · $99/mo
- Projected year-2 tax
- $1,185 · $99/mo
- Expected delta
- $0/yr ($0/mo · 0.0%)
ⓘ Screening estimate from a state-policy table — verify with the county assessor before closing.
Climate risk First Street
- Flood 8/10 Severe FEMA zone X · 60% chance over 30 yrs
- Wildfire 1/10 Low
- Heat 10/10 Extreme 7 d/yr ≥108°F today · 21 d/yr by 30 yrs out
- Wind 9/10 Extreme 99% chance of damaging wind over 30 yrs
- Air quality 3/10 Moderate 2 unhealthy d/yr today · 3 by 30 yrs out
Nearby sold comps map
Loading sold comps map…
Walkable amenities ~0.75 mi
Loading nearby amenities…
Taxation est. · year 1
- Rental income
- $26,882
- − Mortgage interest
- −$6,162
- − Property taxes
- −$1,185
- − Insurance
- −$1,348
- − Repairs & maintenance
- −$2,151
- − Management
- −$2,151
- − Depreciation
- −$3,200
- Taxable income
- $10,687
- Est. tax owed @ 24.0%
- −$2,565
- After-tax cash flow
- $9,217/yr
For passive investors: Depreciation is non-cash, so a rental often shows a tax loss while cash-flowing — sheltering income. Rental losses are passive: they offset passive income freely, and up to $25,000/yr can offset ordinary (W-2) income if you actively participate and your MAGI is under $100k (phasing out to $0 by $150k); unused losses carry forward. On sale, claimed depreciation is recaptured at up to 25%, and gains may owe capital-gains tax (a 1031 exchange can defer both). Figures are a year-1 estimate at your 24.0% rate — not tax advice; consult a CPA.
Schools (NCES district)
- District
- Jefferson Parish
- NCES district ID
- 2200840
- Math proficiency
- 24% ▼ -36.00%
- Reading proficiency
- 34% ▼ -30.00%
- Median HH income
- $48,421
- Composite
- 25.19/100
- National rank
- #7511
- State rank
- #44 of 98 in LA
Livability — Woodmere
- Score
- 62/100
- State rank
- #216
- US rank
- #16658
Category grades
Schools grade is shown separately in the Schools card above.
Census & demographics
- Census place
- Woodmere, LA
- County
- Jefferson Parish · 426,999 people
- Metro
- New Orleans-Metairie, LA
- Population (ZIP)
- 39,578
- Household income
- $62,416
- Rent vs Own
- Severe rent burden
- 1992.0
Population outlook (Jefferson County) Hauer SSP2
- Today (2025)
- 451,696 people
- By 2030
- 455,451 · +0.8%
- By 2040
- 458,308 · +1.5%
- By 2050
- 461,031 · +2.1%
- By 2075
- 476,351 · +5.5%
- By 2100
- 499,377 · +10.6%
Race, ethnicity, and origin ACS 2023
- Neighborhood character
- Diverse neighborhood (Simpson 0.60)
- Race & ethnicity
- Black 58% White 20% Hispanic / Latino 13% Asian 7% Two or more races 4%
- Hispanic origin (detail)
- Mexican 1% Dominican 1%
- Common ancestry
- Lithuanian 4% Hispanic 1%
- Foreign-born
- 13% · Canada, Vietnam
- Languages at home
- 81% English-only · Spanish 10% Vietnamese 5% French/Haitian/Cajun 2%
Political lean MEDSL · Jefferson
- 2024 margin
- R (+12.9) · D 42.5% · R 55.5% · Other 2.1%
- 2008→2024 swing
- +13.6pp toward D · 2008: -26.6pp · 2024: -12.9pp
- All cycles
- 2024: R+12.9 2020: R+11.1 2016: R+14.8 2012: R+18.4 2008: R+26.6
Not yet ingested
- Civics
- —
Market trends
- HPI YoY
- ▼ -96.82%
- Current HPI
- 156.1052
- Rent YoY
- ▼ -3.88%
- Metro
- New Orleans-Metairie, LA
- State GDP YoY
- ▲ 3.29%
- F500 in state
- 10
Industry mix (Fortune 500 HQ in LA)
| Industry | F500 HQs | Revenue |
|---|---|---|
| Telecommunications | 2 | $23B |
|
||
| Utilities | 1 | $12B |
|
||
| Wholesale / Distribution | 1 | $5B |
|
||
| Advertising | 1 | $2B |
|
||
Price history
+17.0% since first listed6 events — show timeline
- 2026-06-05 Listed $110,000 AcadianaMLS
- 2026-06-05 Listed $110,000 GSREIN
- 2013-04-03 Sold (MLS) $60,000 GSREIN
- 2013-02-19 Listed $60,000 AcadianaMLS
- 2013-02-19 Listed $60,000 GSREIN
- 2003-02-01 Sold (Public Records) $94,000 Public Records
Property tax history
+2.9%/yrLatest (2025): $1,185 · +0.3% YoY. Source: county tax records.
Cash-flow waterfall
monthlySold comps — $/sqft
last 12 mo · ≤1 miLoading sold comps…