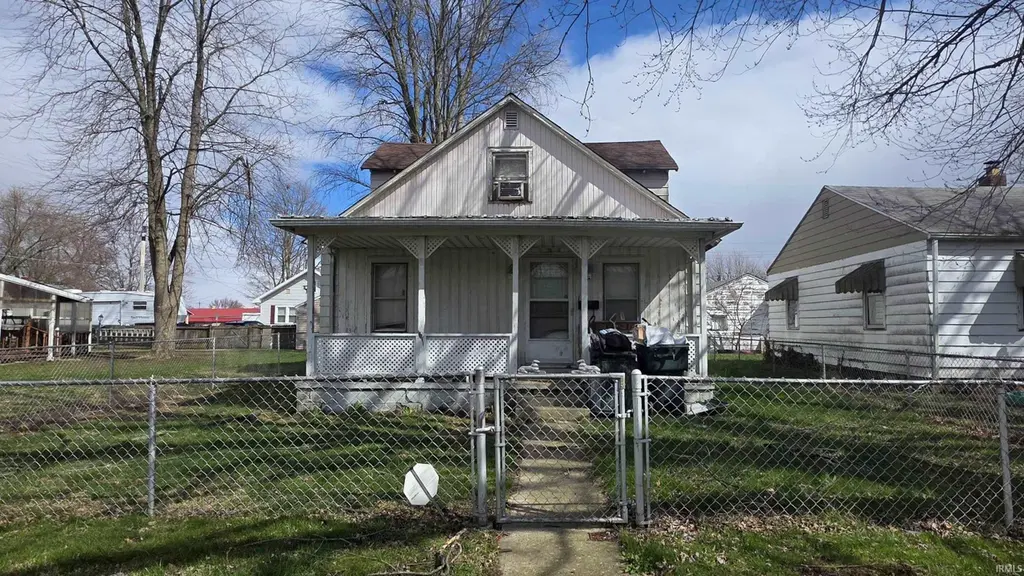
2004 S Macedonia Ave · Muncie, IN
Flood risk 1/10 · Minimal
- FEMA flood zone
- X (unshaded)
- Chance of flooding over 30 yrs
- 0.0%
- Est. flood insurance / yr
- $507 – $1,088
Fire risk 1/10 · Minimal
- Est. fire insurance / yr
- $717 – $1,331
Heat risk 3/10 · Minor
- Hot days now (above 101°F)
- 7 days/yr
- Hot days in 30 yrs
- 18 days/yr
Wind risk 2/10 · Minimal
- Chance of severe wind over 30 yrs
- 0.0%
Air-quality risk 3/10 · Minor
- Unhealthy air days now
- 2 days/yr
- Unhealthy air days in 30 yrs
- 3 days/yr
Risk factors via First Street. Map © Google.
Why this score? — see what drove the B+ grade
The composite is a weighted blend of 9 inputs, each scored 0–100. Each bar is that input's sub-score; the figure is the points it added to the 100-point composite (weight × sub-score).
- Cash flow +30.0/30.0
- ARV discount +15.0/15.0
- 1% rule +10.0/10.0
- DSCR +10.0/10.0
- Rent growth +4.0/5.0
- Livability +4.0/5.0
- Condition / age +2.5/5.0
- Schools +1.7/10.0
- Appreciation +0.0/10.0
$63,000
🖨 Deal sheet (PDF) 📄 Offer letter ✓ Due diligence
Listing remarks MLS
Charming home with great potential! The main floor has been thoughtfully updated, offering a move-in ready living space with modern touches. Upstairs, you’ll find additional space ready for your personal vision—perfect for adding value with a little TLC, including an unfinished bathroom. The fenced yard provides room to enjoy the outdoors, while the 1-car garage and additional rear parking offer plenty of convenience. A fantastic opportunity to make this home your own!
Key facts
- Fenced yard
- 5,227 sq ft lot
- 2 garage spots
Tags
Neighborhood map
What this means for you Summary
Snapshot
- This is a 4-bed/1.5-bath single-family listed at $63k.
Deal economics
- At list price, monthly cash flow is $593 ($7k/yr) — positive.
- The deal already cash-flows at list — no discount required.
- Meets the 1% rule at list price ($1k rent vs $63k).
- Recommended offer: $62k (1.5% below list) — sets the bar for market timing.
- Cap rate 17.6% vs local median 6.0% in Muncie — top-decile yield for the area; either an underpriced asset or a hidden risk that comps aren't pricing in. Stress-test before assuming the spread holds.
Location & tenants
- Location reads 80/100 on livability (#18 in IN, #1,654 nationally) — a professional / high-income tenant draw. Strengths: amenities A+, commute A+, cost of living A+; Watch: schools D+, crime F, employment F.
- Muncie Community Schools (urban): math 18% / reading 25% proficiency, ranked #275 of 301 in IN (top 91%) — low school quality limits family demand, transient renter base, plan for 1-2y turnover; 68% free/reduced lunch — lower-income household profile, screen leases tightly.
- Market conditions: Rents rising fast (+6.1%/yr); 148 active listings in the ZIP; 10 comparable units currently listed for rent nearby; rentals lingering (median 45d on market — plan ~5-8 weeks vacancy on turnover, expect pricing pressure); 100% of comp listings sitting > 30 days — soft ceiling on asking rent; 171 units permitted in Delaware County in 2024 (57 in 5+ unit buildings).
- This rent runs 32% of the median local income ($48k/yr) — at the standard rent-burdened threshold; future hikes will face affordability resistance.
Forward outlook
- Local home prices are declining (-3.0%/yr); year-one equity from $436 of loan paydown is wiped out by about $2k of value loss. Plan a longer hold.
- Delaware County population projected at -11% by 2050 — secular population decline; favor cash flow + early exit over multi-decade hold.
- At projected returns (-3.0% appreciation + 6.1% rent growth), your $18k cash investment doubles in ~3 years — after that, you're playing with house money.
Negotiation context
- It's been on market 17 days — a 2% lower offer ($62k) is reasonable based on typical stale-listing flexibility.
- 2 sale attempts with the ask held roughly flat each time — persistent listings suggest the price (not the market) is what's stuck; bring a comps-based counter.
Risks & watch-outs
- Watch-outs: built in 1947 — expect roof / HVAC / electrical / plumbing capex.
Questions for the listing agent
- Built in 1947 — when were the roof, HVAC, electrical panel, plumbing, and water heater last replaced?
- Is there a deadline driving the sale (1031 exchange, divorce, estate, relocation)? That informs how much negotiation room exists.
- Schools are D-rated, which usually means shorter tenancies and higher turnover. Who's the typical renter profile here, and what's been the actual vacancy rate?
- Crime grade is F in this area — have there been break-ins, vandalism, or insurance claims at this property in the last 3 years? What carrier currently insures it and at what premium?
- What's the average days-on-market for RENTAL listings here right now (not sales)? A rising rental-DOM trend means longer vacancies and softer asking-rent achievability than the comps imply.
- What's the recent tenant-quality profile in this submarket — average credit score on applications, eviction rate, late-payment / NSF rate, and stable-employment percentage? A property-management company in the area should have these aggregated.
- How much new for-sale + rental construction is in the pipeline within 1–3 miles? Heavy new supply typically softens prices + rents 12–24 months out; constrained supply supports both.
Investment metrics
- 1% rule
- 2.01% ✓
- Cap rate
- 17.58%
- Cash-on-cash
- 40.31%
- DSCR
- 2.79
- GRM
- 4.1
CMA / ARV
- ARV (median comp)
- $88,047
- List price
- $63,000
- Delta
- -28.45%
- Verdict
- UNDERPRICED
- Comps
- 20 within 1.0 mi
Show comp detail 12 sales within ~0.75 mi
| Address | Dist | Beds/Ba | Sqft | Sold | Price | $/sf | Match |
|---|---|---|---|---|---|---|---|
| 1809 E 13th St | 0.08mi | 4/2.0 | 1,762 (+3%) | 9mo | $63,000 | $36 | 81 |
| 1901 E 14th St | 0.14mi | 3/2.0 (-1) | 1,621 (-5%) | 1mo | $167,000 | $103 | 77 |
| 1910 S May Ave | 0.72mi | 4/2.0 | 1,640 (-4%) | 8mo | $93,000 | $57 | 51 |
| 1048 S Burlington Dr | 0.72mi | 3/1.0 (-1) | 1,678 (-2%) | 8mo | $94,900 | $57 | 51 |
| 1510 S Hackley St | 0.60mi | 3/2.0 (-1) | 1,674 (-2%) | 14mo | $44,000 | $26 | 50 |
| 1424 S Meeker Ave | 0.58mi | 4/2.0 | 1,904 (+12%) | 3mo | $88,000 | $46 | 49 |
| 1511 S Meeker Ave | 0.54mi | 4/2.0 | 1,936 (+14%) | 5mo | $174,900 | $90 | 46 |
| 2103 S Hackley St | 0.54mi | 4/2.0 | 1,888 (+11%) | 11mo | $80,000 | $42 | 45 |
| 1405 S Ribble Ave | 0.50mi | 3/1.0 (-1) | 1,555 (-9%) | 13mo | $150,000 | $96 | 45 |
| 2410 S Ebright St | 0.54mi | 4/1.0 | 1,940 (+14%) | 8mo | $105,000 | $54 | 43 |
| 1710 E 22nd St | 0.59mi | 3/2.0 (-1) | 1,865 (+9%) | 14mo | $179,900 | $96 | 38 |
| 800 S Macedonia Ave | 0.72mi | 5/2.0 (+1) | 1,921 (+13%) | 3mo | $132,000 | $69 | 35 |
Match score weights: distance 35% · size 25% · config 20% · recency 20%. Top-matched comps best support the ARV.
Projected returns pro-forma
-3.0% appreciation · 6.11% rent growth · sell at horizon
- IRR
- 40.1%
- Equity multiple
- 2.79×
- Total profit
- $31,619
- Equity at exit
- $9,394
- IRR
- 47.9%
- Equity multiple
- 6.33×
- Total profit
- $94,017
- Equity at exit
- $5,447
Cash invested: $17,640 (down + closing). Projections, not guarantees.
Landlord ↔ Tenant lean methodology
- Overall (STATE)
- 90 Strongly Landlord-Friendly
- State Indiana
- 90 Strongly Landlord-Friendly · R+11
- County
- — inherits STATE
- City
- — inherits STATE
ZIP-level market 47302
- Home prices YoY
- -12.6%
- Rents YoY
- 6.1%
- Active inventory
- 148
- Price-to-rent
- 4.1×
Monthly cashflow live
- Estimated rent
- $1,267 high interval (Pro) →
- Mortgage (P&I)
- −$330
- Tax from tax record
- −$52 /mo · $620/yr
- Insurance
- −$26
- HOA
- −$0
- Vacancy / Maint / Mgmt
- −$266
- Net cashflow
- $593
Break-even live
Sensitivity live
| Price | -10% $628 | -5% $610 | +0% $593 | +5% $575 | +10% $557 |
|---|---|---|---|---|---|
| Rent | -10% $492 | -5% $542 | +0% $593 | +5% $643 | +10% $693 |
| Rate | -1.0pp $624 | -0.5pp $609 | base $593 | +0.5pp $576 | +1.0pp $560 |
UW: 25.0% down · 7.5% · 30yr · 1.5% tax · 5.0% vac · 8.0% maint · 8.0% mgmt
Financing live
Cash to close
- Down payment
- $15,750
- Closing costs
- $1,890
- Reserves months
- —
- Total cash needed
- —
Loan-product check · same deal, 3 products live
Conventional
25% down · 7.5% · 30yr
- Down + closing
- —
- Monthly P&I
- —
- Monthly cashflow
- —
- DSCR
- —
- Eligible?
- —
Personal DTI + credit; lowest rate.
DSCR
20% down · 8.5% · 30yr
- Down + closing
- —
- Monthly P&I
- —
- Monthly cashflow
- —
- DSCR
- —
- Eligible?
- —
No personal income docs; deal must DSCR.
Hard money
10% down · 12.0% · 12mo
- Down + closing
- —
- Monthly P&I
- —
- Monthly cashflow
- —
- DSCR
- —
- Eligible?
- —
Short-term bridge; refi at stabilization.
Rent comps 10 comps
| Address | Beds | Baths | Sqft | Rent | $/sqft | DOM | Units | Dist |
|---|---|---|---|---|---|---|---|---|
| 1802 E Willard St Muncie, IN | 3.0 | 2.5 | 1224 | $1,100 | $0.90 | 44d | 1 | 0.61mi |
| 1521 E Kirby Ave Muncie, IN | 2.0–4.0 | 1.0–2.0 | 972 | $1,500 | $1.54 | 44d | 2 | 0.79mi |
| 2904 S Pershing Dr Muncie, IN | 4.0 | 1.0 | 1362 | $1,425 | $1.05 | 44d | 1 | 0.86mi |
| 1109 E Kirby Ave Muncie, IN | 2.0–3.0 | 1.0 | 971 | $975 | $1.00 | 44d | 2 | 0.87mi |
| 301 E Memorial Dr Muncie, IN | 3.0 | 1.5 | 1172 | $1,099 | $0.94 | 44d | 1 | 0.90mi |
| 3106 S Vine St Muncie, IN | 3.0 | 1.0 | 1080 | $1,200 | $1.11 | 44d | 1 | 1.00mi |
| 3508 E Memorial Dr Muncie, IN | 2.0–3.0 | 1.0–2.0 | 1029 | $1,091 | $1.06 | 44d | 7 | 1.15mi |
| 605 W 10th St Muncie, IN | 3.0 | 1.0 | 1688 | $1,150 | $0.68 | 44d | 1 | 1.37mi |
| 623 W 9th St Muncie, IN | 3.0 | 1.0 | 1574 | $1,499 | $0.95 | 44d | 1 | 1.40mi |
| 305 N Pershing Dr Muncie, IN | 3.0 | 1.0 | 1062 | $1,100 | $1.04 | 44d | 1 | 1.44mi |
Listing history 4 events
-
2026-05-18status Pending 485-char remark
Show marketing remark (485 chars)
Charming home with great potential! The main floor has been thoughtfully updated, offering a move-in ready living space with modern touches. Upstairs, you’ll find additional space ready for your personal vision—perfect for adding value with a little TLC, including an unfinished bathroom. The fenced yard provides room to enjoy the outdoors, while the 1-car garage and additional rear parking offer plenty of convenience. A fantastic opportunity to make this home your own!
-
2026-05-08status Active 485-char remark
Show marketing remark (485 chars)
Charming home with great potential! The main floor has been thoughtfully updated, offering a move-in ready living space with modern touches. Upstairs, you’ll find additional space ready for your personal vision—perfect for adding value with a little TLC, including an unfinished bathroom. The fenced yard provides room to enjoy the outdoors, while the 1-car garage and additional rear parking offer plenty of convenience. A fantastic opportunity to make this home your own!
-
2026-04-20status Pending 485-char remark
Show marketing remark (485 chars)
Charming home with great potential! The main floor has been thoughtfully updated, offering a move-in ready living space with modern touches. Upstairs, you’ll find additional space ready for your personal vision—perfect for adding value with a little TLC, including an unfinished bathroom. The fenced yard provides room to enjoy the outdoors, while the 1-car garage and additional rear parking offer plenty of convenience. A fantastic opportunity to make this home your own!
-
2026-04-13$63,000 Active 485-char remark
Show marketing remark (485 chars)
Charming home with great potential! The main floor has been thoughtfully updated, offering a move-in ready living space with modern touches. Upstairs, you’ll find additional space ready for your personal vision—perfect for adding value with a little TLC, including an unfinished bathroom. The fenced yard provides room to enjoy the outdoors, while the 1-car garage and additional rear parking offer plenty of convenience. A fantastic opportunity to make this home your own!
ⓘ Source: listings_history table (triggers on properties + properties_extension) + one-shot
backfill from property_details.listing_events for pre-trigger history.
Tax reassessment forecast IN · Partial reset (capped growth)
- Current annual tax
- $620 · $52/mo
- Projected year-2 tax
- $620 · $52/mo
- Expected delta
- $0/yr ($0/mo · 0.0%)
ⓘ Screening estimate from a state-policy table — verify with the county assessor before closing.
Climate risk First Street
- Flood 1/10 Low FEMA zone X (unshaded) · 0% chance over 30 yrs
- Wildfire 1/10 Low
- Heat 3/10 Moderate 7 d/yr ≥101°F today · 18 d/yr by 30 yrs out
- Wind 2/10 Low 0% chance of damaging wind over 30 yrs
- Air quality 3/10 Moderate 2 unhealthy d/yr today · 3 by 30 yrs out
Nearby sold comps map
Loading sold comps map…
Walkable amenities ~0.75 mi
Loading nearby amenities…
Taxation est. · year 1
- Rental income
- $15,202
- − Mortgage interest
- −$3,529
- − Property taxes
- −$620
- − Insurance
- −$315
- − Repairs & maintenance
- −$1,216
- − Management
- −$1,216
- − Depreciation
- −$1,833
- Taxable income
- $6,473
- Est. tax owed @ 24.0%
- −$1,554
- After-tax cash flow
- $5,557/yr
For passive investors: Depreciation is non-cash, so a rental often shows a tax loss while cash-flowing — sheltering income. Rental losses are passive: they offset passive income freely, and up to $25,000/yr can offset ordinary (W-2) income if you actively participate and your MAGI is under $100k (phasing out to $0 by $150k); unused losses carry forward. On sale, claimed depreciation is recaptured at up to 25%, and gains may owe capital-gains tax (a 1031 exchange can defer both). Figures are a year-1 estimate at your 24.0% rate — not tax advice; consult a CPA.
Schools (NCES district)
- District
- Muncie Community Schools
- NCES district ID
- 1807320
- Math proficiency
- 18% ▼ -9.00%
- Reading proficiency
- 25% ▼ -4.00%
- Median HH income
- $30,052
- Composite
- 17.22/100
- National rank
- #9099
- State rank
- #275 of 301 in IN
Livability — Muncie
- Score
- 80/100
- State rank
- #18
- US rank
- #1654
Category grades
Schools grade is shown separately in the Schools card above.
Census & demographics
- Census place
- Muncie, IN
- County
- Delaware County · 84,658 people
- City population
- 84,658
- Metro
- Muncie, IN
- Population (ZIP)
- 25,473
- Household income
- $47,837
- Rent vs Own
- Severe rent burden
- 1150.0
Population outlook (Delaware County) Hauer SSP2
- Today (2025)
- 113,036 people
- By 2030
- 111,313 · -1.5%
- By 2040
- 106,432 · -5.8%
- By 2050
- 100,747 · -10.9%
- By 2075
- 91,000 · -19.5%
- By 2100
- 80,687 · -28.6%
Race, ethnicity, and origin ACS 2023
- Neighborhood character
- Predominantly White (84%)
- Race & ethnicity
- White 84% Two or more races 6% Black 6% Hispanic / Latino 4%
- Common ancestry
- Italian 2% Slovak 1% Romanian 1%
- Foreign-born
- 1% · Canada
- Languages at home
- 98% English-only · Spanish 1% German/W. Germanic 1%
Political lean MEDSL · Delaware
- 2024 margin
- R (+15.8) · D 41.2% · R 57.0% · Other 1.8%
- 2008→2024 swing
- -30.8pp toward R · 2008: 15.0pp · 2024: -15.8pp
- All cycles
- 2024: R+15.8 2020: R+13.2 2016: R+13.7 2012: D+3.1 2008: D+15.0
Not yet ingested
- Civics
- —
Market trends
- HPI YoY
- ▼ -30.32%
- Current HPI
- 210.431
- Rent YoY
- ▲ 6.11%
- Metro
- Muncie, IN
- State GDP YoY
- ▲ 2.90%
- F500 in state
- 18
Industry mix (Fortune 500 HQ in IN)
| Industry | F500 HQs | Revenue |
|---|---|---|
| Industrial Machinery | 2 | $37B |
|
||
| Healthcare | 1 | $177B |
|
||
| Pharmaceuticals | 1 | $45B |
|
||
| Metals / Steel | 1 | $18B |
|
||
| Agriculture | 1 | $17B |
|
||
| Packaging | 1 | $12B |
|
||
Price history
4 events — show timeline
- 2026-05-18 Pending — IRMLS
- 2026-05-08 Relisted — IRMLS
- 2026-04-20 Pending — IRMLS
- 2026-04-13 Listed $63,000 IRMLS
Property tax history
+25.2%/yrLatest (2024): $620 · -0.0% YoY. Source: county tax records.
Cash-flow waterfall
monthlySold comps — $/sqft
last 12 mo · ≤1 miLoading sold comps…