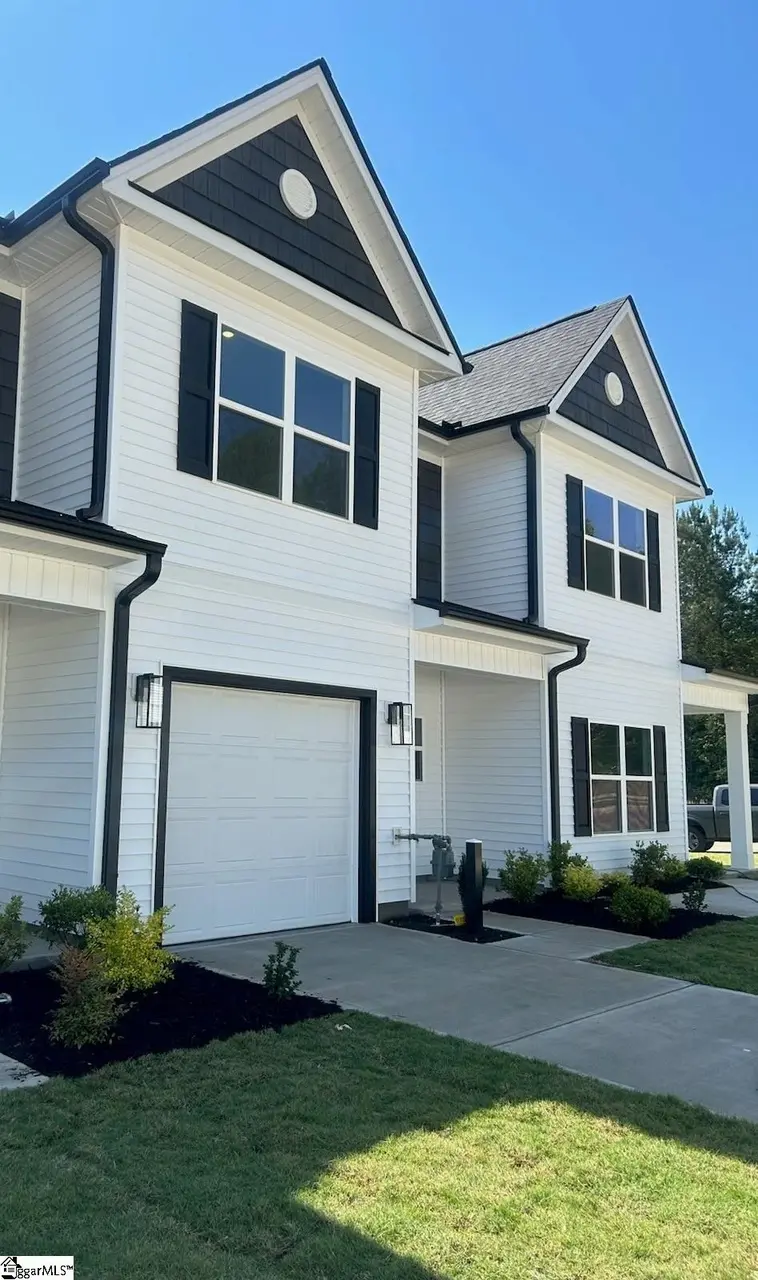
623 Farcroft Trl Lot 36 · Roebuck, SC
Flood risk 1/10 · Minimal
- FEMA flood zone
- X (unshaded)
- Chance of flooding over 30 yrs
- 0.0%
- Est. flood insurance / yr
- $507 – $1,088
Fire risk 4/10 · Minor
- Est. fire insurance / yr
- $783 – $1,453
Heat risk 5/10 · Moderate
- Hot days now (above 105°F)
- 7 days/yr
- Hot days in 30 yrs
- 16 days/yr
Wind risk 2/10 · Minimal
- Chance of severe wind over 30 yrs
- 2.0%
Air-quality risk 4/10 · Minor
- Unhealthy air days now
- 4 days/yr
- Unhealthy air days in 30 yrs
- 4 days/yr
Risk factors via First Street. Map © Google.
Why this score? — see what drove the D grade
The composite is a weighted blend of 9 inputs, each scored 0–100. Each bar is that input's sub-score; the figure is the points it added to the 100-point composite (weight × sub-score).
- Cash flow +13.3/30.0
- ARV discount +7.5/15.0
- DSCR +4.0/10.0
- Condition / age +3.8/5.0
- 1% rule +3.7/10.0
- Schools +3.2/10.0
- Livability +3.2/5.0
- Rent growth +2.5/5.0
- Appreciation +0.0/10.0
$227,150
🖨 Deal sheet (PDF) 📄 Offer letter ✓ Due diligence
Listing remarks
Parkstone Place is Adams Homes’ new Townhome Community in Roebuck! With so many upgraded yet standard included features, no detail is left out. In Model 1568, the open floor plan of Family Room and Kitchen is the perfect place to gather family and friends around the Kitchen’s beautiful Granite Counters, Ceramic Tile Backsplash, and Stainless Appliance Package which includes a Gas Range. Interior Features include: LVP or Carpet in specified rooms, and Ceilings Fans in Family Room and Primary Bedroom. Quartz counters in the Bathrooms. Primary Bath has Quartz counter and 5’ shower. 3 Bedrooms with walk-in Closets and 2.5 Baths. Convenient Second Floor Laundry. Exterior featur
Key facts
- Open floor plan
- Ceilings fans
- Granite counters
Tags
Property features AI
Finance
- HOA & community: No HOA amenities listed; HOA fee includes: none
Exterior
- Parking: Attached 1-car garage with door opener; Paved driveway
- Utilities: Public water; Public sewer; Gas water heater; Central electric forced-air cooling; Garbage pickup (private); Attached garage (utility info)
- Home design: Two-story home; 1568 Plan (model name); Estimated completion mid-2026; Facing/entry level not specified
- Construction: Built by Adams Homes; Approximate year built 2026 (under construction); Vinyl siding exterior; Architectural roof; Slab foundation
- Exterior features: Front porch; Patio; Level yard
Interior
- Kitchen: Dishwasher; Disposal; Freestanding gas range; Kitchen approx. 12 x 10
- Bedrooms: Primary bedroom on 2nd level with double sink, full bath, shower only, and walk-in closet; Second bedroom (10 x 12); Third bedroom (10 x 12); Primary bedroom approx. 13 x 15
- Flooring: Carpet; Luxury vinyl tile/plank
- Bathrooms: Two full bathrooms; One half bathroom
- Heating & cooling: Natural gas heating
- Interior features: Ceiling fans; Smooth ceilings; Granite countertops; Quartz countertops; Pantry closet; No fireplace; Great room (20 x 16)
- Laundry & utility: Second-floor laundry in closet style with electric dryer hookup
Neighborhood map
What this means for you Summary
Snapshot
- This is a 3-bed/2.5-bath townhouse listed at $227k. Condition is rated good.
Deal economics
- At list price, monthly cash flow is $0 ($-5/yr) — negative.
- To cash-flow at today's rent, offer at most $227k (0.0% below list).
- To meet the 1% rule (rent ≥ 1% of price), the offer needs to be $199k (12.5% below list).
- Recommended offer: $199k (12.5% below list) — sets the bar for 1% rule.
- Cap rate 6.3% vs local median 4.7% in Roebuck — top-decile yield for the area; either an underpriced asset or a hidden risk that comps aren't pricing in. Stress-test before assuming the spread holds.
Location & tenants
- Location reads 64/100 on livability (#147 in SC) — a middle-class / working-renter tenant base. Strengths: crime A+, cost of living A+, housing A+; Watch: amenities F, commute F, health & safety F.
- Spartanburg 06 (suburban): math 33% / reading 42% proficiency, ranked #35 of 80 in SC (top 44%) — families likely to look elsewhere, expect single-tenant / working-renter base with shorter leases.
- Zoned schools: Roebuck Elementary (math 40% / reading 37%, grade F, #306 of 597 statewide, top 51%, 800 students, 84% FRL); Dorman High (math 46% / reading 78%, grade B-, #99 of 196 statewide, top 53%, 3,808 students, 75% FRL) — zoned schools average 80% FRL vs 48% district-wide (31 pts higher); higher-poverty schools than district average — tighter screening recommended.
- Zoned-school proficiency averages 50% at this address vs 38% district-wide (+13 pts) — the actual schools serving this property are materially stronger than the Spartanburg 06 average implies; a family-tenant draw the district grade alone would hide.
- Market conditions: 144 active listings in the ZIP; 2 comparable units currently listed for rent nearby; 3,129 units permitted in Spartanburg County in 2024 (40 in 5+ unit buildings).
Forward outlook
- Local home prices are declining (-3.0%/yr); year-one equity from $2k of loan paydown is wiped out by about $7k of value loss. Plan a longer hold.
- Spartanburg County population projected at +18% by 2050 — long-run rental-demand tailwind backs the buy-and-hold thesis.
Negotiation context
- It's been on market 95 days — a 9% lower offer ($207k) is reasonable based on typical stale-listing flexibility.
Risks & watch-outs
- Climate carrying-cost: extreme-heat days projected 7→16/yr by 2055 (HVAC capex compounding) — expect insurance premiums to compound above CPI over the hold.
Questions for the listing agent
- What do current leases actually rent for vs. the listed asking? Can we see a recent rent roll and the last 12 months of T-12 income?
- It's been on market 95 days. Have you received any prior offers? Is the seller open to a 13% concession, seller financing, or rate buy-down credit?
- Why hasn't it sold? Are there any deal-killer items the seller is aware of (foundation, flood, title, zoning, code violations)?
- Is there a deadline driving the sale (1031 exchange, divorce, estate, relocation)? That informs how much negotiation room exists.
- Schools are D-rated, which usually means shorter tenancies and higher turnover. Who's the typical renter profile here, and what's been the actual vacancy rate?
- The area grade is low — what's the realistic commute time and amenity access for the typical tenant pool here? Any planned neighborhood developments (good or bad) we should know about?
- What's the average days-on-market for RENTAL listings here right now (not sales)? A rising rental-DOM trend means longer vacancies and softer asking-rent achievability than the comps imply.
- What's the recent tenant-quality profile in this submarket — average credit score on applications, eviction rate, late-payment / NSF rate, and stable-employment percentage? A property-management company in the area should have these aggregated.
- How much new for-sale + rental construction is in the pipeline within 1–3 miles? Heavy new supply typically softens prices + rents 12–24 months out; constrained supply supports both.
Investment metrics
- 1% rule
- 0.87% ✗
- Cap rate
- 6.29%
- Cash-on-cash
- -0.01%
- DSCR
- 1.00
- GRM
- 9.5
CMA / ARV
No comps found within radius.
Projected returns pro-forma
-3.0% appreciation · 3.0% rent growth · sell at horizon
- IRR
- -16.3%
- Equity multiple
- 0.42×
- Total profit
- $-36,805
- Equity at exit
- $33,869
- IRR
- -8.0%
- Equity multiple
- 0.50×
- Total profit
- $-31,961
- Equity at exit
- $19,640
Cash invested: $63,602 (down + closing). Projections, not guarantees.
Landlord ↔ Tenant lean methodology
- Overall (STATE)
- 90 Strongly Landlord-Friendly
- State South Carolina
- 90 Strongly Landlord-Friendly · R+6
- County
- — inherits STATE
- City
- — inherits STATE
ZIP-level market 29376
- Home prices YoY
- -25.6%
- Active inventory
- 144
- Price-to-rent
- 9.5×
Monthly cashflow live
- Estimated rent
- $1,987 medium interval (Pro) →
- Mortgage (P&I)
- −$1,191
- Tax est. 1.5%
- −$284 /mo · $3,407/yr
- Insurance
- −$95
- HOA
- −$0
- Vacancy / Maint / Mgmt
- −$417
- Net cashflow
- $-0
Break-even live
Sensitivity live
| Price | -10% $157 | -5% $78 | +0% $0 | +5% $-79 | +10% $-157 |
|---|---|---|---|---|---|
| Rent | -10% $-157 | -5% $-79 | +0% $0 | +5% $78 | +10% $157 |
| Rate | -1.0pp $114 | -0.5pp $57 | base $0 | +0.5pp $-59 | +1.0pp $-119 |
UW: 25.0% down · 7.5% · 30yr · 1.5% tax · 5.0% vac · 8.0% maint · 8.0% mgmt
Financing live
Cash to close
- Down payment
- $56,788
- Closing costs
- $6,814
- Reserves months
- —
- Total cash needed
- —
Loan-product check · same deal, 3 products live
Conventional
25% down · 7.5% · 30yr
- Down + closing
- —
- Monthly P&I
- —
- Monthly cashflow
- —
- DSCR
- —
- Eligible?
- —
Personal DTI + credit; lowest rate.
DSCR
20% down · 8.5% · 30yr
- Down + closing
- —
- Monthly P&I
- —
- Monthly cashflow
- —
- DSCR
- —
- Eligible?
- —
No personal income docs; deal must DSCR.
Hard money
10% down · 12.0% · 12mo
- Down + closing
- —
- Monthly P&I
- —
- Monthly cashflow
- —
- DSCR
- —
- Eligible?
- —
Short-term bridge; refi at stabilization.
Rent comps 2 comps
| Address | Beds | Baths | Sqft | Rent | $/sqft | DOM | Units | Dist |
|---|---|---|---|---|---|---|---|---|
| 6039 Haddington Dr Roebuck, SC | 3.0 | 2.5 | 1913 | $1,975 | $1.03 | 23d | 1 | 0.93mi |
| 2180 Davenport Ct Moore, SC | 3.0 | 2.0 | 1456 | $2,000 | $1.37 | 15d | 1 | 1.23mi |
Listing history 19 events
-
2026-06-22days on market $227,150 Active 95 DOM
-
2026-06-18days on market $227,150 Active 92 DOM
-
2026-06-17days on market $227,150 Active 91 DOM
-
2026-06-16days on market $227,150 Active 90 DOM
-
2026-06-15days on market $227,150 Active 89 DOM
-
2026-06-14days on market $227,150 Active 87 DOM
-
2026-06-13days on market $227,150 Active 86 DOM
-
2026-06-10days on market $227,150 Active 84 DOM
-
2026-06-09days on market $227,150 Active 83 DOM
-
2026-06-08days on market $227,150 Active 82 DOM
-
2026-06-07days on market $227,150 Active 81 DOM
-
2026-06-02days on market $227,150 Active 76 DOM
-
2026-06-01days on market $227,150 Active 75 DOM
-
2026-05-31days on market $227,150 Active 74 DOM
-
2026-05-30days on market $227,150 Active 73 DOM
-
2026-05-12price $227,150
-
2026-05-09price $232,150
-
2026-03-18price $267,150
-
2026-03-18$264,150 Active
ⓘ Source: listings_history table (triggers on properties + properties_extension) + one-shot
backfill from property_details.listing_events for pre-trigger history.
Climate risk First Street
- Flood 1/10 Low FEMA zone X (unshaded) · 0% chance over 30 yrs
- Wildfire 4/10 Moderate
- Heat 5/10 Major 7 d/yr ≥105°F today · 16 d/yr by 30 yrs out
- Wind 2/10 Low 2% chance of damaging wind over 30 yrs
- Air quality 4/10 Moderate 4 unhealthy d/yr today · 4 by 30 yrs out
Nearby sold comps map
Loading sold comps map…
Walkable amenities ~0.75 mi
Loading nearby amenities…
Taxation est. · year 1
- Rental income
- $23,838
- − Mortgage interest
- −$12,724
- − Property taxes
- −$3,407
- − Insurance
- −$1,136
- − Repairs & maintenance
- −$1,907
- − Management
- −$1,907
- − Depreciation
- −$6,608
- Taxable loss
- −$3,851
- Est. tax savings @ 24.0%
- +$924
- After-tax cash flow
- $919/yr
For passive investors: Depreciation is non-cash, so a rental often shows a tax loss while cash-flowing — sheltering income. Rental losses are passive: they offset passive income freely, and up to $25,000/yr can offset ordinary (W-2) income if you actively participate and your MAGI is under $100k (phasing out to $0 by $150k); unused losses carry forward. On sale, claimed depreciation is recaptured at up to 25%, and gains may owe capital-gains tax (a 1031 exchange can defer both). Figures are a year-1 estimate at your 24.0% rate — not tax advice; consult a CPA.
Condition & rehab AI · 3 photos
This townhouse is in good condition with a cosmetic rehab level, ready for a fresh coat of paint and some landscaping to enhance its curb appeal and value.
Value-add opportunities
- Both Painting — Fresh paint can enhance curb appeal and interior aesthetics
- Both Landscaping — Well-maintained landscaping can improve curb appeal and attract potential buyers
- Both Interior updates — Updating countertops and appliances can increase the home's value and appeal
Renovation cost estimate screening
Value-add ROI direction
- Both Painting — Fresh paint can enhance curb appeal and interior aesthetics ↑
- Both Landscaping — Well-maintained landscaping can improve curb appeal and attract potential buyers ↑
- Both Interior updates — Updating countertops and appliances can increase the home's value and appeal ↑
ⓘ Cost ranges are severity-bucket heuristics (US national rule-of-thumb). Get contractor quotes + a written scope before underwriting a rehab budget.
Schools (NCES district)
- District
- Spartanburg 06
- NCES district ID
- 4503630
- Math proficiency
- 33% ▼ -8.00%
- Reading proficiency
- 42% ▼ -2.00%
- Median HH income
- $46,110
- Composite
- 32.02/100
- National rank
- #5827
- State rank
- #35 of 80 in SC
Livability — Roebuck
- Score
- 64/100
- State rank
- #147
- US rank
- #13929
Category grades
Schools grade is shown separately in the Schools card above.
Census & demographics
- Census place
- Roebuck, SC
- Population (ZIP)
- 8,722
Population outlook (Spartanburg County) Hauer SSP2
- Today (2025)
- 325,495 people
- By 2030
- 338,800 · +4.1%
- By 2040
- 363,471 · +11.7%
- By 2050
- 384,156 · +18.0%
- By 2075
- 430,137 · +32.1%
- By 2100
- 442,733 · +36.0%
Race, ethnicity, and origin ACS 2023
- Neighborhood character
- Predominantly White (70%)
- Race & ethnicity
- White 70% Black 20% Hispanic / Latino 6% Two or more races 6% Asian 1%
- Hispanic origin (detail)
- Mexican 2% Puerto Rican 2% Cuban 2%
- Common ancestry
- Lithuanian 3% Romanian 2% Scottish 1%
- Foreign-born
- 4% · Canada
- Languages at home
- 93% English-only · Spanish 4% German/W. Germanic 2% Other Indo-European 1%
Political lean MEDSL · Spartanburg
- 2024 margin
- Solid R (+33.6) · D 32.6% · R 66.2% · Other 1.2%
- 2008→2024 swing
- -12.0pp toward R · 2008: -21.6pp · 2024: -33.6pp
- All cycles
- 2024: R+33.6 2020: R+27.3 2016: R+30.0 2012: R+23.1 2008: R+21.6
Not yet ingested
- Civics
- —
Market trends
- HPI YoY
- ▼ -77.54%
- Current HPI
- 225.2259
- Rent YoY
- —
- Metro
- —
- State GDP YoY
- ▲ 4.51%
- F500 in state
- 2
Industry mix (Fortune 500 HQ in SC)
| Industry | F500 HQs | Revenue |
|---|---|---|
| Packaging | 1 | $7B |
|
||
Price history
-14.0% since first listed4 events — show timeline
- 2026-05-12 Price Changed $227,150 Greater Greenville MLS
- 2026-05-09 Price Changed $232,150 Greater Greenville MLS
- 2026-03-18 Price Changed $267,150 Greater Greenville MLS
- 2026-03-18 Listed $264,150 Greater Greenville MLS
Cash-flow waterfall
monthlySold comps — $/sqft
last 12 mo · ≤1 miLoading sold comps…