3131 Southwest Fwy Unit C33 · Houston, TX
Flood risk 6/10 · Moderate
- FEMA flood zone
- X (unshaded)
- Chance of flooding over 30 yrs
- 0.71%
- Est. flood insurance / yr
- $507 – $1,088
Fire risk 1/10 · Minimal
- Est. fire insurance / yr
- $1,222 – $2,270
Heat risk 9/10 · Severe
- Hot days now (above 109°F)
- 7 days/yr
- Hot days in 30 yrs
- 24 days/yr
Wind risk 9/10 · Severe
- Chance of severe wind over 30 yrs
- 99.0%
Air-quality risk 2/10 · Minimal
- Unhealthy air days now
- 2 days/yr
- Unhealthy air days in 30 yrs
- 2 days/yr
Risk factors via First Street. Map © Google.
Why this score? — see what drove the D grade
The composite is a weighted blend of 9 inputs, each scored 0–100. Each bar is that input's sub-score; the figure is the points it added to the 100-point composite (weight × sub-score).
- ARV discount +13.3/15.0
- 1% rule +8.1/10.0
- Cash flow +7.1/30.0
- Livability +3.7/5.0
- Schools +2.7/10.0
- Condition / age +2.5/5.0
- Rent growth +2.2/5.0
- DSCR +1.3/10.0
- Appreciation +0.0/10.0
$110,000
🖨 Deal sheet 📄 Offer letter ✓ Due diligence
Listing remarks MLS
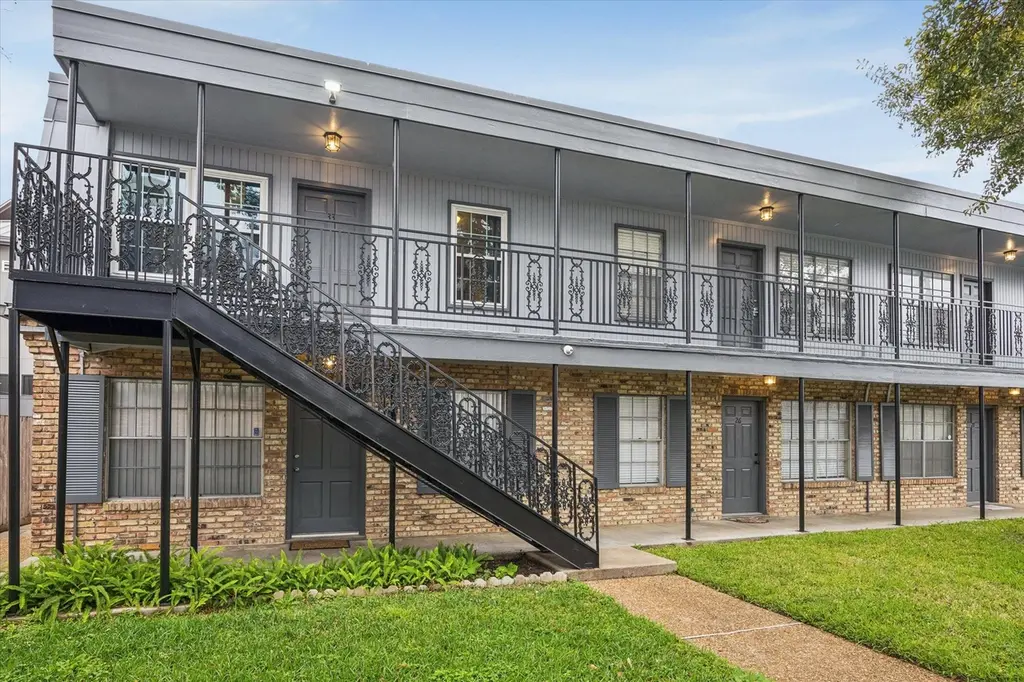
Incredible find in the middle of everything. Nothing like it in the inner loop. This upstairs end unit is move in ready .Engineered hardwoods through out. Kitchen has been completely remolded with customs cabinets, granite counter tops, and SS appliances. Plenty of work space and storage. Walk in closet in primary bedroom complete with a full size washer dryer. One covered parking space with plenty of guest parking. Courtyard location overlooking a sparkling pool.
Key facts
- Custom cabinets
- Upstairs end unit
- Ss appliances
Tags
Neighborhood map
What this means for you Summary
Snapshot
- This is a 1-bed/1.0-bath condo listed at $110k.
Deal economics
- At list price, monthly cash flow is $-157 ($-2k/yr) — negative.
- To cash-flow at today's rent, offer at most $82k (25.2% below list).
- Meets the 1% rule at list price ($1k rent vs $110k).
- Recommended offer: $82k (25.2% below list) — sets the bar for cash-flow.
- Cap rate 4.6% vs local median 3.2% in Houston — top-decile yield for the area; either an underpriced asset or a hidden risk that comps aren't pricing in. Stress-test before assuming the spread holds.
Location & tenants
- Location reads 74/100 on livability (#184 in TX, #4,771 nationally) — a middle-class / working-renter tenant base. Strengths: amenities A+, cost of living A+, housing A+; Watch: schools D, crime F.
- Houston ISD (urban): math 27% / reading 35% proficiency, ranked #593 of 826 in TX (top 72%) — families likely to look elsewhere, expect single-tenant / working-renter base with shorter leases; 71% free/reduced lunch — lower-income household profile, screen leases tightly.
- Market conditions: Rents soft (-1.1%/yr); 139 active listings in the ZIP; 40 comparable units currently listed for rent nearby; rentals leasing fast (median 8d on market — plan ~1-2 weeks tenant-placement turnaround); high-income renter base; 29,883 units permitted in Harris County in 2024 (8,621 in 5+ unit buildings).
- This rent is only 15% of the median local income ($117k/yr) — well below the 30% rent-burden line; pricing power to push rent on renewal without tenant pushback.
Forward outlook
- Local home prices are declining (-3.0%/yr); year-one equity from $761 of loan paydown is wiped out by about $3k of value loss. Plan a longer hold.
- Harris County population projected at +47% by 2050 — long-run rental-demand tailwind backs the buy-and-hold thesis.
Negotiation context
- It's been on market 133 days — a 12% lower offer ($97k) is reasonable based on typical stale-listing flexibility.
Risks & watch-outs
- Watch-outs: HOA is 35% of rent.
- Climate carrying-cost: major flood risk; severe wind risk, 99% chance of damaging wind over 30y; extreme-heat days projected 7→24/yr by 2055 (HVAC capex compounding) — expect insurance premiums to compound above CPI over the hold.
Questions for the listing agent
- What do current leases actually rent for vs. the listed asking? Can we see a recent rent roll and the last 12 months of T-12 income?
- It's been on market 133 days. Have you received any prior offers? Is the seller open to a 25% concession, seller financing, or rate buy-down credit?
- Built in 1965 — when were the roof, HVAC, electrical panel, plumbing, and water heater last replaced?
- What does the HOA fee cover, when was the last increase, and are there any pending special assessments or reserve-fund shortfalls?
- Any open or pending special assessments — roof, HVAC, plumbing, elevator, façade? What's the per-unit balance and payoff schedule, and is the seller paying it off at close or rolling it to the buyer?
- Why hasn't it sold? Are there any deal-killer items the seller is aware of (foundation, flood, title, zoning, code violations)?
- Is there a deadline driving the sale (1031 exchange, divorce, estate, relocation)? That informs how much negotiation room exists.
- Schools are D-rated, which usually means shorter tenancies and higher turnover. Who's the typical renter profile here, and what's been the actual vacancy rate?
- Crime grade is F in this area — have there been break-ins, vandalism, or insurance claims at this property in the last 3 years? What carrier currently insures it and at what premium?
- The area grade is low — what's the realistic commute time and amenity access for the typical tenant pool here? Any planned neighborhood developments (good or bad) we should know about?
- What's the average days-on-market for RENTAL listings here right now (not sales)? A rising rental-DOM trend means longer vacancies and softer asking-rent achievability than the comps imply.
- What's the recent tenant-quality profile in this submarket — average credit score on applications, eviction rate, late-payment / NSF rate, and stable-employment percentage? A property-management company in the area should have these aggregated.
- How much new apartment / multifamily construction is in the pipeline within 1–3 miles? Heavy new supply (>2% of stock underway) typically softens rents 12–24 months out; light construction supports rent growth.
Investment metrics
- 1% rule
- 1.31% ✓
- Cap rate
- 4.58%
- Cash-on-cash
- -6.11%
- DSCR
- 0.73
- GRM
- 6.4
CMA / ARV
- ARV (median comp)
- $126,188
- List price
- $110,000
- Delta
- -12.83%
- Verdict
- UNDERPRICED
- Comps
- 20 within 1.0 mi
Projected returns pro-forma
-3.0% appreciation · 0.0% rent growth · sell at horizon
- IRR
- -32.9%
- Equity multiple
- -0.03×
- Total profit
- $-31,678
- Equity at exit
- $16,401
- IRR
- -85.6%
- Equity multiple
- -0.80×
- Total profit
- $-55,303
- Equity at exit
- $9,511
Cash invested: $30,800 (down + closing). Projections, not guarantees.
Landlord ↔ Tenant lean methodology
- Overall (STATE)
- 87 Strongly Landlord-Friendly
- State Texas
- 87 Strongly Landlord-Friendly · R+5
- County
- — inherits STATE
- City
- — inherits STATE
ZIP-level market 77098
- Rents YoY
- -1.1%
- Active inventory
- 139
- Price-to-rent
- 6.4×
Monthly cashflow live
- Estimated rent
- $1,436 high interval (Pro) →
- Mortgage (P&I)
- −$577
- Tax from tax record
- −$169 /mo · $2,025/yr
- Insurance
- −$46
- HOA
- −$500
- Vacancy / Maint / Mgmt
- −$302
- Net cashflow
- $-157
Break-even live
UW: 25.0% down · 7.5% · 30yr · 1.5% tax · 5.0% vac · 8.0% maint · 8.0% mgmt
Financing live
Cash to close
- Down payment
- $27,500
- Closing costs
- $3,300
- Reserves months
- —
- Total cash needed
- —
Loan-product check · same deal, 3 products live
Conventional
25% down · 7.5% · 30yr
- Down + closing
- —
- Monthly P&I
- —
- Monthly cashflow
- —
- DSCR
- —
- Eligible?
- —
Personal DTI + credit; lowest rate.
DSCR
20% down · 8.5% · 30yr
- Down + closing
- —
- Monthly P&I
- —
- Monthly cashflow
- —
- DSCR
- —
- Eligible?
- —
No personal income docs; deal must DSCR.
Hard money
10% down · 12.0% · 12mo
- Down + closing
- —
- Monthly P&I
- —
- Monthly cashflow
- —
- DSCR
- —
- Eligible?
- —
Short-term bridge; refi at stabilization.
Rent comps 40 comps
| Address | Beds | Baths | Sqft | Rent | $/sqft | DOM | Units | Dist |
|---|---|---|---|---|---|---|---|---|
| 2939 Westpark Dr Houston, TX | 2.0 | 1.0–2.0 | 622 | $1,199 | $1.93 | 2d | 41 | 0.15mi |
| 3000 Bissonnet St Unit 3015 Houston, TX | 1.0 | 1.0 | 716 | $1,453 | $2.03 | 14d | 1 | 0.20mi |
| 3815 Eastside St Houston, TX | 2.0 | 1.0–2.5 | 1253 | $3,066 | $2.45 | 3d | 20 | 0.23mi |
| 3800 Audley St Houston, TX | 1.0–2.0 | 1.0–2.0 | 923 | $1,339 | $1.45 | 1d | 21 | 0.24mi |
| 2828 Southwest Fwy Houston, TX | — | 1.0 | 348 | $1,174 | $3.37 | 2d | 30 | 0.25mi |
| 2828 Southwest Fwy Unit 101 Houston, TX | — | 1.0 | 367 | $995 | $2.71 | 24d | 1 | 0.25mi |
| 2630 Bissonnet St Houston, TX | 2.0 | 1.0–2.0 | 866 | $1,905 | $2.20 | 1d | 21 | 0.38mi |
| 5151 Edloe St Houston, TX | 1.0–3.0 | 1.0–2.0 | 1102 | $1,386 | $1.26 | 1d | 33 | 0.41mi |
| 3271 Sul Ross St Houston, TX | 1.0–2.0 | 1.0–2.0 | 815 | $1,350 | $1.66 | 3d | 2 | 0.55mi |
| 3562 Kirby Dr Houston, TX | 1.0 | 1.0 | 636 | $1,229 | $1.93 | 11d | 1 | 0.56mi |
| 3660 Richmond Ave Houston, TX | 1.0–2.0 | 1.0–2.0 | 1084 | $1,248 | $1.15 | 2d | 19 | 0.58mi |
| 2440 North Blvd Houston, TX | 1.0 | 1.0 | 719 | $1,349 | $1.87 | 1d | 7 | 0.60mi |
| 3400 Edloe St Houston, TX | 1.0 | 1.0 | 650 | $1,098 | $1.69 | 1d | 7 | 0.67mi |
| 3833 Cummins St Houston, TX | 2.0 | 1.0–2.0 | 1161 | $1,889 | $1.63 | 3d | 23 | 0.68mi |
| 2300 Richmond Ave Houston, TX | 1.0–2.0 | 1.0–2.0 | 952 | $1,717 | $1.80 | 1d | 27 | 0.75mi |
| 2322 Richton St Unit 15 Houston, TX | 1.0 | 1.0 | 600 | $975 | $1.62 | 7d | 1 | 0.75mi |
| 2328 Richton St Houston, TX | 1.0 | 1.0 | 750 | $1,149 | $1.53 | 43d | 1 | 0.75mi |
| 4100 Greenbriar Dr Unit 147 Houston, TX | 1.0 | 1.0 | 569 | $1,269 | $2.23 | 2d | 1 | 0.76mi |
| 4100 Greenbriar Dr Unit 4121 Houston, TX | 1.0 | 1.0 | 619 | $1,265 | $2.04 | 13d | 1 | 0.76mi |
| 4100 Greenbriar Dr Unit 4142 Houston, TX | 1.0 | 1.0 | 569 | $1,269 | $2.23 | 10d | 1 | 0.76mi |
| 4100 Greenbriar Dr Unit 4115 Houston, TX | 1.0 | 1.0 | 704 | $1,479 | $2.10 | 10d | 1 | 0.76mi |
| 4100 Greenbriar Dr Apt 323 Houston, TX | 1.0 | 1.0 | 704 | $1,440 | $2.05 | 7d | 1 | 0.76mi |
| 4100 Greenbriar Dr Unit 112 Houston, TX | 1.0 | 1.0 | 569 | $1,237 | $2.17 | 2d | 1 | 0.76mi |
| 4100 Greenbriar Dr Houston, TX | 1.0 | 1.0 | 619 | $1,260 | $2.04 | 13d | 1 | 0.76mi |
| 4100 Greenbriar Dr Unit 1162 Houston, TX | 1.0 | 1.0 | 704 | $1,440 | $2.05 | 5d | 1 | 0.78mi |
| 4100 Greenbriar Dr Unit 1187 Houston, TX | 1.0 | 1.0 | 704 | $1,437 | $2.04 | 2d | 1 | 0.78mi |
| 3411 Cummins St Houston, TX | 1.0–2.0 | 1.0–2.0 | 1560 | $1,219 | $0.78 | 2d | 14 | 0.78mi |
| 3131 Timmons Ln Houston, TX | 1.0 | 1.0 | 651 | $1,481 | $2.27 | 24d | 1 | 0.79mi |
| 3510 W Alabama St Houston, TX | 1.0 | 1.0 | 744 | $1,462 | $1.97 | 10d | 1 | 0.80mi |
| 3131 Timmons Ln Unit 148 Houston, TX | 1.0 | 1.0 | 569 | $1,304 | $2.29 | 2d | 1 | 0.80mi |
| 3131 Timmons Ln Unit 324 Houston, TX | 1.0 | 1.0 | 650 | $1,511 | $2.32 | 7d | 1 | 0.80mi |
| 3131 Timmons Ln Unit 3173 Houston, TX | 1.0 | 1.0 | 569 | $1,347 | $2.37 | 11d | 1 | 0.80mi |
| 3131 Timmons Ln Unit 1174 Houston, TX | 1.0 | 1.0 | 650 | $1,500 | $2.31 | 12d | 1 | 0.80mi |
| 3131 Timmons Ln Unit 3146 Houston, TX | 1.0 | 1.0 | 650 | $1,550 | $2.38 | 10d | 1 | 0.80mi |
| 3131 Timmons Ln Unit 3146 Houston, TX | 1.0 | 1.0 | 650 | $1,593 | $2.45 | 13d | 1 | 0.80mi |
| 3131 Timmons Ln Unit 174 Houston, TX | 1.0 | 1.0 | 569 | $1,336 | $2.35 | 10d | 1 | 0.80mi |
| 3131 Timmons Ln Unit 1148 Houston, TX | 1.0 | 1.0 | 650 | $1,508 | $2.32 | 2d | 1 | 0.80mi |
| 2936 Kirby Dr Houston, TX | 1.0 | 1.0 | 688 | $2,126 | $3.09 | 43d | 1 | 0.83mi |
| 3810 Law St Houston, TX | 1.0–2.0 | 1.0–2.0 | 1002 | $1,663 | $1.66 | 2d | 10 | 0.84mi |
| 3333 Cummins St Houston, TX | 1.0 | 1.0 | 537 | $1,013 | $1.89 | 12d | 1 | 0.85mi |
HOA detail condo
- Monthly dues
- $500 · $6,000/yr
- Likely covers
- pool
- Assessments
- None detected in remarks — confirm with the listing agent.
Listing history 9 events
-
2026-06-10days on market $110,000 Pending 133 DOM
-
2026-06-08days on market $110,000 Pending 132 DOM
-
2026-06-07days on market $110,000 Pending 131 DOM
-
2026-06-04statusdays on market $110,000 Pending 128 DOM
-
2026-06-01days on market $110,000 Active 125 DOM
-
2026-05-31days on market $110,000 Active 124 DOM
-
2026-01-27$110,000 Active 480-char remark
Show marketing remark (480 chars)
Incredible find in the middle of everything. Nothing like it in the inner loop. This upstairs end unit is move in ready .Engineered hardwoods through out. Kitchen has been completely remolded with customs cabinets, granite counter tops, and SS appliances. Plenty of work space and storage. Walk in closet in primary bedroom complete with a full size washer dryer. One covered parking space with plenty of guest parking. Courtyard location overlooking a sparkling pool.
-
2014-02-24soldstatus
-
1997-07-08soldstatus
ⓘ Source: listings_history table (triggers on properties + properties_extension) + one-shot
backfill from property_details.listing_events for pre-trigger history.
Tax reassessment forecast TX · Resets to sale price
- Current annual tax
- $2,025 · $169/mo
- Projected year-2 tax
- $2,025 · $169/mo
- Expected delta
- $0/yr ($0/mo · -0.0%)
ⓘ Screening estimate from a state-policy table — verify with the county assessor before closing.
Climate risk First Street
- Flood 6/10 Major FEMA zone X (unshaded) · 71% chance over 30 yrs
- Wildfire 1/10 Low
- Heat 9/10 Extreme 7 d/yr ≥109°F today · 24 d/yr by 30 yrs out
- Wind 9/10 Extreme 99% chance of damaging wind over 30 yrs
- Air quality 2/10 Low 2 unhealthy d/yr today · 2 by 30 yrs out
Nearby sold comps map
Loading sold comps map…
Walkable amenities ~0.75 mi
Loading nearby amenities…
Taxation est. · year 1
- Rental income
- $17,234
- − Mortgage interest
- −$6,162
- − Property taxes
- −$2,025
- − Insurance
- −$550
- − Repairs & maintenance
- −$1,379
- − Management
- −$1,379
- − HOA
- −$6,000
- − Depreciation
- −$3,200
- Taxable loss
- −$3,461
- Est. tax savings @ 24.0%
- +$831
- After-tax cash flow
- $-1,052/yr
For passive investors: Depreciation is non-cash, so a rental often shows a tax loss while cash-flowing — sheltering income. Rental losses are passive: they offset passive income freely, and up to $25,000/yr can offset ordinary (W-2) income if you actively participate and your MAGI is under $100k (phasing out to $0 by $150k); unused losses carry forward. On sale, claimed depreciation is recaptured at up to 25%, and gains may owe capital-gains tax (a 1031 exchange can defer both). Figures are a year-1 estimate at your 24.0% rate — not tax advice; consult a CPA.
Schools (NCES district)
- District
- Houston ISD
- NCES district ID
- 4823640
- Math proficiency
- 27% ▼ -18.00%
- Reading proficiency
- 35% ▼ -6.00%
- Median HH income
- $46,054
- Composite
- 26.63/100
- National rank
- #7173
- State rank
- #593 of 826 in TX
Livability — Houston
- Score
- 74/100
- State rank
- #184
- US rank
- #4771
Category grades
Schools grade is shown separately in the Schools card above.
Census & demographics
- Census place
- Houston, TX
- County
- Harris County · 4,702,590 people
- City population
- 3,226,434
- Metro
- Houston-The Woodlands-Sugar Land, TX
- Population (ZIP)
- 17,210
- Household income
- $116,650
- Rent vs Own
- Severe rent burden
- 1069.0
Population outlook (Harris County) Hauer SSP2
- Today (2025)
- 5,571,493 people
- By 2030
- 6,089,821 · +9.3%
- By 2040
- 7,142,806 · +28.2%
- By 2050
- 8,185,864 · +46.9%
- By 2075
- 10,574,329 · +89.8%
- By 2100
- 12,109,958 · +117.4%
Race, ethnicity, and origin ACS 2023
- Neighborhood character
- Diverse neighborhood (Simpson 0.57)
- Race & ethnicity
- White 63% Hispanic / Latino 15% Asian 12% Two or more races 12% Black 6% Native American 2%
- Hispanic origin (detail)
- Mexican 9%
- Common ancestry
- Lithuanian 7% Romanian 5% Iranian 3%
- Foreign-born
- 21% · Canada, China, South Korea
- Languages at home
- 74% English-only · Spanish 9% Chinese 4% Other Asian/Pacific 3%
Political lean MEDSL · Harris
- 2024 margin
- Lean D (+5.5) · D 52.0% · R 46.4% · Other 1.6%
- 2008→2024 swing
- +3.9pp toward D · 2008: 1.6pp · 2024: 5.5pp
- All cycles
- 2024: D+5.5 2020: D+13.3 2016: D+12.4 2012: D+0.1 2008: D+1.6
Not yet ingested
- Civics
- —
Market trends
- HPI YoY
- ▼ -132.17%
- Current HPI
- 219.3437
- Rent YoY
- ▼ -1.13%
- Metro
- Houston-The Woodlands-Sugar Land, TX
- State GDP YoY
- ▲ 3.95%
- F500 in state
- 110
Industry mix (Fortune 500 HQ in TX)
| Industry | F500 HQs | Revenue |
|---|---|---|
| Energy | 16 | $1,198B |
|
||
| Technology | 5 | $198B |
|
||
| Engineering / Construction | 4 | $72B |
|
||
| Energy Services | 3 | $60B |
|
||
| Utilities | 3 | $41B |
|
||
| Healthcare | 2 | $330B |
|
||
Price history
3 events — show timeline
- 2026-01-27 Listed $110,000 HARMLS
- 2014-02-24 Sold (Public Records) — Public Records
- 1997-07-08 Sold (Public Records) — Public Records
Property tax history
+2.0%/yrLatest (2025): $2,025 · +1.6% YoY. Source: county tax records.
Cash-flow waterfall
monthlySold comps — $/sqft
last 12 mo · ≤1 miLoading sold comps…