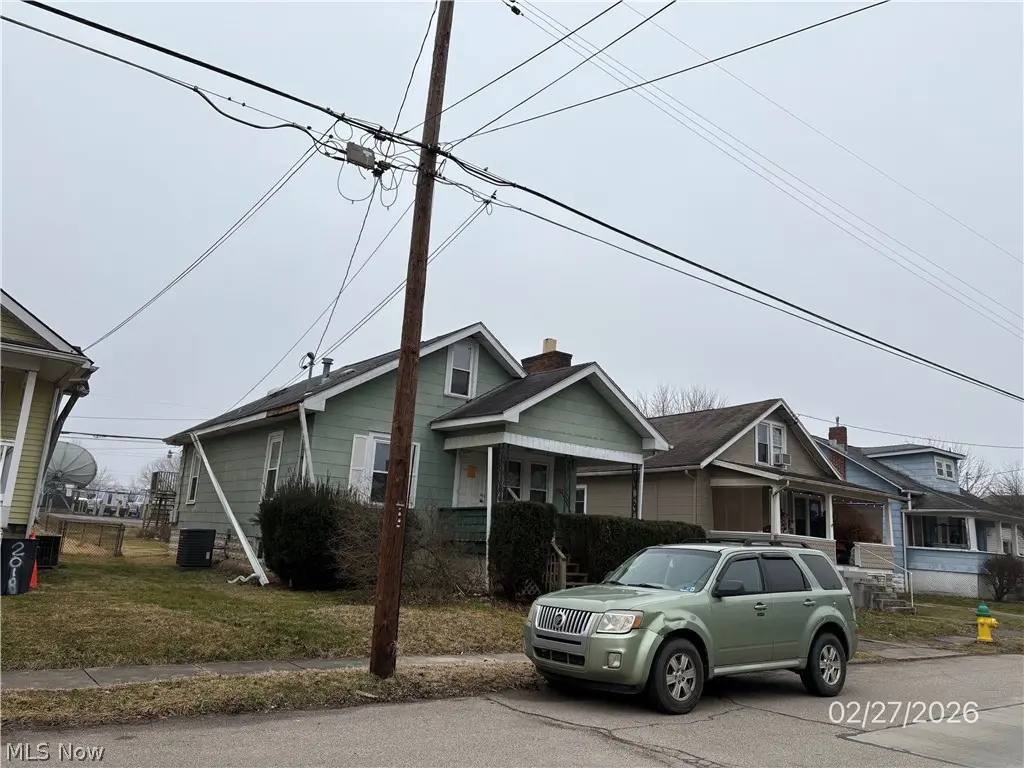
2016 16th St · Parkersburg, WV
Flood risk No data
- FEMA flood zone
- —
- Chance of flooding over 30 yrs
- —
- Est. flood insurance / yr
- —
Fire risk No data
- Est. fire insurance / yr
- —
Heat risk No data
- Hot days now (above threshold)
- —
- Hot days in 30 yrs
- —
Wind risk No data
- Chance of severe wind over 30 yrs
- —
Air-quality risk No data
- Unhealthy air days now
- —
- Unhealthy air days in 30 yrs
- —
Risk factors via First Street. Map © Google.
Why this score? — see what drove the B- grade
The composite is a weighted blend of 9 inputs, each scored 0–100. Each bar is that input's sub-score; the figure is the points it added to the 100-point composite (weight × sub-score).
- Cash flow +30.0/30.0
- 1% rule +10.0/10.0
- DSCR +10.0/10.0
- ARV discount +7.5/15.0
- Schools +3.6/10.0
- Livability +3.6/5.0
- Rent growth +2.5/5.0
- Condition / age +2.5/5.0
- Appreciation +0.0/10.0
$75,500
🖨 Deal sheet 📄 Offer letter ✓ Due diligence
Listing remarks
Home is in a convenient location, only blocks from the city park and many local conveniences. Alley access to property. Is being sold as occupied. Please do not bother the occupants. The sale of the property is made on an "AS IS", "Where is", and "with all Faults" basis, and seller makes n o warranty or representation express or implied, or arising by operation of law, including, but not limited tom any warranty of condition, title, habitability, merchantability or fitness for a particular purpose with respect to the property or any portion thereof.
Key facts
- Alley access
- City park
- Convenient location
Tags
Property features AI
Exterior
- Parking: Driveway
- Utilities: Public water; Public sewer
- Home design: Single-family property; 1,836 above-grade finished area
- Construction: Asphalt roof; Asbestos construction material; Built (year per assessor)
- Exterior features: Public water; Public sewer
Interior
- Bedrooms: One main-level bedroom
- Bathrooms: Three full bathrooms; Two main-level bathrooms
- Heating & cooling: Central air conditioning; Forced air heating
- Interior features: Unfinished basement; One fireplace; Total of 8 rooms
Neighborhood map
What this means for you Summary
Snapshot
- This is a 3-bed/2.0-bath single-family listed at $76k.
Deal economics
- At list price, monthly cash flow is $420 ($5k/yr) — positive.
- The deal already cash-flows at list — no discount required.
- Meets the 1% rule at list price ($1k rent vs $76k).
- Recommended offer: $71k (6.0% below list) — sets the bar for market timing.
- Cap rate 13.0% vs local median 5.6% in Parkersburg — top-decile yield for the area; either an underpriced asset or a hidden risk that comps aren't pricing in. Stress-test before assuming the spread holds.
Location & tenants
- Location reads 72/100 on livability (#46 in WV) — a middle-class / working-renter tenant base. Strengths: cost of living A+, housing A+, health & safety A+; Watch: crime D+, schools F, commute F.
- Wood County Schools (urban): math 38% / reading 48% proficiency, ranked #3 of 55 in WV (top 6%) — families likely to look elsewhere, expect single-tenant / working-renter base with shorter leases.
- Market conditions: 149 active listings in the ZIP; 124 units permitted in Wood County in 2024 (33 in 5+ unit buildings).
Forward outlook
- Local home prices are declining (-3.0%/yr); year-one equity from $522 of loan paydown is wiped out by about $2k of value loss. Plan a longer hold.
- Wood County population projected at -13% by 2050 — secular population decline; favor cash flow + early exit over multi-decade hold.
- At projected returns (-3.0% appreciation + 3.0% rent growth), your $21k cash investment doubles in ~6 years — after that, you're playing with house money.
Negotiation context
- It's been on market 85 days — a 6% lower offer ($71k) is reasonable based on typical stale-listing flexibility.
- Current owner paid $45k; list at $76k implies a 68% gain — meaningful room to come down on a strong offer.
Risks & watch-outs
- Watch-outs: built in 1927 — expect roof / HVAC / electrical / plumbing capex.
Questions for the listing agent
- It's been on market 85 days. Have you received any prior offers? Is the seller open to a 6% concession, seller financing, or rate buy-down credit?
- Built in 1927 — when were the roof, HVAC, electrical panel, plumbing, and water heater last replaced?
- Why hasn't it sold? Are there any deal-killer items the seller is aware of (foundation, flood, title, zoning, code violations)?
- Is there a deadline driving the sale (1031 exchange, divorce, estate, relocation)? That informs how much negotiation room exists.
- Schools are F-rated, which usually means shorter tenancies and higher turnover. Who's the typical renter profile here, and what's been the actual vacancy rate?
- Crime grade is D in this area — have there been break-ins, vandalism, or insurance claims at this property in the last 3 years? What carrier currently insures it and at what premium?
- What's the average days-on-market for RENTAL listings here right now (not sales)? A rising rental-DOM trend means longer vacancies and softer asking-rent achievability than the comps imply.
- What's the recent tenant-quality profile in this submarket — average credit score on applications, eviction rate, late-payment / NSF rate, and stable-employment percentage? A property-management company in the area should have these aggregated.
- How much new for-sale + rental construction is in the pipeline within 1–3 miles? Heavy new supply typically softens prices + rents 12–24 months out; constrained supply supports both.
Investment metrics
- 1% rule
- 1.50% ✓
- Cap rate
- 12.96%
- Cash-on-cash
- 23.81%
- DSCR
- 2.06
- GRM
- 5.6
CMA / ARV
- ARV (on-the-fly)
- $157,296
- Comps found
- 12
Show comp detail 12 sales within ~0.75 mi
| Address | Dist | Beds/Ba | Sqft | Sold | Price | $/sf | Match |
|---|---|---|---|---|---|---|---|
| 2207 17th St | 0.28mi | 3/1.0 | 1,344 (-1%) | 4mo | $137,000 | $102 | 78 |
| 616 Eastlawn Ave | 0.24mi | 3/2.0 | 1,300 (-4%) | 8mo | $128,000 | $98 | 75 |
| 2141 16th St | 0.20mi | 3/1.0 | 1,276 (-6%) | 8mo | $120,000 | $94 | 70 |
| 1611 15th St | 0.26mi | 3/1.0 | 1,288 (-5%) | 8mo | $185,000 | $144 | 69 |
| 2325 Broad St | 0.56mi | 3/2.0 | 1,376 (+2%) | 4mo | $189,900 | $138 | 68 |
| 1803 18th St | 0.14mi | 2/1.0 (-1) | 1,200 (-12%) | 3mo | $120,000 | $100 | 63 |
| 2602 Morningside Ave | 0.69mi | 3/1.0 | 1,334 (-2%) | 1mo | $150,000 | $112 | 60 |
| 1608 15th St | 0.29mi | 3/1.0 | 1,232 (-9%) | 9mo | $165,000 | $134 | 60 |
| 1426 23rd St | 0.71mi | 3/1.5 | 1,400 (+3%) | 4mo | $166,500 | $119 | 57 |
| 1027 32nd St | 0.69mi | 3/1.5 | 1,452 (+7%) | 0mo | $200,500 | $138 | 54 |
| 2608 Liberty St | 0.74mi | 3/1.5 | 1,248 (-8%) | 3mo | $127,000 | $102 | 48 |
| 2417 Morningside Ave | 0.66mi | 2/1.0 (-1) | 1,229 (-9%) | 0mo | $143,000 | $116 | 44 |
Match score weights: distance 35% · size 25% · config 20% · recency 20%. Top-matched comps best support the ARV.
Projected returns pro-forma
-3.0% appreciation · 3.0% rent growth · sell at horizon
- IRR
- 17.0%
- Equity multiple
- 1.68×
- Total profit
- $14,474
- Equity at exit
- $11,257
- IRR
- 25.5%
- Equity multiple
- 3.22×
- Total profit
- $46,961
- Equity at exit
- $6,528
Cash invested: $21,140 (down + closing). Projections, not guarantees.
Landlord ↔ Tenant lean methodology
- Overall (STATE)
- 83 Strongly Landlord-Friendly
- State West Virginia
- 83 Strongly Landlord-Friendly · R+22
- County
- — inherits STATE
- City
- — inherits STATE
ZIP-level market 26101
- Home prices YoY
- -27.3%
- Active inventory
- 149
- Price-to-rent
- 5.6×
Monthly cashflow live
- Estimated rent
- $1,132 medium interval (Pro) →
- Mortgage (P&I)
- −$396
- Tax from tax record
- −$47 /mo · $567/yr
- Insurance
- −$31
- HOA
- −$0
- Vacancy / Maint / Mgmt
- −$238
- Net cashflow
- $420
Break-even live
Sensitivity live
| Price | -10% $462 | -5% $441 | +0% $420 | +5% $398 | +10% $377 |
|---|---|---|---|---|---|
| Rent | -10% $330 | -5% $375 | +0% $420 | +5% $464 | +10% $509 |
| Rate | -1.0pp $458 | -0.5pp $439 | base $420 | +0.5pp $400 | +1.0pp $380 |
UW: 25.0% down · 7.5% · 30yr · 1.5% tax · 5.0% vac · 8.0% maint · 8.0% mgmt
Financing live
Cash to close
- Down payment
- $18,875
- Closing costs
- $2,265
- Reserves months
- —
- Total cash needed
- —
Loan-product check · same deal, 3 products live
Conventional
25% down · 7.5% · 30yr
- Down + closing
- —
- Monthly P&I
- —
- Monthly cashflow
- —
- DSCR
- —
- Eligible?
- —
Personal DTI + credit; lowest rate.
DSCR
20% down · 8.5% · 30yr
- Down + closing
- —
- Monthly P&I
- —
- Monthly cashflow
- —
- DSCR
- —
- Eligible?
- —
No personal income docs; deal must DSCR.
Hard money
10% down · 12.0% · 12mo
- Down + closing
- —
- Monthly P&I
- —
- Monthly cashflow
- —
- DSCR
- —
- Eligible?
- —
Short-term bridge; refi at stabilization.
Listing history 17 events
-
2026-06-19days on market $75,500 Active 85 DOM
-
2026-06-18days on market $75,500 Active 84 DOM
-
2026-06-17price $75,500 Active 83 DOM
-
2026-06-17days on market $82,080 Active 83 DOM
-
2026-06-16days on market $82,080 Active 82 DOM
-
2026-06-15days on market $82,080 Active 81 DOM
-
2026-06-14days on market $82,080 Active 79 DOM
-
2026-06-12days on market $82,080 Active 78 DOM
-
2026-06-09days on market $82,080 Active 75 DOM
-
2026-06-08days on market $82,080 Active 74 DOM
-
2026-06-07days on market $82,080 Active 73 DOM
-
2026-06-01days on market $82,080 Active 70 DOM
-
2026-05-31days on market $82,080 Active 69 DOM
-
2026-05-30days on market $82,080 Active 68 DOM
-
2026-05-04price $82,080
-
2026-03-23$86,400 Active
-
1986-12-19soldstatus $45,000
ⓘ Source: listings_history table (triggers on properties + properties_extension) + one-shot
backfill from property_details.listing_events for pre-trigger history.
Tax reassessment forecast WV · Resets to sale price
- Current annual tax
- $567 · $47/mo
- Projected year-2 tax
- $567 · $47/mo
- Expected delta
- $0/yr ($0/mo · 0.0%)
ⓘ Screening estimate from a state-policy table — verify with the county assessor before closing.
Nearby sold comps map
Loading sold comps map…
Walkable amenities ~0.75 mi
Loading nearby amenities…
Taxation est. · year 1
- Rental income
- $13,583
- − Mortgage interest
- −$4,229
- − Property taxes
- −$567
- − Insurance
- −$378
- − Repairs & maintenance
- −$1,087
- − Management
- −$1,087
- − Depreciation
- −$2,196
- Taxable income
- $4,039
- Est. tax owed @ 24.0%
- −$969
- After-tax cash flow
- $4,065/yr
For passive investors: Depreciation is non-cash, so a rental often shows a tax loss while cash-flowing — sheltering income. Rental losses are passive: they offset passive income freely, and up to $25,000/yr can offset ordinary (W-2) income if you actively participate and your MAGI is under $100k (phasing out to $0 by $150k); unused losses carry forward. On sale, claimed depreciation is recaptured at up to 25%, and gains may owe capital-gains tax (a 1031 exchange can defer both). Figures are a year-1 estimate at your 24.0% rate — not tax advice; consult a CPA.
Schools (NCES district)
- District
- Wood County Schools
- NCES district ID
- 5401620
- Math proficiency
- 38% ▼ -10.00%
- Reading proficiency
- 48% ▼ -4.00%
- Median HH income
- $42,363
- Composite
- 36.22/100
- National rank
- #4728
- State rank
- #3 of 55 in WV
Livability — Parkersburg
- Score
- 72/100
- State rank
- #46
- US rank
- #5841
Category grades
Schools grade is shown separately in the Schools card above.
Census & demographics
- Census place
- Parkersburg, WV
- County
- Wood County · 44,810 people
- City population
- 44,810
- Metro
- Parkersburg-Vienna, WV
- Population (ZIP)
- 28,005
- Household income
- $48,710
- Rent vs Own
- Severe rent burden
- 723.0
Population outlook (Wood County) Hauer SSP2
- Today (2025)
- 84,304 people
- By 2030
- 82,420 · -2.2%
- By 2040
- 78,133 · -7.3%
- By 2050
- 73,639 · -12.7%
- By 2075
- 63,093 · -25.2%
- By 2100
- 50,461 · -40.1%
Race, ethnicity, and origin ACS 2023
- Neighborhood character
- Predominantly White (93%)
- Race & ethnicity
- White 93% Two or more races 3% Hispanic / Latino 2% Black 1%
- Common ancestry
- Serbian 2% Slovak 2% Lithuanian 1%
- Foreign-born
- 1%
Political lean MEDSL · Wood
- 2024 margin
- Solid R (+43.0) · D 27.6% · R 70.7% · Other 1.6%
- 2008→2024 swing
- -14.4pp toward R · 2008: -28.7pp · 2024: -43.0pp
- All cycles
- 2024: R+43.0 2020: R+42.0 2016: R+47.8 2012: R+32.5 2008: R+28.7
Not yet ingested
- Civics
- —
Market trends
- HPI YoY
- ▼ -76.52%
- Current HPI
- 203.4508
- Rent YoY
- —
- Metro
- Parkersburg-Vienna, WV
- State GDP YoY
- —
- F500 in state
- 0
Price history
+82.4% since first listed3 events — show timeline
- 2026-05-04 Price Changed $82,080 MLSNOW
- 2026-03-23 Listed $86,400 MLSNOW
- 1986-12-19 Sold (Public Records) $45,000 Public Records
Property tax history
+0.6%/yrLatest (2024): $567 · +11.7% YoY. Source: county tax records.
Cash-flow waterfall
monthlySold comps — $/sqft
last 12 mo · ≤1 miLoading sold comps…