 🏷️ Likely Rental
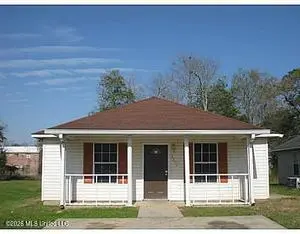
1104 Beach Ave · Gulfport, MS
Flood risk 6/10 · Moderate
- FEMA flood zone
- X (unshaded)
- Chance of flooding over 30 yrs
- 0.72%
- Est. flood insurance / yr
- $507 – $1,088
Fire risk 1/10 · Minimal
- Est. fire insurance / yr
- $1,241 – $2,305
Heat risk 10/10 · Severe
- Hot days now (above 106°F)
- 7 days/yr
- Hot days in 30 yrs
- 23 days/yr
Wind risk 9/10 · Severe
- Chance of severe wind over 30 yrs
- 99.0%
Air-quality risk 1/10 · Minimal
- Unhealthy air days now
- 0 days/yr
- Unhealthy air days in 30 yrs
- 0 days/yr
Risk factors via First Street. Map © Google.
Why this score? — see what drove the B+ grade
The composite is a weighted blend of 9 inputs, each scored 0–100. Each bar is that input's sub-score; the figure is the points it added to the 100-point composite (weight × sub-score).
- Cash flow +30.0/30.0
- ARV discount +15.0/15.0
- DSCR +10.0/10.0
- 1% rule +9.0/10.0
- Rent growth +5.0/5.0
- Livability +3.7/5.0
- Schools +3.4/10.0
- Condition / age +2.5/5.0
- Appreciation +0.0/10.0
$99,900
🖨 Deal sheet 📄 Offer letter ✓ Due diligence
Listing remarks MLS
Calling all investors who want an instant income producing property. Clean, recently remodeled 3 bedroom 2 full bath home with section 8 tenant that pays 1200 per month. Section 8 pays full amount.
Key facts
- 7,840 sq ft lot
- 2 parking spots
- Built 2000
Neighborhood map
What this means for you Summary
Snapshot
- This is a 3-bed/1.0-bath single-family listed at $100k.
Deal economics
- At list price, monthly cash flow is $451 ($5k/yr) — positive.
- The deal already cash-flows at list — no discount required.
- Meets the 1% rule at list price ($1k rent vs $100k).
- Recommended offer: $97k (3.0% below list) — sets the bar for market timing.
- Cap rate 11.7% vs local median 4.9% in Gulfport — top-decile yield for the area; either an underpriced asset or a hidden risk that comps aren't pricing in. Stress-test before assuming the spread holds.
Location & tenants
- Location reads 73/100 on livability (#15 in MS) — a middle-class / working-renter tenant base. Strengths: cost of living A+, housing A+, health & safety A+; Watch: schools D, amenities F, commute F.
- Gulfport School District (urban): math 41% / reading 42% proficiency, ranked #37 of 130 in MS (top 28%) — families likely to look elsewhere, expect single-tenant / working-renter base with shorter leases; 67% free/reduced lunch — lower-income household profile, screen leases tightly.
- Market conditions: Rents rising fast (+10.5%/yr); 252 active listings in the ZIP; 10 comparable units currently listed for rent nearby; rentals lingering (median 44d on market — plan ~5-8 weeks vacancy on turnover, expect pricing pressure); 60% of comp listings sitting > 30 days — soft ceiling on asking rent; lower-income renter base — watch delinquency; 2,194 units permitted in Harrison County in 2024 (0 in 5+ unit buildings).
- At $1,398/mo this rent would consume 48% of the median local household income ($35k/yr) (locally 1516% of renters already pay >50% of income on rent) — very limited rent-growth headroom before tenants either downsize or default.
Forward outlook
- Local home prices are declining (-3.0%/yr); year-one equity from $691 of loan paydown is wiped out by about $3k of value loss. Plan a longer hold.
- Harrison County population projected at +27% by 2050 — long-run rental-demand tailwind backs the buy-and-hold thesis.
- At projected returns (-3.0% appreciation + 8.0% rent growth), your $28k cash investment doubles in ~5 years — after that, you're playing with house money.
Negotiation context
- It's been on market 41 days — a 3% lower offer ($97k) is reasonable based on typical stale-listing flexibility.
- 4 sale attempts since 13y ago; this cycle's ask has dropped $25k (20%) from the opening price — seller is motivated, your offer sets the floor, not the list.
- Current owner paid $18k; list at $100k implies a 440% gain — meaningful room to come down on a strong offer.
Risks & watch-outs
- Climate carrying-cost: major flood risk; severe wind risk, 99% chance of damaging wind over 30y; extreme-heat days projected 7→23/yr by 2055 (HVAC capex compounding) — expect insurance premiums to compound above CPI over the hold.
Questions for the listing agent
- It's been on market 41 days. Have you received any prior offers? Is the seller open to a 3% concession, seller financing, or rate buy-down credit?
- Is there a deadline driving the sale (1031 exchange, divorce, estate, relocation)? That informs how much negotiation room exists.
- Schools are D-rated, which usually means shorter tenancies and higher turnover. Who's the typical renter profile here, and what's been the actual vacancy rate?
- What's the average days-on-market for RENTAL listings here right now (not sales)? A rising rental-DOM trend means longer vacancies and softer asking-rent achievability than the comps imply.
- What's the recent tenant-quality profile in this submarket — average credit score on applications, eviction rate, late-payment / NSF rate, and stable-employment percentage? A property-management company in the area should have these aggregated.
- How much new for-sale + rental construction is in the pipeline within 1–3 miles? Heavy new supply typically softens prices + rents 12–24 months out; constrained supply supports both.
Investment metrics
- 1% rule
- 1.40% ✓
- Cap rate
- 11.71%
- Cash-on-cash
- 19.35%
- DSCR
- 1.86
- GRM
- 6.0
CMA / ARV
- ARV (median comp)
- $158,964
- List price
- $99,900
- Delta
- -37.16%
- Verdict
- UNDERPRICED
- Comps
- 20 within 1.0 mi
Show comp detail 12 sales within ~0.75 mi
| Address | Dist | Beds/Ba | Sqft | Sold | Price | $/sf | Match |
|---|---|---|---|---|---|---|---|
| 1015 Joseph Ave | 0.11mi | 3/1.0 | 1,161 (-2%) | 5mo | $139,000 | $120 | 87 |
| 801 Allendale Ave | 0.29mi | 2/1.0 (-1) | 1,110 (-7%) | 0mo | $165,000 | $149 | 70 |
| 721 Regnault Ave | 0.26mi | 2/2.0 (-1) | 1,100 (-8%) | 1mo | $269,000 | $245 | 66 |
| 1608 Lewis Ave | 0.51mi | 3/2.0 | 1,100 (-8%) | 0mo | $115,000 | $105 | 59 |
| 828 Woodward Ave | 0.38mi | 2/1.0 (-1) | 1,286 (+8%) | 5mo | $217,900 | $169 | 59 |
| 1523 Stewart Ave | 0.48mi | 3/2.0 | 1,127 (-5%) | 8mo | $160,000 | $142 | 58 |
| 4340 Betts Cir | 0.55mi | 3/1.5 | 1,305 (+10%) | 2mo | $129,900 | $100 | 54 |
| 1158 E Old Pass Rd | 0.63mi | 4/1.0 (+1) | 1,206 (+1%) | 13mo | $189,000 | $157 | 52 |
| 1601 Lewis Ave | 0.50mi | 4/2.0 (+1) | 1,300 (+9%) | 1mo | $145,000 | $112 | 52 |
| 811 Camp Ave | 0.47mi | 3/2.0 | 1,275 (+7%) | 14mo | $227,000 | $178 | 50 |
| 5200 W Beach Blvd | 0.45mi | 2/2.0 (-1) | 1,312 (+10%) | 3mo | $550,000 | $419 | 50 |
| 1710 62nd Ave | 0.64mi | 3/2.0 | 1,315 (+11%) | 9mo | $169,400 | $129 | 41 |
Match score weights: distance 35% · size 25% · config 20% · recency 20%. Top-matched comps best support the ARV.
Projected returns pro-forma
-3.0% appreciation · 8.0% rent growth · sell at horizon
- IRR
- 16.7%
- Equity multiple
- 1.71×
- Total profit
- $19,929
- Equity at exit
- $14,895
- IRR
- 28.5%
- Equity multiple
- 4.15×
- Total profit
- $87,976
- Equity at exit
- $8,638
Cash invested: $27,972 (down + closing). Projections, not guarantees.
Landlord ↔ Tenant lean methodology
- Overall (STATE)
- 90 Strongly Landlord-Friendly
- State Mississippi
- 90 Strongly Landlord-Friendly · R+11
- County
- — inherits STATE
- City
- — inherits STATE
ZIP-level market 39501
- Home prices YoY
- -34.5%
- Rents YoY
- 10.5%
- Active inventory
- 252
- Price-to-rent
- 6.0×
Monthly cashflow live
- Estimated rent
- $1,398 high interval (Pro) →
- Mortgage (P&I)
- −$524
- Tax from tax record
- −$88 /mo · $1,057/yr
- Insurance
- −$42
- HOA
- −$0
- Vacancy / Maint / Mgmt
- −$294
- Net cashflow
- $451
Break-even live
UW: 25.0% down · 7.5% · 30yr · 1.5% tax · 5.0% vac · 8.0% maint · 8.0% mgmt
Financing live
Cash to close
- Down payment
- $24,975
- Closing costs
- $2,997
- Reserves months
- —
- Total cash needed
- —
Loan-product check · same deal, 3 products live
Conventional
25% down · 7.5% · 30yr
- Down + closing
- —
- Monthly P&I
- —
- Monthly cashflow
- —
- DSCR
- —
- Eligible?
- —
Personal DTI + credit; lowest rate.
DSCR
20% down · 8.5% · 30yr
- Down + closing
- —
- Monthly P&I
- —
- Monthly cashflow
- —
- DSCR
- —
- Eligible?
- —
No personal income docs; deal must DSCR.
Hard money
10% down · 12.0% · 12mo
- Down + closing
- —
- Monthly P&I
- —
- Monthly cashflow
- —
- DSCR
- —
- Eligible?
- —
Short-term bridge; refi at stabilization.
Rent comps 10 comps
| Address | Beds | Baths | Sqft | Rent | $/sqft | DOM | Units | Dist |
|---|---|---|---|---|---|---|---|---|
| 1206 Beach Ave Gulfport, MS | 3.0 | 2.0 | 1076 | $1,500 | $1.39 | 14d | 1 | 0.07mi |
| 1412 Jo Ellen Cir Gulfport, MS | 3.0 | 1.5 | 1275 | $1,050 | $0.82 | 14d | 1 | 0.31mi |
| 4409 Ford St Gulfport, MS | 2.0 | 1.0 | 1000 | $1,500 | $1.50 | 44d | 1 | 0.52mi |
| 4319 Lewis St Gulfport, MS | 3.0 | 2.0 | 1371 | $1,649 | $1.20 | 14d | 1 | 0.56mi |
| 1221 42nd Ave Gulfport, MS | 3.0 | 1.0 | 1000 | $1,400 | $1.40 | 44d | 1 | 0.80mi |
| 212 Lawler Ave Long Beach, MS | 2.0 | 1.0 | 822 | $1,250 | $1.52 | 14d | 1 | 0.98mi |
| 3633 Southward Dr Gulfport, MS | 2.0 | 2.0 | 900 | $1,000 | $1.11 | 44d | 1 | 1.17mi |
| 3305 12th St Gulfport, MS | 2.0 | 1.5 | 1100 | $1,295 | $1.18 | 44d | 1 | 1.35mi |
| 1513 34th Ave Gulfport, MS | 2.0 | 2.0 | 884 | $1,250 | $1.41 | 44d | 1 | 1.38mi |
| 1106 32nd Ave Gulfport, MS | 3.0 | 2.0 | 1200 | $1,300 | $1.08 | 44d | 1 | 1.46mi |
Listing history 8 events
-
2026-04-16status Active 197-char remark
Show marketing remark (197 chars)
Calling all investors who want an instant income producing property. Clean, recently remodeled 3 bedroom 2 full bath home with section 8 tenant that pays 1200 per month. Section 8 pays full amount.
-
2026-04-05$124,900 Active 197-char remark
Show marketing remark (197 chars)
Calling all investors who want an instant income producing property. Clean, recently remodeled 3 bedroom 2 full bath home with section 8 tenant that pays 1200 per month. Section 8 pays full amount.
-
2026-04-05historical 197-char remark
Show marketing remark (197 chars)
Calling all investors who want an instant income producing property. Clean, recently remodeled 3 bedroom 2 full bath home with section 8 tenant that pays 1200 per month. Section 8 pays full amount.
-
2021-10-01historical
-
2014-07-02soldstatus $18,500
-
2014-06-30soldstatus
-
2014-04-11$25,200
-
2013-05-24$48,500
ⓘ Source: listings_history table (triggers on properties + properties_extension) + one-shot
backfill from property_details.listing_events for pre-trigger history.
Tax reassessment forecast MS · Resets to sale price
- Current annual tax
- $1,057 · $88/mo
- Projected year-2 tax
- $1,057 · $88/mo
- Expected delta
- $0/yr ($0/mo · 0.0%)
ⓘ Screening estimate from a state-policy table — verify with the county assessor before closing.
Climate risk First Street
- Flood 6/10 Major FEMA zone X (unshaded) · 72% chance over 30 yrs
- Wildfire 1/10 Low
- Heat 10/10 Extreme 7 d/yr ≥106°F today · 23 d/yr by 30 yrs out
- Wind 9/10 Extreme 99% chance of damaging wind over 30 yrs
- Air quality 1/10 Low 0 unhealthy d/yr today · 0 by 30 yrs out
Nearby sold comps map
Loading sold comps map…
Walkable amenities ~0.75 mi
Loading nearby amenities…
Taxation est. · year 1
- Rental income
- $16,780
- − Mortgage interest
- −$5,596
- − Property taxes
- −$1,057
- − Insurance
- −$500
- − Repairs & maintenance
- −$1,342
- − Management
- −$1,342
- − Depreciation
- −$2,906
- Taxable income
- $4,036
- Est. tax owed @ 24.0%
- −$969
- After-tax cash flow
- $4,444/yr
For passive investors: Depreciation is non-cash, so a rental often shows a tax loss while cash-flowing — sheltering income. Rental losses are passive: they offset passive income freely, and up to $25,000/yr can offset ordinary (W-2) income if you actively participate and your MAGI is under $100k (phasing out to $0 by $150k); unused losses carry forward. On sale, claimed depreciation is recaptured at up to 25%, and gains may owe capital-gains tax (a 1031 exchange can defer both). Figures are a year-1 estimate at your 24.0% rate — not tax advice; consult a CPA.
Schools (NCES district)
- District
- Gulfport School District
- NCES district ID
- 2801710
- Math proficiency
- 41% ▼ -15.00%
- Reading proficiency
- 42% ▼ -6.00%
- Median HH income
- $35,712
- Composite
- 34.38/100
- National rank
- #5213
- State rank
- #37 of 130 in MS
Livability — Gulfport
- Score
- 73/100
- State rank
- #15
- US rank
- #5010
Category grades
Schools grade is shown separately in the Schools card above.
Census & demographics
- Census place
- Gulfport, MS
- County
- Harrison County · 178,171 people
- City population
- 96,188
- Metro
- Gulfport-Biloxi, MS
- Population (ZIP)
- 22,565
- Household income
- $34,758
- Rent vs Own
- Severe rent burden
- 1516.0
Population outlook (Harrison County) Hauer SSP2
- Today (2025)
- 228,444 people
- By 2030
- 241,942 · +5.9%
- By 2040
- 267,531 · +17.1%
- By 2050
- 291,062 · +27.4%
- By 2075
- 346,711 · +51.8%
- By 2100
- 378,165 · +65.5%
Race, ethnicity, and origin ACS 2023
- Neighborhood character
- Diverse neighborhood (Simpson 0.56)
- Race & ethnicity
- Black 59% White 29% Two or more races 7% Hispanic / Latino 5%
- Hispanic origin (detail)
- Mexican 2%
- Common ancestry
- Lithuanian 2% Serbian 1% Slovak 1%
- Foreign-born
- 2% · Canada
- Languages at home
- 95% English-only · Spanish 4%
Political lean MEDSL · Harrison
- 2024 margin
- Strong R (+28.9) · D 35.0% · R 63.9% · Other 1.1%
- 2008→2024 swing
- -2.9pp toward R · 2008: -26.0pp · 2024: -28.9pp
- All cycles
- 2024: R+28.9 2020: R+25.2 2016: R+30.7 2012: R+26.6 2008: R+26.0
Not yet ingested
- Civics
- —
Market trends
- HPI YoY
- ▼ -110.16%
- Current HPI
- 208.998
- Rent YoY
- ▲ 10.49%
- Metro
- Gulfport-Biloxi, MS
- State GDP YoY
- —
- F500 in state
- 0
Price history
+157.5% since first listed8 events — show timeline
- 2026-04-16 Relisted — MLSU
- 2026-04-05 Listing Removed — MLSU
- 2026-04-05 Listed $124,900 MLSU
- 2021-10-01 Listing Removed — MLSU
- 2014-07-02 Sold (Public Records) $18,500 Public Records
- 2014-06-30 Sold (MLS) — MLSU
- 2014-04-11 Listed $25,200 MLSU
- 2013-05-24 Listed $48,500 MLSU
Property tax history
-1.5%/yrLatest (2025): $1,057 · +4.9% YoY. Source: county tax records.
Cash-flow waterfall
monthlySold comps — $/sqft
last 12 mo · ≤1 miLoading sold comps…