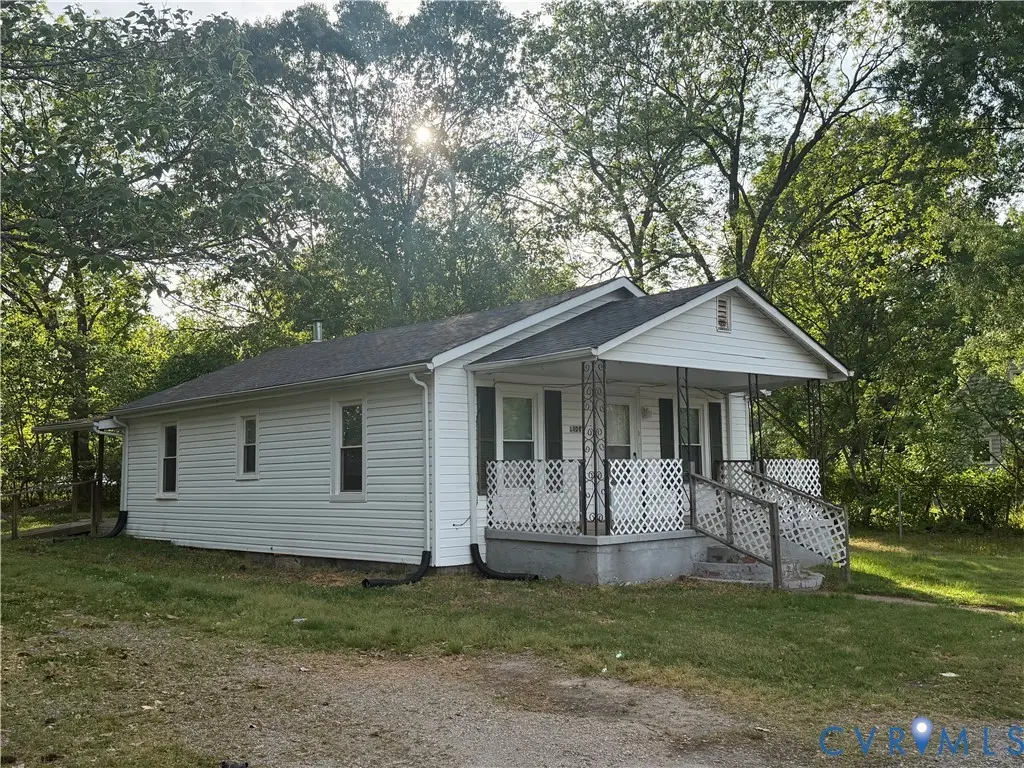
1308 Tabb Ave · Hopewell, VA
Flood risk 1/10 · Minimal
- FEMA flood zone
- X (unshaded)
- Chance of flooding over 30 yrs
- 0.0%
- Est. flood insurance / yr
- $507 – $1,088
Fire risk 1/10 · Minimal
- Est. fire insurance / yr
- $666 – $1,236
Heat risk 8/10 · Major
- Hot days now (above 110°F)
- 7 days/yr
- Hot days in 30 yrs
- 16 days/yr
Wind risk 6/10 · Moderate
- Chance of severe wind over 30 yrs
- 42.0%
Air-quality risk 2/10 · Minimal
- Unhealthy air days now
- 1 days/yr
- Unhealthy air days in 30 yrs
- 2 days/yr
Risk factors via First Street. Map © Google.
Why this score? — see what drove the B- grade
The composite is a weighted blend of 9 inputs, each scored 0–100. Each bar is that input's sub-score; the figure is the points it added to the 100-point composite (weight × sub-score).
- Cash flow +25.9/30.0
- ARV discount +15.0/15.0
- DSCR +8.7/10.0
- 1% rule +6.2/10.0
- Rent growth +4.7/5.0
- Livability +3.5/5.0
- Schools +3.0/10.0
- Condition / age +2.5/5.0
- Appreciation +0.0/10.0
$137,000
🖨 Deal sheet 📄 Offer letter ✓ Due diligence
Listing remarks
This 3-bedroom, 1-bath home sits on a spacious lot. Featuring a double driveway for ample parking, this property has been a solid rental for many years and is ready for its next chapter. Charming cottage-style ranch with tons of potential! With a little TLC, this home could truly shine—ideal for investors, first-time buyers, or anyone looking to add their personal touch. Cozy layout and endless opportunity to make it your own. Don’t miss your chance to unlock the potential in this hidden gem! Location is key, and this one delivers with easy access to I-95 and I-295, making commuting a breeze and putting shopping, dining, and local amenities just minutes away. Don’t m
Key facts
- Easy access to i-295
- Easy access to i-95
- Double driveway
Tags
Property features AI
Finance
- Other: Lot roughly 0.172 acres; Above-grade finished area recorded
Exterior
- Parking: Detached oversized garage
- Utilities: Public water; Public sewer; Electric power
- Home design: Single-story home; Resale property; Composition roof; Frame construction with drywall and vinyl siding; Zoned R2
- Construction: Built previously (actual year built recorded); Frame construction; Vinyl siding; Composition roof; Crawl space foundation
- Exterior features: Front and rear porches; Porch; Lighting; Storage; Shed; Outbuilding / other structure
Interior
- Kitchen: No specific appliances listed for kitchen
- Bedrooms: Includes bedroom on main level
- Flooring: Linoleum; Partially carpeted
- Bathrooms: 1 full bathroom
- Heating & cooling: Heat pump for heating; Electric heating; Heat pump cooling
- Interior features: Bedroom on the main level; Breakfast area
- Laundry & utility: Electric water heater
Neighborhood map
What this means for you Summary
Snapshot
- This is a 3-bed/1.0-bath single-family listed at $137k.
Deal economics
- At list price, monthly cash flow is $336 ($4k/yr) — positive.
- The deal already cash-flows at list — no discount required.
- Meets the 1% rule at list price ($2k rent vs $137k).
- Cap rate 9.2% vs local median 4.2% in Hopewell — top-decile yield for the area; either an underpriced asset or a hidden risk that comps aren't pricing in. Stress-test before assuming the spread holds.
Location & tenants
- Location reads 70/100 on livability (#224 in VA) — a middle-class / working-renter tenant base. Strengths: cost of living A+, health & safety A+, schools A-; Watch: crime D+, amenities F, commute F.
- Hopewell City Public School District (suburban): math 23% / reading 49% proficiency, ranked #129 of 131 in VA (top 98%) — families likely to look elsewhere, expect single-tenant / working-renter base with shorter leases; 68% free/reduced lunch — lower-income household profile, screen leases tightly.
- Market conditions: Rents rising fast (+8.9%/yr); 228 active listings in the ZIP; 24 comparable units currently listed for rent nearby; rentals at typical pace (median 21d on market — plan ~3-4 weeks tenant-placement turnaround); 42 units permitted in Hopewell city in 2024 (0 in 5+ unit buildings).
Forward outlook
- Local home prices are declining (-3.0%/yr); year-one equity from $947 of loan paydown is wiped out by about $4k of value loss. Plan a longer hold.
- Hopewell County population projected to shrink 7% by 2050 — rents likely to lag national; underwrite the cash flow, not the appreciation.
- At projected returns (-3.0% appreciation + 8.0% rent growth), your $38k cash investment doubles in ~8 years — after that, you're playing with house money.
Negotiation context
- Only 5 days on market — expect competitive offers; lowballing is unlikely to land.
- 12 sale attempts since 11y ago with the ask held roughly flat each time — persistent listings suggest the price (not the market) is what's stuck; bring a comps-based counter.
- Current owner paid $57k; list at $137k implies a 140% gain — meaningful room to come down on a strong offer.
Risks & watch-outs
- Watch-outs: built in 1948 — expect roof / HVAC / electrical / plumbing capex.
- Climate carrying-cost: major wind risk, 42% chance of damaging wind over 30y; extreme-heat days projected 7→16/yr by 2055 (HVAC capex compounding) — expect insurance premiums to compound above CPI over the hold.
Questions for the listing agent
- Built in 1948 — when were the roof, HVAC, electrical panel, plumbing, and water heater last replaced?
- Is there a deadline driving the sale (1031 exchange, divorce, estate, relocation)? That informs how much negotiation room exists.
- Schools are A-rated — typically a magnet for longer-tenancy family renters. What's the average tenant stay here, and is there a school-zone premium baked into asking?
- Crime grade is D in this area — have there been break-ins, vandalism, or insurance claims at this property in the last 3 years? What carrier currently insures it and at what premium?
- What's the average days-on-market for RENTAL listings here right now (not sales)? A rising rental-DOM trend means longer vacancies and softer asking-rent achievability than the comps imply.
- What's the recent tenant-quality profile in this submarket — average credit score on applications, eviction rate, late-payment / NSF rate, and stable-employment percentage? A property-management company in the area should have these aggregated.
- How much new for-sale + rental construction is in the pipeline within 1–3 miles? Heavy new supply typically softens prices + rents 12–24 months out; constrained supply supports both.
Investment metrics
- 1% rule
- 1.12% ✓
- Cap rate
- 9.24%
- Cash-on-cash
- 10.52%
- DSCR
- 1.47
- GRM
- 7.4
CMA / ARV
- ARV (on-the-fly)
- $238,680
- Comps found
- 12
Show comp detail 12 sales within ~0.75 mi
| Address | Dist | Beds/Ba | Sqft | Sold | Price | $/sf | Match |
|---|---|---|---|---|---|---|---|
| 1701 Arlington Rd | 0.22mi | 3/2.0 | 1,104 (-6%) | 2mo | $270,000 | $245 | 74 |
| 1702 Tabb Ave | 0.24mi | 3/1.5 | 1,264 (+8%) | 3mo | $225,000 | $178 | 71 |
| 3206 Elmwood Ave | 0.65mi | 3/1.5 | 1,170 (0%) | 1mo | $140,000 | $120 | 67 |
| 1105 Arlington Rd | 0.31mi | 3/2.0 | 1,080 (-8%) | 4mo | $219,950 | $204 | 65 |
| 3208 Granby St | 0.52mi | 2/1.5 (-1) | 1,094 (-6%) | 1mo | $220,000 | $201 | 58 |
| 1240 Maryville Ave | 0.32mi | 3/2.0 | 1,325 (+13%) | 4mo | $290,500 | $219 | 55 |
| 1104 Terrace Ave | 0.44mi | 3/2.0 | 1,028 (-12%) | 3mo | $177,500 | $173 | 53 |
| 2005 Dublin St | 0.50mi | 3/2.0 | 1,040 (-11%) | 4mo | $235,000 | $226 | 50 |
| 3213 Norfolk St | 0.72mi | 3/1.5 | 1,245 (+6%) | 4mo | $158,000 | $127 | 50 |
| 1800 New Lincoln Cir | 0.57mi | 3/2.0 | 1,324 (+13%) | 1mo | $250,000 | $189 | 46 |
| 3104 Saint Charles | 0.72mi | 3/2.0 | 1,315 (+12%) | 1mo | $305,000 | $232 | 41 |
| 1802 Freeman St | 0.71mi | 3/1.5 | 1,008 (-14%) | 4mo | $220,000 | $218 | 38 |
Match score weights: distance 35% · size 25% · config 20% · recency 20%. Top-matched comps best support the ARV.
Projected returns pro-forma
-3.0% appreciation · 8.0% rent growth · sell at horizon
- IRR
- 4.7%
- Equity multiple
- 1.19×
- Total profit
- $7,327
- Equity at exit
- $20,427
- IRR
- 18.2%
- Equity multiple
- 2.85×
- Total profit
- $70,904
- Equity at exit
- $11,845
Cash invested: $38,360 (down + closing). Projections, not guarantees.
Landlord ↔ Tenant lean methodology
- Overall (STATE)
- 55 Moderately Landlord-Leaning
- State Virginia
- 55 Moderately Landlord-Leaning · D+2
- County
- — inherits STATE
- City
- — inherits STATE
ZIP-level market 23860
- Home prices YoY
- -22.0%
- Rents YoY
- 8.9%
- Active inventory
- 228
- Price-to-rent
- 7.4×
Monthly cashflow live
- Estimated rent
- $1,539 high interval (Pro) →
- Mortgage (P&I)
- −$718
- Tax from tax record
- −$105 /mo · $1,254/yr
- Insurance
- −$57
- HOA
- −$0
- Vacancy / Maint / Mgmt
- −$323
- Net cashflow
- $336
Break-even live
UW: 25.0% down · 7.5% · 30yr · 1.5% tax · 5.0% vac · 8.0% maint · 8.0% mgmt
Financing live
Cash to close
- Down payment
- $34,250
- Closing costs
- $4,110
- Reserves months
- —
- Total cash needed
- —
Loan-product check · same deal, 3 products live
Conventional
25% down · 7.5% · 30yr
- Down + closing
- —
- Monthly P&I
- —
- Monthly cashflow
- —
- DSCR
- —
- Eligible?
- —
Personal DTI + credit; lowest rate.
DSCR
20% down · 8.5% · 30yr
- Down + closing
- —
- Monthly P&I
- —
- Monthly cashflow
- —
- DSCR
- —
- Eligible?
- —
No personal income docs; deal must DSCR.
Hard money
10% down · 12.0% · 12mo
- Down + closing
- —
- Monthly P&I
- —
- Monthly cashflow
- —
- DSCR
- —
- Eligible?
- —
Short-term bridge; refi at stabilization.
Rent comps 24 comps
| Address | Beds | Baths | Sqft | Rent | $/sqft | DOM | Units | Dist |
|---|---|---|---|---|---|---|---|---|
| 1206 Tabb Ave Hopewell, VA | 3.0 | 1.0 | 974 | $1,470 | $1.51 | 43d | 1 | 0.03mi |
| 1004 Sunnyside Ave Hopewell, VA | 4.0 | 2.0 | 875 | $1,737 | $1.99 | 4d | 1 | 0.23mi |
| 2303 Maclin Cir Hopewell, VA | 3.0 | 2.0 | 1150 | $1,499 | $1.30 | 3d | 1 | 0.39mi |
| 2305 Poplar St Unit B Hopewell, VA | 2.0 | 1.5 | 959 | $1,050 | $1.09 | 23d | 1 | 0.46mi |
| 1900 Arlington Rd Hopewell, VA | 3.0 | 2.0 | 1216 | $1,695 | $1.39 | 43d | 1 | 0.52mi |
| 3314 Granby St Hopewell, VA | 3.0 | 1.0 | 1469 | $1,600 | $1.09 | 23d | 1 | 0.63mi |
| 522 S 22nd Ave Hopewell, VA | 3.0 | 2.0 | 1368 | $1,800 | $1.32 | 23d | 1 | 0.63mi |
| 507 Hill Ave Hopewell, VA | 3.0 | 1.0 | 932 | $1,395 | $1.50 | 23d | 1 | 0.65mi |
| 552 S 22nd Ave Hopewell, VA | 3.0 | 2.0 | 1368 | $1,800 | $1.32 | 23d | 1 | 0.65mi |
| 3309 Carlisle Ave Hopewell, VA | 3.0 | 1.0 | 1152 | $1,395 | $1.21 | 21d | 1 | 0.67mi |
| 3200 Saint Charles St Hopewell, VA | 3.0 | 1.5 | 1272 | $1,595 | $1.25 | 43d | 1 | 0.74mi |
| 460 Highland Ave Hopewell, VA | 3.0 | 1.0 | 1212 | $1,700 | $1.40 | 19d | 1 | 0.77mi |
| 600 Winston Churchill Dr Hopewell, VA | 2.0 | 1.0 | 900 | $1,075 | $1.19 | 1d | 1 | 0.82mi |
| 800 Chestnut St Hopewell, VA | 2.0 | 1.0 | 884 | $1,395 | $1.58 | 43d | 1 | 0.83mi |
| 3500 Oaklawn Blvd Hopewell, VA | 3.0 | 1.0 | 1000 | $1,650 | $1.65 | 17d | 1 | 0.85mi |
| 3502 Oaklawn Blvd Hopewell, VA | 3.0 | 1.0 | 1124 | $1,850 | $1.65 | 21d | 1 | 0.85mi |
| 305 S 9th Ave Hopewell, VA | 4.0 | 1.0 | 1056 | $1,599 | $1.51 | 3d | 1 | 1.09mi |
| 221 S Mesa Dr Hopewell, VA | 3.0 | 1.0 | 1152 | $1,300 | $1.13 | 23d | 1 | 1.13mi |
| 3807 Woodlawn St Unit 8 Hopewell, VA | 2.0 | 1.0 | 900 | $1,095 | $1.22 | 4d | 1 | 1.17mi |
| 2009 Day St Hopewell, VA | 2.0 | 1.0 | 780 | $895 | $1.15 | 23d | 1 | 1.27mi |
| 1201 W City Point Rd Hopewell, VA | 1.0–2.0 | 1.0–1.5 | 710 | $1,250 | $1.76 | 14d | 3 | 1.31mi |
| 1201 W City Point Rd Hopewell, VA | 1.0–2.0 | 1.0–1.5 | 711 | $1,250 | $1.76 | 1d | 7 | 1.32mi |
| 3568 Perrins Hill Way Prince George, VA | 3.0 | 2.5 | 1500 | $2,200 | $1.47 | 1d | 1 | 1.35mi |
| 1208 W Broadway Hopewell, VA | 3.0 | 1.0 | 1200 | $1,495 | $1.25 | 16d | 1 | 1.45mi |
Listing history 50 events
-
2026-05-13status Pending 845-char remark
-
2026-05-11price $139,750 845-char remark
-
2026-05-08price $139,799 845-char remark
-
2026-05-04price $139,850 845-char remark
-
2026-05-02price $139,900 845-char remark
-
2026-04-29price $139,955 845-char remark
-
2026-04-28status Active 845-char remark
-
2026-04-23status Pending 845-char remark
-
2026-04-15$139,999 Active 845-char remark
-
2026-03-29historical
-
2026-03-27price $148,805
-
2026-03-23price $148,850
-
2026-03-20price $148,900
-
2026-03-16price $148,945
-
2026-03-13price $148,995
-
2026-03-11status Active
-
2026-03-09status Pending
-
2026-03-04price $149,505
-
2026-02-26price $149,555
-
2026-02-20price $149,999
-
2026-02-20$139,995 Active
-
2026-01-31historical
-
2026-01-27price $149,250
-
2026-01-25price $149,300
-
2026-01-20price $149,350
-
2026-01-16price $149,400
-
2026-01-13price $149,450
-
2026-01-09price $149,500
-
2026-01-02price $149,999
-
2025-12-27$154,500 Active
-
2025-12-15historical
-
2025-12-12price $154,750
-
2025-12-09price $154,800
-
2025-12-04price $154,850
-
2025-11-28price $154,900
-
2025-11-20price $154,949
-
2025-11-18status Active
-
2025-11-15historical
-
2025-11-14price $159,949
-
2025-10-29$159,999 Active
-
2025-10-27historical
-
2020-02-06soldstatus $57,000
-
2020-02-05soldstatus $57,000 Closed
-
2020-01-15status Pending
-
2020-01-15status Active
-
2020-01-13status Pending
-
2019-09-17$77,950 Active
-
2016-01-16historical
-
2015-09-16$71,400 Active
-
1996-02-16soldstatus $26,900
ⓘ Source: listings_history table (triggers on properties + properties_extension) + one-shot
backfill from property_details.listing_events for pre-trigger history.
Tax reassessment forecast VA · Resets to sale price
- Current annual tax
- $1,254 · $105/mo
- Projected year-2 tax
- $1,254 · $105/mo
- Expected delta
- $0/yr ($0/mo · 0.0%)
ⓘ Screening estimate from a state-policy table — verify with the county assessor before closing.
Climate risk First Street
- Flood 1/10 Low FEMA zone X (unshaded) · 0% chance over 30 yrs
- Wildfire 1/10 Low
- Heat 8/10 Severe 7 d/yr ≥110°F today · 16 d/yr by 30 yrs out
- Wind 6/10 Major 42% chance of damaging wind over 30 yrs
- Air quality 2/10 Low 1 unhealthy d/yr today · 2 by 30 yrs out
Nearby sold comps map
Loading sold comps map…
Walkable amenities ~0.75 mi
Loading nearby amenities…
Taxation est. · year 1
- Rental income
- $18,474
- − Mortgage interest
- −$7,674
- − Property taxes
- −$1,254
- − Insurance
- −$685
- − Repairs & maintenance
- −$1,478
- − Management
- −$1,478
- − Depreciation
- −$3,985
- Taxable income
- $1,919
- Est. tax owed @ 24.0%
- −$461
- After-tax cash flow
- $3,573/yr
For passive investors: Depreciation is non-cash, so a rental often shows a tax loss while cash-flowing — sheltering income. Rental losses are passive: they offset passive income freely, and up to $25,000/yr can offset ordinary (W-2) income if you actively participate and your MAGI is under $100k (phasing out to $0 by $150k); unused losses carry forward. On sale, claimed depreciation is recaptured at up to 25%, and gains may owe capital-gains tax (a 1031 exchange can defer both). Figures are a year-1 estimate at your 24.0% rate — not tax advice; consult a CPA.
Schools (NCES district)
- District
- Hopewell City Public School District
- NCES district ID
- 5101980
- Math proficiency
- 23% ▼ -54.00%
- Reading proficiency
- 49% ▼ -18.00%
- Median HH income
- $38,234
- Composite
- 29.95/100
- National rank
- #6377
- State rank
- #129 of 131 in VA
Livability — Hopewell
- Score
- 70/100
- State rank
- #224
- US rank
- #7437
Category grades
Schools grade is shown separately in the Schools card above.
Census & demographics
- Census place
- Hopewell, VA
- County
- Hopewell City · 31,404 people
- City population
- 31,404
- Metro
- Richmond, VA
- Population (ZIP)
- 31,404
- Household income
- $62,141
- Rent vs Own
- Severe rent burden
- 1055.0
Population outlook (Hopewell County) Hauer SSP2
- Today (2025)
- 21,776 people
- By 2030
- 21,457 · -1.5%
- By 2040
- 20,882 · -4.1%
- By 2050
- 20,239 · -7.1%
- By 2075
- 18,905 · -13.2%
- By 2100
- 16,949 · -22.2%
Race, ethnicity, and origin ACS 2023
- Neighborhood character
- Diverse neighborhood (Simpson 0.64)
- Race & ethnicity
- White 43% Black 42% Two or more races 9% Hispanic / Latino 8% Asian 1%
- Hispanic origin (detail)
- Mexican 2% Puerto Rican 2%
- Common ancestry
- Slovak 1% Romanian 1% Serbian 1%
- Foreign-born
- 3% · Canada
- Languages at home
- 94% English-only · Spanish 4% German/W. Germanic 1%
Political lean MEDSL · Hopewell
- 2024 margin
- D (+13.8) · D 56.4% · R 42.6% · Other 1.0%
- 2008→2024 swing
- +1.8pp toward D · 2008: 11.9pp · 2024: 13.8pp
- All cycles
- 2024: D+13.8 2020: D+14.7 2016: D+9.3 2012: D+16.0 2008: D+11.9
Not yet ingested
- Civics
- —
Market trends
- HPI YoY
- ▼ -85.28%
- Current HPI
- 302.6343
- Rent YoY
- ▲ 8.86%
- Metro
- Richmond, VA
- State GDP YoY
- ▲ 2.40%
- F500 in state
- 50
Industry mix (Fortune 500 HQ in VA)
| Industry | F500 HQs | Revenue |
|---|---|---|
| Aerospace / Defense | 4 | $236B |
|
||
| Technology / Defense | 3 | $32B |
|
||
| Financial Services | 2 | $176B |
|
||
| Utilities | 2 | $27B |
|
||
| Insurance | 2 | $25B |
|
||
| Technology | 2 | $15B |
|
||
Price history
+409.3% since first listed54 events — show timeline
- 2026-05-28 Pending — CVRMLS
- 2026-05-23 Listed $137,000 CVRMLS
- 2026-05-22 Relisted — CVRMLS
- 2026-05-16 Listing Removed — CVRMLS
- 2026-05-13 Pending — CVRMLS
- 2026-05-11 Price Changed $139,750 CVRMLS
- 2026-05-08 Price Changed $139,799 CVRMLS
- 2026-05-04 Price Changed $139,850 CVRMLS
- 2026-05-02 Price Changed $139,900 CVRMLS
- 2026-04-29 Price Changed $139,955 CVRMLS
- 2026-04-28 Relisted — CVRMLS
- 2026-04-23 Pending — CVRMLS
- 2026-04-15 Listed $139,999 CVRMLS
- 2026-03-29 Listing Removed — CVRMLS
- 2026-03-27 Price Changed $148,805 CVRMLS
- 2026-03-23 Price Changed $148,850 CVRMLS
- 2026-03-20 Price Changed $148,900 CVRMLS
- 2026-03-16 Price Changed $148,945 CVRMLS
- 2026-03-13 Price Changed $148,995 CVRMLS
- 2026-03-11 Relisted — CVRMLS
- 2026-03-09 Pending — CVRMLS
- 2026-03-04 Price Changed $149,505 CVRMLS
- 2026-02-26 Price Changed $149,555 CVRMLS
- 2026-02-20 Price Changed $149,999 CVRMLS
- 2026-02-20 Listed $139,995 CVRMLS
- 2026-01-31 Listing Removed — CVRMLS
- 2026-01-27 Price Changed $149,250 CVRMLS
- 2026-01-25 Price Changed $149,300 CVRMLS
- 2026-01-20 Price Changed $149,350 CVRMLS
- 2026-01-16 Price Changed $149,400 CVRMLS
- 2026-01-13 Price Changed $149,450 CVRMLS
- 2026-01-09 Price Changed $149,500 CVRMLS
- 2026-01-02 Price Changed $149,999 CVRMLS
- 2025-12-27 Listed $154,500 CVRMLS
- 2025-12-15 Listing Removed — CVRMLS
- 2025-12-12 Price Changed $154,750 CVRMLS
- 2025-12-09 Price Changed $154,800 CVRMLS
- 2025-12-04 Price Changed $154,850 CVRMLS
- 2025-11-28 Price Changed $154,900 CVRMLS
- 2025-11-20 Price Changed $154,949 CVRMLS
- 2025-11-18 Relisted — CVRMLS
- 2025-11-15 Listing Removed — CVRMLS
- 2025-11-14 Price Changed $159,949 CVRMLS
- 2025-10-29 Listed $159,999 CVRMLS
- 2025-10-27 Coming Soon — CVRMLS
- 2020-02-06 Sold (Public Records) $57,000 Public Records
- 2020-02-05 Sold (MLS) $57,000 CVRMLS
- 2020-01-15 Pending — CVRMLS
- 2020-01-15 Relisted — CVRMLS
- 2020-01-13 Pending — CVRMLS
- 2019-09-17 Listed $77,950 CVRMLS
- 2016-01-16 Listing Removed — CVRMLS
- 2015-09-16 Listed $71,400 CVRMLS
- 1996-02-16 Sold (Public Records) $26,900 Public Records
Property tax history
+4.1%/yrLatest (2025): $1,254 · +8.1% YoY. Source: county tax records.
Cash-flow waterfall
monthlySold comps — $/sqft
last 12 mo · ≤1 miLoading sold comps…