1066 Highway 43 · Pelahatchie, MS
Flood risk 1/10 · Minimal
- FEMA flood zone
- X (unshaded)
- Chance of flooding over 30 yrs
- 0.0%
- Est. flood insurance / yr
- $507 – $1,088
Fire risk 4/10 · Minor
- Est. fire insurance / yr
- $1,241 – $2,305
Heat risk 7/10 · Major
- Hot days now (above 109°F)
- 7 days/yr
- Hot days in 30 yrs
- 20 days/yr
Wind risk 8/10 · Major
- Chance of severe wind over 30 yrs
- 80.0%
Air-quality risk 1/10 · Minimal
- Unhealthy air days now
- 0 days/yr
- Unhealthy air days in 30 yrs
- 0 days/yr
Risk factors via First Street. Map © Google.
Why this score? — see what drove the B- grade
The composite is a weighted blend of 9 inputs, each scored 0–100. Each bar is that input's sub-score; the figure is the points it added to the 100-point composite (weight × sub-score).
- Cash flow +30.0/30.0
- DSCR +10.0/10.0
- 1% rule +8.7/10.0
- ARV discount +7.5/15.0
- Schools +4.6/10.0
- Livability +3.2/5.0
- Rent growth +2.5/5.0
- Condition / age +2.5/5.0
- Appreciation +0.0/10.0
$79,000
🖨 Deal sheet 📄 Offer letter ✓ Due diligence
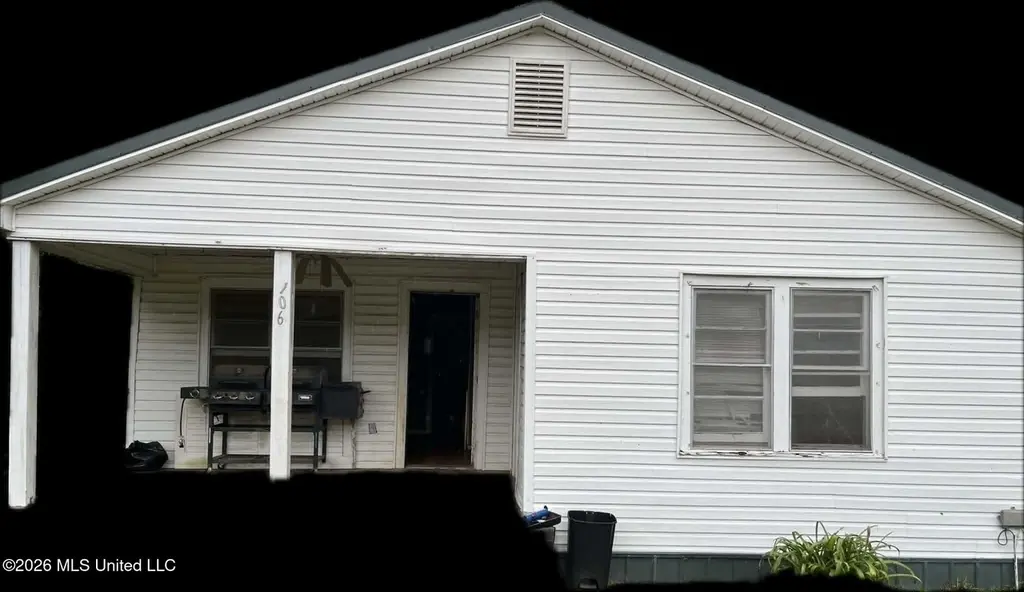
Listing remarks
House is a fixer upper and would need to be totally gutted. The main value is in the land.
Key facts
- 4.69 acre lot
- Built 1943
- Listed 23 days
Property features AI
Exterior
- Parking: On-site parking
- Utilities: Community water; Sewer: Unknown; Electricity available
- Home design: Single family residence (house); One level
- Construction: Vinyl construction; Conventional foundation; Built (year source: public records)
- Exterior features: Metal roof; 4.69-acre lot
Interior
- Bathrooms: 2 full bathrooms
- Heating & cooling: No central cooling
- Interior features: No central cooling
Neighborhood map
What this means for you Summary
Snapshot
- This is a 3-bed/2.0-bath single-family listed at $79k.
Deal economics
- At list price, monthly cash flow is $367 ($4k/yr) — positive.
- The deal already cash-flows at list — no discount required.
- Meets the 1% rule at list price ($1k rent vs $79k).
- Recommended offer: $78k (1.5% below list) — sets the bar for market timing.
Location & tenants
- Location reads 63/100 on livability (#149 in MS) — a middle-class / working-renter tenant base. Strengths: crime A+, cost of living A+, housing A+; Watch: amenities F, commute F, employment F.
- Rankin County School District (rural): math 56% / reading 48% proficiency, ranked #6 of 130 in MS (top 5%) — acceptable for families but not a draw, mixed tenant base, ~2y average lease.
- Zoned schools: Pelahatchie Elementary School (math 36% / reading 33%, grade F, #155 of 375 statewide, top 44%, 405 students, 99% FRL); Pelahatchie Attendance Center (math 37% / reading 32%, grade F, #68 of 197 statewide, top 39%, 366 students, 99% FRL) — zoned schools average 99% FRL vs 35% district-wide (65 pts higher); higher-poverty schools than district average — tighter screening recommended.
- Zoned-school proficiency averages 34% at this address vs 52% district-wide (-18 pts) — the specific schools serving this property underperform the Rankin County School District average; the district grade overstates school quality for this exact location.
- Market conditions: 40 active listings in the ZIP; 343 units permitted in Rankin County in 2024 (0 in 5+ unit buildings).
Forward outlook
- Local home prices are declining (-3.0%/yr); year-one equity from $546 of loan paydown is wiped out by about $2k of value loss. Plan a longer hold.
- Rankin County population projected at +17% by 2050 — long-run rental-demand tailwind backs the buy-and-hold thesis.
- At projected returns (-3.0% appreciation + 3.0% rent growth), your $22k cash investment doubles in ~7 years — after that, you're playing with house money.
Negotiation context
- It's been on market 23 days — a 2% lower offer ($78k) is reasonable based on typical stale-listing flexibility.
Risks & watch-outs
- Watch-outs: built in 1943 — expect roof / HVAC / electrical / plumbing capex.
- Climate carrying-cost: severe wind risk, 80% chance of damaging wind over 30y; extreme-heat days projected 7→20/yr by 2055 (HVAC capex compounding) — expect insurance premiums to compound above CPI over the hold.
Questions for the listing agent
- Built in 1943 — when were the roof, HVAC, electrical panel, plumbing, and water heater last replaced?
- Is there a deadline driving the sale (1031 exchange, divorce, estate, relocation)? That informs how much negotiation room exists.
- Schools are F-rated, which usually means shorter tenancies and higher turnover. Who's the typical renter profile here, and what's been the actual vacancy rate?
- What's the average days-on-market for RENTAL listings here right now (not sales)? A rising rental-DOM trend means longer vacancies and softer asking-rent achievability than the comps imply.
- What's the recent tenant-quality profile in this submarket — average credit score on applications, eviction rate, late-payment / NSF rate, and stable-employment percentage? A property-management company in the area should have these aggregated.
- How much new for-sale + rental construction is in the pipeline within 1–3 miles? Heavy new supply typically softens prices + rents 12–24 months out; constrained supply supports both.
Investment metrics
- 1% rule
- 1.37% ✓
- Cap rate
- 11.87%
- Cash-on-cash
- 19.90%
- DSCR
- 1.89
- GRM
- 6.1
CMA / ARV
No comps found within radius.
Projected returns pro-forma
-3.0% appreciation · 3.0% rent growth · sell at horizon
- IRR
- 12.0%
- Equity multiple
- 1.48×
- Total profit
- $10,544
- Equity at exit
- $11,779
- IRR
- 20.9%
- Equity multiple
- 2.77×
- Total profit
- $39,189
- Equity at exit
- $6,830
Cash invested: $22,120 (down + closing). Projections, not guarantees.
Landlord ↔ Tenant lean methodology
- Overall (STATE)
- 90 Strongly Landlord-Friendly
- State Mississippi
- 90 Strongly Landlord-Friendly · R+11
- County
- — inherits STATE
- City
- — inherits STATE
ZIP-level market 39145
- Home prices YoY
- -8.9%
- Active inventory
- 40
- Price-to-rent
- 6.1×
Monthly cashflow live
- Estimated rent
- $1,082 medium interval (Pro) →
- Mortgage (P&I)
- −$414
- Tax from tax record
- −$41 /mo · $492/yr
- Insurance
- −$33
- HOA
- −$0
- Vacancy / Maint / Mgmt
- −$227
- Net cashflow
- $367
Break-even live
UW: 25.0% down · 7.5% · 30yr · 1.5% tax · 5.0% vac · 8.0% maint · 8.0% mgmt
Financing live
Cash to close
- Down payment
- $19,750
- Closing costs
- $2,370
- Reserves months
- —
- Total cash needed
- —
Loan-product check · same deal, 3 products live
Conventional
25% down · 7.5% · 30yr
- Down + closing
- —
- Monthly P&I
- —
- Monthly cashflow
- —
- DSCR
- —
- Eligible?
- —
Personal DTI + credit; lowest rate.
DSCR
20% down · 8.5% · 30yr
- Down + closing
- —
- Monthly P&I
- —
- Monthly cashflow
- —
- DSCR
- —
- Eligible?
- —
No personal income docs; deal must DSCR.
Hard money
10% down · 12.0% · 12mo
- Down + closing
- —
- Monthly P&I
- —
- Monthly cashflow
- —
- DSCR
- —
- Eligible?
- —
Short-term bridge; refi at stabilization.
Listing history 16 events
-
2026-06-18days on market $79,000 Active 23 DOM
-
2026-06-17days on market $79,000 Active 22 DOM
-
2026-06-16days on market $79,000 Active 21 DOM
-
2026-06-15days on market $79,000 Active 20 DOM
-
2026-06-14days on market $79,000 Active 18 DOM
-
2026-06-13days on market $79,000 Active 17 DOM
-
2026-06-10days on market $79,000 Active 15 DOM
-
2026-06-09days on market $79,000 Active 14 DOM
-
2026-06-08days on market $79,000 Active 13 DOM
-
2026-06-07pricedays on market $79,000 Active 12 DOM
-
2026-06-03days on market $85,000 Active 8 DOM
-
2026-06-02days on market $85,000 Active 7 DOM
-
2026-06-01days on market $85,000 Active 6 DOM
-
2026-05-31days on market $85,000 Active 5 DOM
-
2026-05-30days on market $85,000 Active 4 DOM
-
2026-05-26$85,000 Active
ⓘ Source: listings_history table (triggers on properties + properties_extension) + one-shot
backfill from property_details.listing_events for pre-trigger history.
Tax reassessment forecast MS · Resets to sale price
- Current annual tax
- $492 · $41/mo
- Projected year-2 tax
- $624 · $52/mo
- Expected delta
- +$132/yr (+$11/mo · 26.7%)
ⓘ Screening estimate from a state-policy table — verify with the county assessor before closing.
Climate risk First Street
- Flood 1/10 Low FEMA zone X (unshaded) · 0% chance over 30 yrs
- Wildfire 4/10 Moderate
- Heat 7/10 Severe 7 d/yr ≥109°F today · 20 d/yr by 30 yrs out
- Wind 8/10 Severe 80% chance of damaging wind over 30 yrs
- Air quality 1/10 Low 0 unhealthy d/yr today · 0 by 30 yrs out
Nearby sold comps map
Loading sold comps map…
Walkable amenities ~0.75 mi
Loading nearby amenities…
Taxation est. · year 1
- Rental income
- $12,989
- − Mortgage interest
- −$4,425
- − Property taxes
- −$492
- − Insurance
- −$395
- − Repairs & maintenance
- −$1,039
- − Management
- −$1,039
- − Depreciation
- −$2,298
- Taxable income
- $3,300
- Est. tax owed @ 24.0%
- −$792
- After-tax cash flow
- $3,610/yr
For passive investors: Depreciation is non-cash, so a rental often shows a tax loss while cash-flowing — sheltering income. Rental losses are passive: they offset passive income freely, and up to $25,000/yr can offset ordinary (W-2) income if you actively participate and your MAGI is under $100k (phasing out to $0 by $150k); unused losses carry forward. On sale, claimed depreciation is recaptured at up to 25%, and gains may owe capital-gains tax (a 1031 exchange can defer both). Figures are a year-1 estimate at your 24.0% rate — not tax advice; consult a CPA.
Schools (NCES district)
- District
- Rankin County School District
- NCES district ID
- 2803830
- Math proficiency
- 56% ▼ -4.00%
- Reading proficiency
- 48% ▼ -6.00%
- Median HH income
- $61,867
- Composite
- 45.62/100
- National rank
- #2587
- State rank
- #6 of 130 in MS
Livability — Pelahatchie
- Score
- 63/100
- State rank
- #149
- US rank
- #15148
Category grades
Schools grade is shown separately in the Schools card above.
Census & demographics
- Population (ZIP)
- 5,094
Population outlook (Rankin County) Hauer SSP2
- Today (2025)
- 164,317 people
- By 2030
- 171,013 · +4.1%
- By 2040
- 182,723 · +11.2%
- By 2050
- 192,376 · +17.1%
- By 2075
- 209,535 · +27.5%
- By 2100
- 209,534 · +27.5%
Race, ethnicity, and origin ACS 2023
- Neighborhood character
- Predominantly White (82%)
- Race & ethnicity
- White 82% Black 13% Two or more races 4% Hispanic / Latino 3%
- Common ancestry
- Italian 14% Romanian 2% Lithuanian 1%
- Foreign-born
- 1% · Canada
- Languages at home
- 99% English-only · Spanish 1%
Political lean MEDSL · Rankin
- 2024 margin
- Solid R (+47.1) · D 25.9% · R 73.0% · Other 1.0%
- 2008→2024 swing
- +6.4pp toward D · 2008: -53.5pp · 2024: -47.1pp
- All cycles
- 2024: R+47.1 2020: R+45.4 2016: R+52.9 2012: R+51.9 2008: R+53.5
Not yet ingested
- Civics
- —
Market trends
- HPI YoY
- ▼ -18.98%
- Current HPI
- 194.7362
- Rent YoY
- —
- Metro
- —
- State GDP YoY
- —
- F500 in state
- 0
Price history
1 event — show timeline
- 2026-05-26 Listed $85,000 MLSU
Property tax history
+6.0%/yrLatest (2025): $492 · +3.0% YoY. Source: county tax records.
Cash-flow waterfall
monthlySold comps — $/sqft
last 12 mo · ≤1 miLoading sold comps…