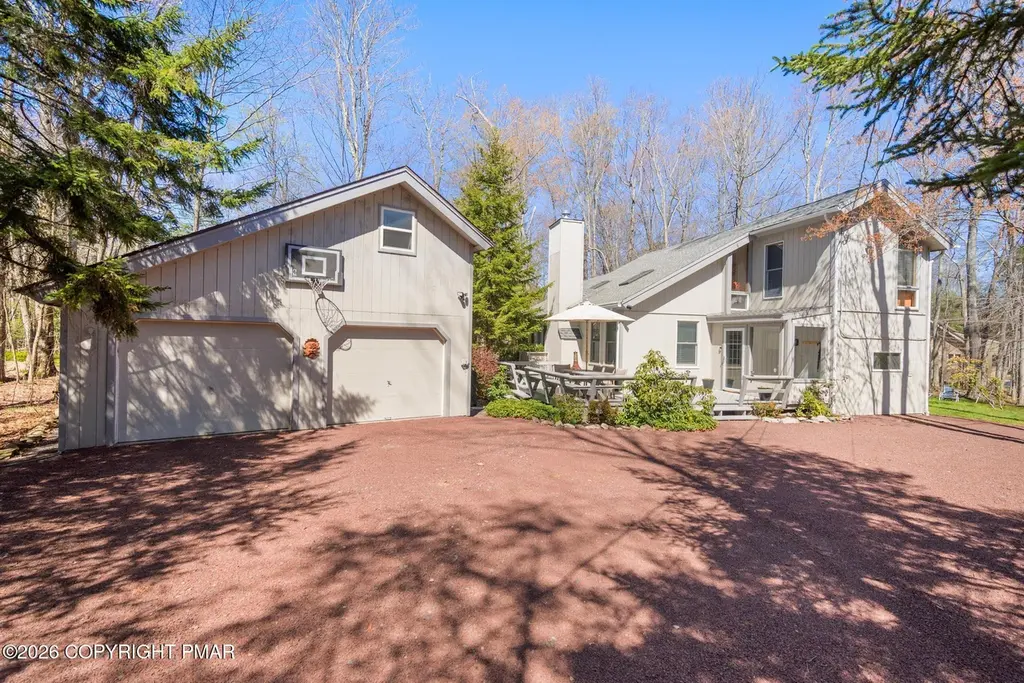
283 Long View Ln · Pocono Pines, PA
Flood risk 1/10 · Minimal
- FEMA flood zone
- X (unshaded)
- Chance of flooding over 30 yrs
- 0.0%
- Est. flood insurance / yr
- $507 – $1,088
Fire risk 3/10 · Minor
- Est. fire insurance / yr
- $511 – $949
Heat risk 2/10 · Minimal
- Hot days now (above 89°F)
- 7 days/yr
- Hot days in 30 yrs
- 15 days/yr
Wind risk 4/10 · Minor
- Chance of severe wind over 30 yrs
- 8.0%
Air-quality risk 2/10 · Minimal
- Unhealthy air days now
- 1 days/yr
- Unhealthy air days in 30 yrs
- 2 days/yr
Risk factors via First Street. Map © Google.
Why this score? — see what drove the D- grade
The composite is a weighted blend of 9 inputs, each scored 0–100. Each bar is that input's sub-score; the figure is the points it added to the 100-point composite (weight × sub-score).
- ARV discount +12.1/15.0
- Cash flow +5.7/30.0
- Schools +4.0/10.0
- Livability +3.7/5.0
- Appreciation +3.5/10.0
- Rent growth +2.5/5.0
- Condition / age +2.5/5.0
- 1% rule +1.3/10.0
- DSCR +0.1/10.0
$495,000
🖨 Deal sheet 📄 Offer letter ✓ Due diligence
Listing remarks MLS
Lovely 3 bedroom home with new kitchen, new roof in 2012, new bathrooms. Beautiful tongue and groove cathedral ceiling and laminate flooring throughout entire home. New Andersen windows on the first floor. Mud room was added to front of house. Original 2 car garage was converted to a summer TV/play room with additional summer bedroom upstairs. Wall A/C unit in bedroom. Other side of garage can accommodate all your bikes, boats and beach chairs/toys. Great space for the person who likes to be organized.
Key facts
- 0.47 acre lot
- 2 garage spots
- Built 1971
Property features AI
Finance
- Other: Located on a paved, public maintained state road; Lot is wooded (0.47 acres)
- HOA & community: Part of Lake Naomi community; Homeowners association dues collected annually; Annual association fee $1,058 (about $88.17/month); HOA provides security
Exterior
- Parking: 2-car garage with garage door opener, garage faces front and is heated; Off-street parking; 3 open parking spaces
- Security: Smoke detectors; Community security through HOA
- Utilities: Well water; Septic tank; Propane service; Electric with circuit breakers
- Home design: Single family house; No common walls; Residential zoning
- Construction: Asphalt shingle roof; Block foundation
- Exterior features: Private yard; Fire pit; Deck; Enclosed screened porch; Mirrored closet doors
Interior
- Kitchen: Electric oven; Electric range; Refrigerator; Dishwasher; Microwave; Stainless steel appliances; Stone counters
- Flooring: Laminate; Tile; Vinyl
- Bathrooms: 2 full bathrooms
- Heating & cooling: Baseboard heating; Electric heating; Propane heating; Ceiling fans; Wall cooling units; Window cooling units
- Interior features: Stone counters; Beamed ceilings; Cathedral ceilings; Track lighting; Ceiling fans; Skylights; Insulated windows; Window treatments; Window screens; Furnished; Fireplace in living room with stone surround and propane fuel
- Laundry & utility: Stacked washer/dryer; Washer/dryer located on main level; Owned water softener
Neighborhood map
What this means for you Summary
Snapshot
- This is a 3-bed/1.5-bath single-family listed at $495k.
Deal economics
- At list price, monthly cash flow is $-1k ($-12k/yr) — negative.
- To cash-flow at today's rent, offer at most $318k (35.8% below list).
- To meet the 1% rule (rent ≥ 1% of price), the offer needs to be $310k (37.4% below list).
- Recommended offer: $310k (37.4% below list) — sets the bar for 1% rule.
Location & tenants
- Location reads 74/100 on livability (#532 in PA, #4,925 nationally) — a middle-class / working-renter tenant base. Strengths: employment A+, cost of living A+, crime A; Watch: health & safety D, amenities F, commute F.
- Pocono Mountain SD (rural): math 37% / reading 55% proficiency, ranked #245 of 539 in PA (top 46%) — families likely to look elsewhere, expect single-tenant / working-renter base with shorter leases.
- Market conditions: 97 active listings in the ZIP; 1 comparable units currently listed for rent nearby; 278 units permitted in Monroe County in 2024 (52 in 5+ unit buildings).
Forward outlook
- Local home prices are declining (-3.0%/yr); year-one equity from $3k of loan paydown is wiped out by about $15k of value loss. Plan a longer hold.
- Monroe County population projected at -11% by 2050 — secular population decline; favor cash flow + early exit over multi-decade hold.
Negotiation context
- It's been on market 50 days — a 3% lower offer ($480k) is reasonable based on typical stale-listing flexibility.
- 3 sale attempts since 12y ago with the ask held roughly flat each time — persistent listings suggest the price (not the market) is what's stuck; bring a comps-based counter.
- Current owner paid $429k; 15% above their basis — modest negotiation headroom, anchor on the comps not their cost.
Questions for the listing agent
- What do current leases actually rent for vs. the listed asking? Can we see a recent rent roll and the last 12 months of T-12 income?
- It's been on market 50 days. Have you received any prior offers? Is the seller open to a 37% concession, seller financing, or rate buy-down credit?
- Built in 1971 — when were the roof, HVAC, electrical panel, plumbing, and water heater last replaced?
- What does the HOA fee cover, when was the last increase, and are there any pending special assessments or reserve-fund shortfalls?
- Is there a deadline driving the sale (1031 exchange, divorce, estate, relocation)? That informs how much negotiation room exists.
- Schools are B-rated — typically a magnet for longer-tenancy family renters. What's the average tenant stay here, and is there a school-zone premium baked into asking?
- The area grade is low — what's the realistic commute time and amenity access for the typical tenant pool here? Any planned neighborhood developments (good or bad) we should know about?
- What's the average days-on-market for RENTAL listings here right now (not sales)? A rising rental-DOM trend means longer vacancies and softer asking-rent achievability than the comps imply.
- What's the recent tenant-quality profile in this submarket — average credit score on applications, eviction rate, late-payment / NSF rate, and stable-employment percentage? A property-management company in the area should have these aggregated.
- How much new for-sale + rental construction is in the pipeline within 1–3 miles? Heavy new supply typically softens prices + rents 12–24 months out; constrained supply supports both.
Investment metrics
- 1% rule
- 0.63% ✗
- Cap rate
- 3.86%
- Cash-on-cash
- -8.69%
- DSCR
- 0.61
- GRM
- 13.3
CMA / ARV
- ARV (median comp)
- $551,619
- List price
- $495,000
- Delta
- -10.26%
- Verdict
- UNDERPRICED
- Comps
- 20 within 1.0 mi
Show comp detail 11 sales within ~0.75 mi
| Address | Dist | Beds/Ba | Sqft | Sold | Price | $/sf | Match |
|---|---|---|---|---|---|---|---|
| 2271 Beaver Cir | 0.34mi | 3/2.0 | 1,428 (+4%) | 6mo | $276,000 | $193 | 71 |
| 5598 Woodland Ave | 0.23mi | 3/2.0 | 1,344 (-2%) | 16mo | $335,000 | $249 | 70 |
| 5581 Woodland Ave | 0.28mi | 3/2.0 | 1,520 (+10%) | 4mo | $465,000 | $306 | 65 |
| 2112 Trout Pond Ct | 0.48mi | 3/2.0 | 1,447 (+5%) | 5mo | $390,000 | $270 | 63 |
| 261 Aspen Rd | 0.42mi | 3/3.0 | 1,350 (-2%) | 12mo | $476,250 | $353 | 61 |
| 151 Winding Hill Rd | 0.46mi | 4/2.0 (+1) | 1,392 (+1%) | 12mo | $450,000 | $323 | 59 |
| 178 Tanglewood Dr | 0.11mi | 3/2.0 | 1,508 (+10%) | 21mo | $400,000 | $265 | 59 |
| 245 Aspen Rd | 0.38mi | 3/2.0 | 1,328 (-4%) | 20mo | $485,000 | $365 | 57 |
| 2222 Hillcrest Dr | 0.34mi | 3/2.0 | 1,560 (+13%) | 12mo | $515,000 | $330 | 50 |
| 5493 Woodland Ave | 0.63mi | 4/2.0 (+1) | 1,344 (-2%) | 15mo | $344,900 | $257 | 48 |
| 196 Split Rock Ln | 0.60mi | 4/2.0 (+1) | 1,508 (+10%) | 5mo | $549,000 | $364 | 45 |
Match score weights: distance 35% · size 25% · config 20% · recency 20%. Top-matched comps best support the ARV.
Projected returns pro-forma
-3.0% appreciation · 3.0% rent growth · sell at horizon
- IRR
- -31.7%
- Equity multiple
- -0.04×
- Total profit
- $-144,051
- Equity at exit
- $73,806
- IRR
- -35.7%
- Equity multiple
- -0.50×
- Total profit
- $-207,457
- Equity at exit
- $42,799
Cash invested: $138,600 (down + closing). Projections, not guarantees.
Landlord ↔ Tenant lean methodology
- Overall (STATE)
- 62 Landlord-Friendly
- State Pennsylvania
- 62 Landlord-Friendly · EVEN
- County
- — inherits STATE
- City
- — inherits STATE
ZIP-level market 18350
- Home prices YoY
- -1.4%
- Active inventory
- 97
- Price-to-rent
- 13.3×
Monthly cashflow live
- Estimated rent
- $3,100 medium interval (Pro) →
- Mortgage (P&I)
- −$2,596
- Tax from tax record
- −$562 /mo · $6,748/yr
- Insurance
- −$206
- HOA
- −$88
- Vacancy / Maint / Mgmt
- −$651
- Net cashflow
- $-1,003
Break-even live
UW: 25.0% down · 7.5% · 30yr · 1.5% tax · 5.0% vac · 8.0% maint · 8.0% mgmt
Financing live
Cash to close
- Down payment
- $123,750
- Closing costs
- $14,850
- Reserves months
- —
- Total cash needed
- —
Loan-product check · same deal, 3 products live
Conventional
25% down · 7.5% · 30yr
- Down + closing
- —
- Monthly P&I
- —
- Monthly cashflow
- —
- DSCR
- —
- Eligible?
- —
Personal DTI + credit; lowest rate.
DSCR
20% down · 8.5% · 30yr
- Down + closing
- —
- Monthly P&I
- —
- Monthly cashflow
- —
- DSCR
- —
- Eligible?
- —
No personal income docs; deal must DSCR.
Hard money
10% down · 12.0% · 12mo
- Down + closing
- —
- Monthly P&I
- —
- Monthly cashflow
- —
- DSCR
- —
- Eligible?
- —
Short-term bridge; refi at stabilization.
Rent comps 1 comps
| Address | Beds | Baths | Sqft | Rent | $/sqft | DOM | Units | Dist |
|---|---|---|---|---|---|---|---|---|
| 2195 N Estates Dr Pocono Summit, PA | 4.0 | 2.0 | 1864 | $3,100 | $1.66 | 43d | 1 | 1.47mi |
HOA detail
- Monthly dues
- $88 · $1,056/yr
Listing history 25 events
-
2026-06-19days on market $495,000 Active 50 DOM
-
2026-06-18days on market $495,000 Active 49 DOM
-
2026-06-17days on market $495,000 Active 48 DOM
-
2026-06-16days on market $495,000 Active 47 DOM
-
2026-06-15days on market $495,000 Active 46 DOM
-
2026-06-14days on market $495,000 Active 44 DOM
-
2026-06-13days on market $495,000 Active 43 DOM
-
2026-06-10days on market $495,000 Active 41 DOM
-
2026-06-09days on market $495,000 Active 40 DOM
-
2026-06-08days on market $495,000 Active 39 DOM
-
2026-06-07days on market $495,000 Active 38 DOM
-
2026-06-02days on market $495,000 Active 33 DOM
-
2026-06-01days on market $495,000 Active 32 DOM
-
2026-05-31days on market $495,000 Active 31 DOM
-
2026-05-30days on market $495,000 Active 30 DOM
-
2026-04-22$495,000 Active 692-char remark
-
2024-02-28soldstatus $429,000
-
2022-11-21soldstatus $427,000
-
2015-05-19soldstatus $282,000
-
2015-05-15soldstatus $282,000
Show marketing remark (507 chars)
Lovely 3 bedroom home with new kitchen, new roof in 2012, new bathrooms. Beautiful tongue and groove cathedral ceiling and laminate flooring throughout entire home. New Andersen windows on the first floor. Mud room was added to front of house. Original 2 car garage was converted to a summer TV/play room with additional summer bedroom upstairs. Wall A/C unit in bedroom. Other side of garage can accommodate all your bikes, boats and beach chairs/toys. Great space for the person who likes to be organized.
-
2015-03-12$295,000
Show marketing remark (507 chars)
Lovely 3 bedroom home with new kitchen, new roof in 2012, new bathrooms. Beautiful tongue and groove cathedral ceiling and laminate flooring throughout entire home. New Andersen windows on the first floor. Mud room was added to front of house. Original 2 car garage was converted to a summer TV/play room with additional summer bedroom upstairs. Wall A/C unit in bedroom. Other side of garage can accommodate all your bikes, boats and beach chairs/toys. Great space for the person who likes to be organized.
-
2014-07-28$295,000
-
2007-03-14soldstatus $290,000
-
2003-04-22soldstatus $176,000
-
1983-05-20soldstatus $69,000
ⓘ Source: listings_history table (triggers on properties + properties_extension) + one-shot
backfill from property_details.listing_events for pre-trigger history.
Tax reassessment forecast PA · Partial reset (capped growth)
- Current annual tax
- $6,748 · $562/mo
- Projected year-2 tax
- $7,284 · $607/mo
- Expected delta
- +$537/yr (+$45/mo · 8.0%)
ⓘ Screening estimate from a state-policy table — verify with the county assessor before closing.
Climate risk First Street
- Flood 1/10 Low FEMA zone X (unshaded) · 0% chance over 30 yrs
- Wildfire 3/10 Moderate
- Heat 2/10 Low 7 d/yr ≥89°F today · 15 d/yr by 30 yrs out
- Wind 4/10 Moderate 8% chance of damaging wind over 30 yrs
- Air quality 2/10 Low 1 unhealthy d/yr today · 2 by 30 yrs out
Nearby sold comps map
Loading sold comps map…
Walkable amenities ~0.75 mi
Loading nearby amenities…
Taxation est. · year 1
- Rental income
- $37,200
- − Mortgage interest
- −$27,728
- − Property taxes
- −$6,748
- − Insurance
- −$2,475
- − Repairs & maintenance
- −$2,976
- − Management
- −$2,976
- − HOA
- −$1,056
- − Depreciation
- −$14,400
- Taxable loss
- −$21,158
- Est. tax savings @ 24.0%
- +$5,078
- After-tax cash flow
- $-6,963/yr
For passive investors: Depreciation is non-cash, so a rental often shows a tax loss while cash-flowing — sheltering income. Rental losses are passive: they offset passive income freely, and up to $25,000/yr can offset ordinary (W-2) income if you actively participate and your MAGI is under $100k (phasing out to $0 by $150k); unused losses carry forward. On sale, claimed depreciation is recaptured at up to 25%, and gains may owe capital-gains tax (a 1031 exchange can defer both). Figures are a year-1 estimate at your 24.0% rate — not tax advice; consult a CPA.
Schools (NCES district)
- District
- Pocono Mountain SD
- NCES district ID
- 4219500
- Math proficiency
- 37% ▼ -5.00%
- Reading proficiency
- 55% ▲ 1.00%
- Median HH income
- $55,317
- Composite
- 39.91/100
- National rank
- #3856
- State rank
- #245 of 539 in PA
Livability — Pocono Pines
- Score
- 74/100
- State rank
- #532
- US rank
- #4925
Category grades
Schools grade is shown separately in the Schools card above.
Census & demographics
- Census place
- Pocono Pines, PA
- City population
- 595
- Population (ZIP)
- 595
Population outlook (Monroe County) Hauer SSP2
- Today (2025)
- 164,099 people
- By 2030
- 161,412 · -1.6%
- By 2040
- 154,616 · -5.8%
- By 2050
- 146,710 · -10.6%
- By 2075
- 140,830 · -14.2%
- By 2100
- 138,472 · -15.6%
Race, ethnicity, and origin ACS 2023
- Neighborhood character
- Predominantly White (83%)
- Race & ethnicity
- White 83% Asian 12% Two or more races 5%
- Common ancestry
- Romanian 6% Slovak 6% Russian 3%
- Foreign-born
- 15% · South Korea
- Languages at home
- 82% English-only · Korean 12% Other Indo-European 6%
Political lean MEDSL · Monroe
- 2024 margin
- Toss-up / Even · D 49.1% · R 49.9%
- 2008→2024 swing
- -17.1pp toward R · 2008: 16.3pp · 2024: -0.8pp
- All cycles
- 2024: R+0.8 2020: D+6.4 2016: D+0.3 2012: D+14.0 2008: D+16.3
Not yet ingested
- Civics
- —
Market trends
- HPI YoY
- ▼ -3.00%
- Current HPI
- 215.5562
- Rent YoY
- —
- Metro
- —
- State GDP YoY
- ▲ 1.68%
- F500 in state
- 34
Industry mix (Fortune 500 HQ in PA)
| Industry | F500 HQs | Revenue |
|---|---|---|
| Healthcare | 2 | $309B |
|
||
| Insurance | 2 | $27B |
|
||
| Telecommunications / Media | 1 | $124B |
|
||
| Industrial Distribution | 1 | $22B |
|
||
| Financial Services | 1 | $20B |
|
||
| Chemicals / Materials | 1 | $18B |
|
||
Price history
+617.4% since first listed10 events — show timeline
- 2026-04-22 Listed $495,000 PMAR
- 2024-02-28 Sold (Public Records) $429,000 Public Records
- 2022-11-21 Sold (Public Records) $427,000 Public Records
- 2015-05-19 Sold (Public Records) $282,000 Public Records
- 2015-05-15 Sold (MLS) $282,000 PMAR
- 2015-03-12 Listed $295,000 PMAR
- 2014-07-28 Listed $295,000 PMAR
- 2007-03-14 Sold (Public Records) $290,000 Public Records
- 2003-04-22 Sold (Public Records) $176,000 Public Records
- 1983-05-20 Sold (Public Records) $69,000 Public Records
Property tax history
+4.4%/yrLatest (2026): $6,748 · -4.4% YoY. Source: county tax records.
Cash-flow waterfall
monthlySold comps — $/sqft
last 12 mo · ≤1 miLoading sold comps…