 🏷️ Likely Rental
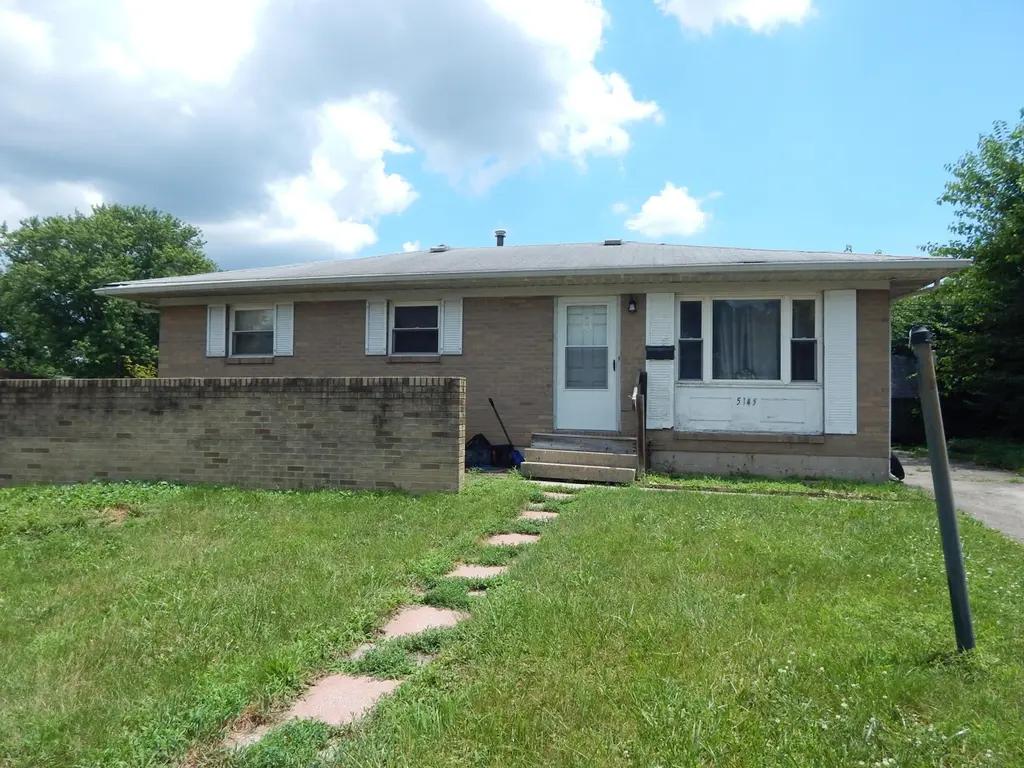
5145 Fullerton Dr · Blacklick Estates, OH
Flood risk 3/10 · Minor
- FEMA flood zone
- X (unshaded)
- Chance of flooding over 30 yrs
- 0.17%
- Est. flood insurance / yr
- $473 – $860
Fire risk 1/10 · Minimal
- Est. fire insurance / yr
- $713 – $1,323
Heat risk 4/10 · Minor
- Hot days now (above 99°F)
- 7 days/yr
- Hot days in 30 yrs
- 18 days/yr
Wind risk 2/10 · Minimal
- Chance of severe wind over 30 yrs
- 1.0%
Air-quality risk 2/10 · Minimal
- Unhealthy air days now
- 1 days/yr
- Unhealthy air days in 30 yrs
- 1 days/yr
Risk factors via First Street. Map © Google.
Why this score? — see what drove the C+ grade
The composite is a weighted blend of 9 inputs, each scored 0–100. Each bar is that input's sub-score; the figure is the points it added to the 100-point composite (weight × sub-score).
- Cash flow +21.4/30.0
- ARV discount +15.0/15.0
- DSCR +6.8/10.0
- 1% rule +6.0/10.0
- Livability +3.7/5.0
- Rent growth +3.1/5.0
- Schools +2.7/10.0
- Condition / age +2.5/5.0
- Appreciation +0.0/10.0
$149,900
🖨 Deal sheet 📄 Offer letter ✓ Due diligence
Listing remarks MLS
3 bedroom ranch with full basement. Much larger than it looks with rear addition and sun room. Property faces Danmoor Rd. Currently rented month-to-month with long term tenant since 2015 at $770 a month. Minimum 24 hour notice to show. A portion of the parcel is located in a flood plain. If financing, flood insurance may be required.
Key facts
- 7,840 sq ft lot
- Built 1963
- Listed 2 days
Property features AI
Exterior
- Utilities: Public water; Public sewer
- Home design: Single family residence; One story; Built in 1963; No common walls
- Construction: Block foundation
- Exterior features: Patio
Interior
- Bedrooms: Three bedrooms on the main level
- Bathrooms: One full bathroom
- Heating & cooling: Central air conditioning; Forced air heating
- Interior features: Partial basement
Neighborhood map
What this means for you Summary
Snapshot
- This is a 3-bed/1.0-bath single-family listed at $150k.
Deal economics
- At list price, monthly cash flow is $223 ($3k/yr) — positive.
- The deal already cash-flows at list — no discount required.
- Meets the 1% rule at list price ($2k rent vs $150k).
- Cap rate 8.1% vs local median 5.4% in Blacklick Estates — top-decile yield for the area; either an underpriced asset or a hidden risk that comps aren't pricing in. Stress-test before assuming the spread holds.
Location & tenants
- Location reads 73/100 on livability (#314 in OH) — a middle-class / working-renter tenant base. Strengths: cost of living A+, housing A+, commute A-; Watch: crime C-, amenities F, health & safety F.
- Groveport Madison Local (suburban): math 23% / reading 38% proficiency, ranked #573 of 656 in OH (top 87%) — families likely to look elsewhere, expect single-tenant / working-renter base with shorter leases; 65% free/reduced lunch — lower-income household profile, screen leases tightly.
- Market conditions: Rents rising (+2.4%/yr); 89 active listings in the ZIP; 15 comparable units currently listed for rent nearby; rentals at typical pace (median 17d on market — plan ~3-4 weeks tenant-placement turnaround); 8,139 units permitted in Franklin County in 2024 (5,940 in 5+ unit buildings).
- This rent runs 39% of the median local income ($51k/yr) — at the standard rent-burdened threshold; future hikes will face affordability resistance.
Forward outlook
- Local home prices are declining (-3.0%/yr); year-one equity from $1k of loan paydown is wiped out by about $4k of value loss. Plan a longer hold.
- Franklin County population projected at +34% by 2050 — long-run rental-demand tailwind backs the buy-and-hold thesis.
Negotiation context
- Only 2 days on market — expect competitive offers; lowballing is unlikely to land.
- 5 sale attempts since 31y ago with the ask held roughly flat each time — persistent listings suggest the price (not the market) is what's stuck; bring a comps-based counter.
- Current owner paid $65k; list at $150k implies a 131% gain — meaningful room to come down on a strong offer.
Questions for the listing agent
- Built in 1963 — when were the roof, HVAC, electrical panel, plumbing, and water heater last replaced?
- Is there a deadline driving the sale (1031 exchange, divorce, estate, relocation)? That informs how much negotiation room exists.
- What's the average days-on-market for RENTAL listings here right now (not sales)? A rising rental-DOM trend means longer vacancies and softer asking-rent achievability than the comps imply.
- What's the recent tenant-quality profile in this submarket — average credit score on applications, eviction rate, late-payment / NSF rate, and stable-employment percentage? A property-management company in the area should have these aggregated.
- How much new for-sale + rental construction is in the pipeline within 1–3 miles? Heavy new supply typically softens prices + rents 12–24 months out; constrained supply supports both.
Investment metrics
- 1% rule
- 1.10% ✓
- Cap rate
- 8.08%
- Cash-on-cash
- 6.38%
- DSCR
- 1.28
- GRM
- 7.6
CMA / ARV
- ARV (on-the-fly)
- $199,240
- Comps found
- 12
Show comp detail 12 sales within ~0.75 mi
| Address | Dist | Beds/Ba | Sqft | Sold | Price | $/sf | Match |
|---|---|---|---|---|---|---|---|
| 5027 Brewster Dr | 0.24mi | 3/1.5 | 1,176 (+0%) | 8mo | $219,000 | $186 | 79 |
| 5010 Chipman Dr | 0.20mi | 3/1.0 | 1,222 (+4%) | 11mo | $190,000 | $155 | 74 |
| 5055 Gunston Dr | 0.11mi | 3/1.0 | 1,076 (-8%) | 11mo | $207,500 | $193 | 72 |
| 5375 Fullerton Dr | 0.31mi | 3/1.5 | 1,148 (-2%) | 10mo | $180,000 | $157 | 72 |
| 5261 Elmira Dr | 0.35mi | 3/1.0 | 1,196 (+2%) | 10mo | $200,000 | $167 | 72 |
| 3816 Wade Rd | 0.38mi | 3/1.0 | 1,192 (+2%) | 9mo | $159,800 | $134 | 72 |
| 5004 Bentler Dr | 0.32mi | 3/1.5 | 1,124 (-4%) | 6mo | $210,000 | $187 | 71 |
| 3622 Alpena Rd | 0.42mi | 3/2.0 | 1,219 (+4%) | 1mo | $225,000 | $185 | 68 |
| 3547 Noe Bixby Rd | 0.53mi | 3/1.5 | 1,138 (-3%) | 1mo | $165,000 | $145 | 68 |
| 4824 Harbor Blvd | 0.53mi | 3/2.0 | 1,104 (-6%) | 9mo | $195,000 | $177 | 54 |
| 4655 Glengate Dr | 0.69mi | 3/3.0 | 1,276 (+9%) | 6mo | $199,900 | $157 | 40 |
| 5254 Sedalia Dr | 0.71mi | 4/2.0 (+1) | 1,266 (+8%) | 7mo | $215,000 | $170 | 38 |
Match score weights: distance 35% · size 25% · config 20% · recency 20%. Top-matched comps best support the ARV.
Projected returns pro-forma
-3.0% appreciation · 2.36% rent growth · sell at horizon
- IRR
- -7.2%
- Equity multiple
- 0.74×
- Total profit
- $-11,079
- Equity at exit
- $22,351
- IRR
- 1.6%
- Equity multiple
- 1.11×
- Total profit
- $4,590
- Equity at exit
- $12,961
Cash invested: $41,972 (down + closing). Projections, not guarantees.
Landlord ↔ Tenant lean methodology
- Overall (STATE)
- 73 Landlord-Friendly
- State Ohio
- 73 Landlord-Friendly · R+6
- County
- — inherits STATE
- City
- — inherits STATE
ZIP-level market 43232
- Rents YoY
- 2.4%
- Active inventory
- 89
- Price-to-rent
- 7.6×
Monthly cashflow live
- Estimated rent
- $1,653 high interval (Pro) →
- Mortgage (P&I)
- −$786
- Tax from tax record
- −$234 /mo · $2,805/yr
- Insurance
- −$62
- HOA
- −$0
- Vacancy / Maint / Mgmt
- −$347
- Net cashflow
- $223
Break-even live
UW: 25.0% down · 7.5% · 30yr · 1.5% tax · 5.0% vac · 8.0% maint · 8.0% mgmt
Financing live
Cash to close
- Down payment
- $37,475
- Closing costs
- $4,497
- Reserves months
- —
- Total cash needed
- —
Loan-product check · same deal, 3 products live
Conventional
25% down · 7.5% · 30yr
- Down + closing
- —
- Monthly P&I
- —
- Monthly cashflow
- —
- DSCR
- —
- Eligible?
- —
Personal DTI + credit; lowest rate.
DSCR
20% down · 8.5% · 30yr
- Down + closing
- —
- Monthly P&I
- —
- Monthly cashflow
- —
- DSCR
- —
- Eligible?
- —
No personal income docs; deal must DSCR.
Hard money
10% down · 12.0% · 12mo
- Down + closing
- —
- Monthly P&I
- —
- Monthly cashflow
- —
- DSCR
- —
- Eligible?
- —
Short-term bridge; refi at stabilization.
Rent comps 15 comps
| Address | Beds | Baths | Sqft | Rent | $/sqft | DOM | Units | Dist |
|---|---|---|---|---|---|---|---|---|
| 5106 Harbor Blvd Columbus, OH | 3.0 | 1.0 | 936 | $1,600 | $1.71 | 14d | 1 | 0.41mi |
| 5400 Cove Ave Columbus, OH | 4.0 | 1.0 | 912 | $1,450 | $1.59 | 43d | 1 | 0.64mi |
| 5399 Inlet Dr Unit 1 Columbus, OH | 4.0 | 1.0 | 1350 | $1,850 | $1.37 | 43d | 1 | 0.65mi |
| 4100 Lakeview Xing Groveport, OH | 1.0–3.0 | 1.0–2.0 | 953 | $1,975 | $2.07 | 1d | 1 | 0.67mi |
| 4261 Hamilton Square Blvd Groveport, OH | 1.0–3.0 | 1.0–2.0 | 1106 | $1,839 | $1.66 | 1d | 17 | 0.77mi |
| 3417 Beachworth Dr Unit 3417B Columbus, OH | 2.0 | 1.5 | 900 | $1,200 | $1.33 | 17d | 1 | 0.84mi |
| 3400 Beachworth Dr Unit 3402 Columbus, OH | 3.0 | 1.5 | 1200 | $1,500 | $1.25 | 43d | 1 | 0.84mi |
| 3995 Cracker Cove Ln Canal Winchester, OH | 1.0–2.0 | 1.0–2.0 | 914 | $1,485 | $1.62 | 2d | 13 | 0.85mi |
| 4535 Reinbeau Dr Unit 4533 Columbus, OH | 3.0 | 1.5 | 1200 | $1,500 | $1.25 | 43d | 1 | 0.86mi |
| 3399 Beachworth Dr Unit B Columbus, OH | 2.0 | 1.5 | 942 | $1,100 | $1.17 | 17d | 1 | 0.86mi |
| 3995 S Hamilton Rd Groveport, OH | 1.0–3.0 | 1.0–2.0 | 953 | $1,829 | $1.92 | 1d | 30 | 0.93mi |
| 5151 Ebright Rd Canal Winchester, OH | 1.0–3.0 | 1.0–2.0 | 984 | $1,914 | $1.94 | 1d | 214 | 1.15mi |
| 5293 Tuxworth Dr Columbus, OH | 3.0 | 1.0 | 1164 | $1,935 | $1.66 | 43d | 1 | 1.31mi |
| 5020 Chatterton Rd Columbus, OH | 1.0–2.0 | 1.0 | 674 | $1,163 | $1.73 | 1d | 6 | 1.36mi |
| 4082 Platte Ave Groveport, OH | 3.0 | 1.0 | 1230 | $1,890 | $1.54 | 23d | 1 | 1.39mi |
Listing history 3 events
-
2026-06-08status $149,900 Pending 2 DOM
-
2026-06-07remarks 402-char remark
-
2026-06-07$149,900 Active 2 DOM
ⓘ Source: listings_history table (triggers on properties + properties_extension) + one-shot
backfill from property_details.listing_events for pre-trigger history.
Tax reassessment forecast OH · Partial reset (capped growth)
- Current annual tax
- $2,805 · $234/mo
- Projected year-2 tax
- $2,805 · $234/mo
- Expected delta
- $0/yr ($0/mo · 0.0%)
ⓘ Screening estimate from a state-policy table — verify with the county assessor before closing.
Climate risk First Street
- Flood 3/10 Moderate FEMA zone X (unshaded) · 17% chance over 30 yrs
- Wildfire 1/10 Low
- Heat 4/10 Moderate 7 d/yr ≥99°F today · 18 d/yr by 30 yrs out
- Wind 2/10 Low 100% chance of damaging wind over 30 yrs
- Air quality 2/10 Low 1 unhealthy d/yr today · 1 by 30 yrs out
Nearby sold comps map
Loading sold comps map…
Walkable amenities ~0.75 mi
Loading nearby amenities…
Taxation est. · year 1
- Rental income
- $19,831
- − Mortgage interest
- −$8,397
- − Property taxes
- −$2,805
- − Insurance
- −$750
- − Repairs & maintenance
- −$1,586
- − Management
- −$1,586
- − Depreciation
- −$4,361
- Taxable income
- $345
- Est. tax owed @ 24.0%
- −$83
- After-tax cash flow
- $2,595/yr
For passive investors: Depreciation is non-cash, so a rental often shows a tax loss while cash-flowing — sheltering income. Rental losses are passive: they offset passive income freely, and up to $25,000/yr can offset ordinary (W-2) income if you actively participate and your MAGI is under $100k (phasing out to $0 by $150k); unused losses carry forward. On sale, claimed depreciation is recaptured at up to 25%, and gains may owe capital-gains tax (a 1031 exchange can defer both). Figures are a year-1 estimate at your 24.0% rate — not tax advice; consult a CPA.
Schools (NCES district)
- District
- Groveport Madison Local
- NCES district ID
- 3904697
- Math proficiency
- 23% ▼ -25.00%
- Reading proficiency
- 38% ▼ -16.00%
- Median HH income
- $49,549
- Composite
- 26.52/100
- National rank
- #7200
- State rank
- #573 of 656 in OH
Livability — Blacklick Estates
- Score
- 73/100
- State rank
- #314
- US rank
- #5082
Category grades
Schools grade is shown separately in the Schools card above.
Census & demographics
- Census place
- Blacklick Estates, OH
- County
- Franklin County · 1,351,780 people
- Metro
- Columbus, OH
- Population (ZIP)
- 47,364
- Household income
- $51,417
- Rent vs Own
- Severe rent burden
- 2584.0
Population outlook (Franklin County) Hauer SSP2
- Today (2025)
- 1,456,139 people
- By 2030
- 1,556,890 · +6.9%
- By 2040
- 1,757,349 · +20.7%
- By 2050
- 1,950,539 · +34.0%
- By 2075
- 2,376,171 · +63.2%
- By 2100
- 2,636,796 · +81.1%
Race, ethnicity, and origin ACS 2023
- Neighborhood character
- Diverse neighborhood (Simpson 0.58)
- Race & ethnicity
- Black 58% White 26% Hispanic / Latino 8% Two or more races 7% Asian 1%
- Hispanic origin (detail)
- Mexican 2% Puerto Rican 1% Dominican 1%
- Common ancestry
- Swiss 1% Slovak 1% Italian 1%
- Foreign-born
- 13% · Canada, China
- Languages at home
- 86% English-only · Spanish 6% French/Haitian/Cajun 1%
Political lean MEDSL · Franklin
- 2024 margin
- Strong D (+28.4) · D 63.7% · R 35.3% · Other 1.0%
- 2008→2024 swing
- +7.7pp toward D · 2008: 20.7pp · 2024: 28.4pp
- All cycles
- 2024: D+28.4 2020: D+31.4 2016: D+25.9 2012: D+21.7 2008: D+20.7
Not yet ingested
- Civics
- —
Market trends
- HPI YoY
- ▼ -203.49%
- Current HPI
- 249.3708
- Rent YoY
- ▲ 2.36%
- Metro
- Columbus, OH
- State GDP YoY
- ▲ 1.98%
- F500 in state
- 48
Industry mix (Fortune 500 HQ in OH)
| Industry | F500 HQs | Revenue |
|---|---|---|
| Insurance | 3 | $145B |
|
||
| Industrial Machinery | 3 | $49B |
|
||
| Financial Services | 3 | $24B |
|
||
| Consumer Goods | 2 | $93B |
|
||
| Aerospace / Defense | 2 | $47B |
|
||
| Utilities | 2 | $33B |
|
||
Price history
+130.6% since first listed18 events — show timeline
- 2026-06-05 Listed $149,900 CBRMLS
- 2026-06-04 Coming Soon $149,900 CBRMLS
- 2025-11-30 Relisted — CBRMLS
- 2025-11-29 Listing Removed — CBRMLS
- 2025-11-16 Contingent — CBRMLS
- 2025-11-13 Price Changed $149,899 CBRMLS
- 2025-11-08 Listed $149,900 CBRMLS
- 2025-11-06 Coming Soon — CBRMLS
- 2019-05-31 Sold (Public Records) $65,000 Public Records
- 2019-05-30 Sold (MLS) $65,000 CBRMLS
- 2019-05-03 Contingent — CBRMLS
- 2019-04-29 Listed $99,900 CBRMLS
- 2003-09-12 Sold (Public Records) $65,000 Public Records
- 1995-09-26 Sold (Public Records) $58,000 Public Records
- 1995-09-26 Sold (Public Records) $58,000 Public Records
- 1995-09-22 Sold (MLS) $58,000 CBRMLS
- 1995-06-09 Listing Removed — CBRMLS
- 1995-04-11 Listed $65,000 CBRMLS
Property tax history
+4.0%/yrLatest (2024): $2,805 · +0.7% YoY. Source: county tax records.
Cash-flow waterfall
monthlySold comps — $/sqft
last 12 mo · ≤1 miLoading sold comps…