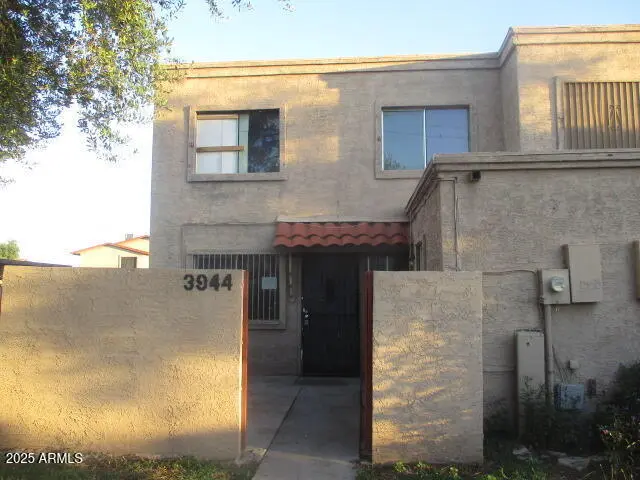
3944 W Camelback Rd · Phoenix, AZ
Flood risk 1/10 · Minimal
- FEMA flood zone
- X (shaded)
- Chance of flooding over 30 yrs
- 0.0%
- Est. flood insurance / yr
- $507 – $1,088
Fire risk 1/10 · Minimal
- Est. fire insurance / yr
- $610 – $1,132
Heat risk 9/10 · Severe
- Hot days now (above 112°F)
- 6 days/yr
- Hot days in 30 yrs
- 16 days/yr
Wind risk 1/10 · Minimal
- Chance of severe wind over 30 yrs
- —
Air-quality risk 3/10 · Minor
- Unhealthy air days now
- 3 days/yr
- Unhealthy air days in 30 yrs
- 3 days/yr
Risk factors via First Street. Map © Google.
Why this score? — see what drove the C+ grade
The composite is a weighted blend of 9 inputs, each scored 0–100. Each bar is that input's sub-score; the figure is the points it added to the 100-point composite (weight × sub-score).
- Cash flow +22.2/30.0
- ARV discount +15.0/15.0
- DSCR +7.1/10.0
- 1% rule +6.1/10.0
- Livability +3.8/5.0
- Rent growth +2.5/5.0
- Condition / age +2.5/5.0
- Schools +1.1/10.0
- Appreciation +0.0/10.0
$117,500
🖨 Deal sheet 📄 Offer letter ✓ Due diligence
Listing remarks
Investor Special! This property at 3944 W Camelback Rd presents a rare value-add opportunity. The home needs repairs and updating but offers excellent potential for the right buyer. Conveniently located near I-17 and route 60, providing quick access to Downtown Phoenix, major employers, and amenities. Perfect for investors or cash buyers looking to renovate and capture strong equity growth. Don't miss this opportunity!
Key facts
- Near route 60
- Strong equity growth
- Near i-17
Tags
Neighborhood map
What this means for you Summary
Snapshot
- This is a 2-bed/1.0-bath townhouse listed at $118k.
Deal economics
- At list price, monthly cash flow is $192 ($2k/yr) — positive.
- The deal already cash-flows at list — no discount required.
- Meets the 1% rule at list price ($1k rent vs $118k).
- Cap rate 8.3% vs local median 3.3% in Phoenix — top-decile yield for the area; either an underpriced asset or a hidden risk that comps aren't pricing in. Stress-test before assuming the spread holds.
Location & tenants
- Location reads 75/100 on livability (#16 in AZ, #3,924 nationally) — a middle-class / working-renter tenant base. Strengths: amenities A+, commute A+, housing A+; Watch: health & safety C-, crime F.
- Phoenix Union High School District (4286) (urban): math 10% / reading 15% proficiency, ranked #224 of 249 in AZ (top 90%) — low school quality limits family demand, transient renter base, plan for 1-2y turnover.
- Zoned schools: Alhambra High School (math 8% / reading 17%, grade F, #281 of 381 statewide, top 75%, 2,282 students, 86% FRL).
- Market conditions: 79 active listings in the ZIP; 27 comparable units currently listed for rent nearby; rentals leasing fast (median 2d on market — plan ~1-2 weeks tenant-placement turnaround); 36,011 units permitted in Maricopa County in 2024 (12,801 in 5+ unit buildings).
Forward outlook
- Local home prices are declining (-3.0%/yr); year-one equity from $812 of loan paydown is wiped out by about $4k of value loss. Plan a longer hold.
- Maricopa County population projected at +38% by 2050 — long-run rental-demand tailwind backs the buy-and-hold thesis.
Negotiation context
- Only 7 days on market — expect competitive offers; lowballing is unlikely to land.
- 7 sale attempts since 4y ago with the ask held roughly flat each time — persistent listings suggest the price (not the market) is what's stuck; bring a comps-based counter.
Risks & watch-outs
- Climate carrying-cost: extreme-heat days projected 6→16/yr by 2055 (HVAC capex compounding) — expect insurance premiums to compound above CPI over the hold.
Questions for the listing agent
- Built in 1972 — when were the roof, HVAC, electrical panel, plumbing, and water heater last replaced?
- What does the HOA fee cover, when was the last increase, and are there any pending special assessments or reserve-fund shortfalls?
- Is there a deadline driving the sale (1031 exchange, divorce, estate, relocation)? That informs how much negotiation room exists.
- Crime grade is F in this area — have there been break-ins, vandalism, or insurance claims at this property in the last 3 years? What carrier currently insures it and at what premium?
- What's the average days-on-market for RENTAL listings here right now (not sales)? A rising rental-DOM trend means longer vacancies and softer asking-rent achievability than the comps imply.
- What's the recent tenant-quality profile in this submarket — average credit score on applications, eviction rate, late-payment / NSF rate, and stable-employment percentage? A property-management company in the area should have these aggregated.
- How much new for-sale + rental construction is in the pipeline within 1–3 miles? Heavy new supply typically softens prices + rents 12–24 months out; constrained supply supports both.
Investment metrics
- 1% rule
- 1.11% ✓
- Cap rate
- 8.26%
- Cash-on-cash
- 7.01%
- DSCR
- 1.31
- GRM
- 7.5
CMA / ARV
- ARV (on-the-fly)
- $182,952
- Comps found
- 12
Show comp detail 12 sales within ~0.75 mi
| Address | Dist | Beds/Ba | Sqft | Sold | Price | $/sf | Match |
|---|---|---|---|---|---|---|---|
| 3944 W Camelback Rd | 0.00mi | 2/1.0 | 924 (0%) | 0mo | $112,500 | $122 | 100 |
| 5039 N 40th Ave | 0.09mi | 2/1.0 | 924 (0%) | 4mo | $220,000 | $238 | 92 |
| 4035 W Reade Ave | 0.12mi | 2/1.0 | 924 (0%) | 3mo | $166,000 | $180 | 92 |
| 5202 N 42nd Ln | 0.36mi | 2/1.5 | 924 (0%) | 2mo | $159,000 | $172 | 80 |
| 4107 W Wonderview Rd | 0.20mi | 3/1.0 (+1) | 1,005 (+9%) | 4mo | $212,000 | $211 | 68 |
| 4041 W Reade Ave | 0.13mi | 2/1.5 | 1,005 (+9%) | 13mo | $215,000 | $214 | 66 |
| 4023 W Mesquite Ln | 0.11mi | 3/1.0 (+1) | 1,005 (+9%) | 12mo | $230,000 | $229 | 65 |
| 5203 N 42nd Dr | 0.37mi | 2/1.0 | 1,005 (+9%) | 4mo | $194,000 | $193 | 65 |
| 4043 W Palomino Rd | 0.12mi | 3/1.0 (+1) | 1,005 (+9%) | 13mo | $220,000 | $219 | 64 |
| 5251 N 42nd Ln | 0.39mi | 3/1.0 (+1) | 1,005 (+9%) | 7mo | $192,500 | $192 | 56 |
| 4615 N 39th Ave #16 | 0.41mi | 2/1.5 | 1,026 (+11%) | 10mo | $199,990 | $195 | 52 |
| 5243 N 42nd Ln | 0.38mi | 3/1.5 (+1) | 1,005 (+9%) | 10mo | $199,000 | $198 | 52 |
Match score weights: distance 35% · size 25% · config 20% · recency 20%. Top-matched comps best support the ARV.
Projected returns pro-forma
-3.0% appreciation · 3.0% rent growth · sell at horizon
- IRR
- -5.5%
- Equity multiple
- 0.79×
- Total profit
- $-6,765
- Equity at exit
- $17,520
- IRR
- 4.2%
- Equity multiple
- 1.30×
- Total profit
- $10,020
- Equity at exit
- $10,159
Cash invested: $32,900 (down + closing). Projections, not guarantees.
Landlord ↔ Tenant lean methodology
- Overall (STATE)
- 87 Strongly Landlord-Friendly
- State Arizona
- 87 Strongly Landlord-Friendly · R+3
- County
- — inherits STATE
- City
- — inherits STATE
ZIP-level market 85019
- Home prices YoY
- -19.6%
- Active inventory
- 79
- Price-to-rent
- 7.5×
Monthly cashflow live
- Estimated rent
- $1,308 high interval (Pro) →
- Mortgage (P&I)
- −$616
- Tax from tax record
- −$27 /mo · $322/yr
- Insurance
- −$49
- HOA
- −$149
- Vacancy / Maint / Mgmt
- −$275
- Net cashflow
- $192
Break-even live
UW: 25.0% down · 7.5% · 30yr · 1.5% tax · 5.0% vac · 8.0% maint · 8.0% mgmt
Financing live
Cash to close
- Down payment
- $29,375
- Closing costs
- $3,525
- Reserves months
- —
- Total cash needed
- —
Loan-product check · same deal, 3 products live
Conventional
25% down · 7.5% · 30yr
- Down + closing
- —
- Monthly P&I
- —
- Monthly cashflow
- —
- DSCR
- —
- Eligible?
- —
Personal DTI + credit; lowest rate.
DSCR
20% down · 8.5% · 30yr
- Down + closing
- —
- Monthly P&I
- —
- Monthly cashflow
- —
- DSCR
- —
- Eligible?
- —
No personal income docs; deal must DSCR.
Hard money
10% down · 12.0% · 12mo
- Down + closing
- —
- Monthly P&I
- —
- Monthly cashflow
- —
- DSCR
- —
- Eligible?
- —
Short-term bridge; refi at stabilization.
Rent comps 27 comps
| Address | Beds | Baths | Sqft | Rent | $/sqft | DOM | Units | Dist |
|---|---|---|---|---|---|---|---|---|
| 5041 N 40th Ave Phoenix, AZ | 3.0 | 1.0 | 1005 | $1,195 | $1.19 | 1d | 1 | 0.07mi |
| 5030 N 40th Ave Phoenix, AZ | 2.0 | 1.0 | 924 | $1,100 | $1.19 | 1d | 1 | 0.07mi |
| 5040 N 40th Ave Phoenix, AZ | 2.0 | 1.0 | 924 | $1,195 | $1.29 | 1d | 1 | 0.09mi |
| 4029 W Mesquite Ln Phoenix, AZ | 2.0 | 1.0 | 924 | $1,195 | $1.29 | 22d | 1 | 0.10mi |
| 4056 W Mesquite Ln Phoenix, AZ | 3.0 | 1.5 | 1005 | $1,500 | $1.49 | 1d | 1 | 0.16mi |
| 3734 W Camelback Rd Phoenix, AZ | 1.0–2.0 | 1.0 | 725 | $1,249 | $1.72 | 1d | 1 | 0.30mi |
| 4647 N 39th Ave Phoenix, AZ | 1.0–2.0 | 1.0–1.5 | 727 | $1,000 | $1.37 | 1d | 1 | 0.36mi |
| 4540 N 39th Ave Phoenix, AZ | 1.0 | 1.0 | 600 | $1,160 | $1.93 | 15d | 1 | 0.46mi |
| 4540 N 39th Ave Phoenix, AZ | 2.0 | 1.0 | 810 | $1,397 | $1.72 | 1d | 1 | 0.46mi |
| 3839 W Hazelwood St Unit 5 Phoenix, AZ | 2.0 | 1.0 | 995 | $950 | $0.95 | 1d | 1 | 0.49mi |
| 3839 W Hazelwood St Unit 5 Phoenix, AZ | 2.0 | 1.0 | 995 | $1,050 | $1.06 | 24d | 1 | 0.49mi |
| 3807 W Hazelwood St Phoenix, AZ | 3.0 | 2.0 | 1121 | $1,635 | $1.46 | 1d | 1 | 0.51mi |
| 4326 N 35th Ave Phoenix, AZ | 2.0 | 1.0–2.0 | 520 | $1,299 | $2.50 | 1d | 1 | 0.83mi |
| 3450 W Missouri Ave Phoenix, AZ | 1.0 | 1.0 | 560 | $1,002 | $1.79 | 1d | 4 | 0.83mi |
| 4336 N 35th Ave Unit 238 Phoenix, AZ | 2.0 | 2.0 | 822 | $1,099 | $1.34 | 12d | 1 | 0.86mi |
| 4336 N 35th Ave Unit 202 Phoenix, AZ | 2.0 | 2.0 | 822 | $1,099 | $1.34 | 1d | 1 | 0.89mi |
| 4413 W Bethany Home Rd Glendale, AZ | 1.0 | 1.0 | 600 | $1,150 | $1.92 | 1d | 1 | 1.06mi |
| 4441 W Bethany Home Rd Glendale, AZ | 1.0 | 1.0 | 550 | $1,190 | $2.16 | 1d | 21 | 1.09mi |
| 4235 N 35th Ave Phoenix, AZ | 1.0–3.0 | 1.0 | 750 | $1,362 | $1.82 | 1d | 13 | 1.11mi |
| 4201 N 35th Ave Phoenix, AZ | 1.0–2.0 | 1.0 | 588 | $1,399 | $2.38 | 1d | 3 | 1.13mi |
| 4404 W Bethany Home Rd Glendale, AZ | 1.0–2.0 | 1.0 | 665 | $1,370 | $2.06 | 1d | 4 | 1.13mi |
| 3515 W Rovey Ave Unit 3515-01 Phoenix, AZ | 2.0 | 1.0 | 900 | $1,250 | $1.39 | 15d | 1 | 1.17mi |
| 4030 N 44th Ave Phoenix, AZ | 1.0 | 1.0 | 525 | $1,195 | $2.28 | 1d | 16 | 1.24mi |
| 6144 N 35th Dr Phoenix, AZ | 2.0 | 1.0 | 800 | $1,775 | $2.22 | 1d | 1 | 1.30mi |
| 5123 N 28th Dr Unit 5123-06 Phoenix, AZ | 2.0 | 1.0 | 800 | $1,025 | $1.28 | 1d | 1 | 1.46mi |
| 5201 W Camelback Rd Lot FC200 Phoenix, AZ | 2.0 | 1.0 | 672 | $1,400 | $2.08 | 1d | 1 | 1.49mi |
| 4102 W Osborn Rd Phoenix, AZ | 2.0 | 1.0–2.0 | 840 | $1,349 | $1.61 | 1d | 1 | 1.49mi |
HOA detail
- Monthly dues
- $149 · $1,788/yr
Listing history 21 events
-
2026-04-21status Pending
-
2026-04-21status Active
-
2026-04-21status Pending
-
2026-04-14$117,500 Active
-
2025-11-19status Pending
-
2025-11-19historical
-
2025-11-08$117,500 Active
-
2025-08-26price $150,000
-
2025-06-03$180,000 Active
-
2025-05-02status Pending
-
2025-05-02historical
-
2025-03-19$180,000 Active
-
2025-03-19historical
-
2023-01-27soldstatus $160,000 Closed
-
2023-01-27soldstatus $197,500
-
2022-12-31status Pending
-
2022-11-30status Active
-
2022-11-29status Pending
-
2022-10-28$198,500 Active
-
2017-08-11soldstatus $89,000
-
1985-06-04soldstatus $39,000
ⓘ Source: listings_history table (triggers on properties + properties_extension) + one-shot
backfill from property_details.listing_events for pre-trigger history.
Tax reassessment forecast AZ · Resets to sale price
- Current annual tax
- $322 · $27/mo
- Projected year-2 tax
- $776 · $65/mo
- Expected delta
- +$454/yr (+$38/mo · 141.1%)
ⓘ Screening estimate from a state-policy table — verify with the county assessor before closing.
Climate risk First Street
- Flood 1/10 Low FEMA zone X (shaded) · 0% chance over 30 yrs
- Wildfire 1/10 Low
- Heat 9/10 Extreme 6 d/yr ≥112°F today · 16 d/yr by 30 yrs out
- Wind 1/10 Low
- Air quality 3/10 Moderate 3 unhealthy d/yr today · 3 by 30 yrs out
Nearby sold comps map
Loading sold comps map…
Walkable amenities ~0.75 mi
Loading nearby amenities…
Taxation est. · year 1
- Rental income
- $15,693
- − Mortgage interest
- −$6,582
- − Property taxes
- −$322
- − Insurance
- −$588
- − Repairs & maintenance
- −$1,255
- − Management
- −$1,255
- − HOA
- −$1,788
- − Depreciation
- −$3,418
- Taxable income
- $485
- Est. tax owed @ 24.0%
- −$116
- After-tax cash flow
- $2,189/yr
For passive investors: Depreciation is non-cash, so a rental often shows a tax loss while cash-flowing — sheltering income. Rental losses are passive: they offset passive income freely, and up to $25,000/yr can offset ordinary (W-2) income if you actively participate and your MAGI is under $100k (phasing out to $0 by $150k); unused losses carry forward. On sale, claimed depreciation is recaptured at up to 25%, and gains may owe capital-gains tax (a 1031 exchange can defer both). Figures are a year-1 estimate at your 24.0% rate — not tax advice; consult a CPA.
Schools (NCES district)
- District
- Phoenix Union High School District (4286)
- NCES district ID
- 0406330
- Math proficiency
- 10% ▼ -27.00%
- Reading proficiency
- 15% ▼ -18.00%
- Median HH income
- $39,055
- Composite
- 10.63/100
- National rank
- #9773
- State rank
- #224 of 249 in AZ
Livability — Phoenix
- Score
- 75/100
- State rank
- #16
- US rank
- #3924
Category grades
Schools grade is shown separately in the Schools card above.
Census & demographics
- Census place
- Phoenix, AZ
- County
- Maricopa County · 4,537,380 people
- City population
- 1,500,198
- Metro
- Phoenix-Mesa-Chandler, AZ
- Population (ZIP)
- 27,429
- Household income
- $68,528
- Rent vs Own
- Severe rent burden
- 806.0
Population outlook (Maricopa County) Hauer SSP2
- Today (2025)
- 4,979,203 people
- By 2030
- 5,378,229 · +8.0%
- By 2040
- 6,156,598 · +23.6%
- By 2050
- 6,872,376 · +38.0%
- By 2075
- 8,401,270 · +68.7%
- By 2100
- 9,247,439 · +85.7%
Race, ethnicity, and origin ACS 2023
- Neighborhood character
- Predominantly Hispanic (69%)
- Race & ethnicity
- Hispanic / Latino 69% Two or more races 30% White 17% Black 5% Asian 4% Native American 2%
- Hispanic origin (detail)
- Mexican 65% Cuban 1%
- Common ancestry
- Serbian 2% Lithuanian 1% Slovak 1%
- Foreign-born
- 32% · Canada, Philippines, Vietnam
- Languages at home
- 36% English-only · Spanish 56% Other Asian/Pacific 1% Tagalog/Filipino 1%
Political lean MEDSL · Maricopa
- 2024 margin
- Toss-up / Even · D 47.7% · R 51.2% · Other 1.1%
- 2008→2024 swing
- +7.1pp toward D · 2008: -10.6pp · 2024: -3.5pp
- All cycles
- 2024: R+3.5 2020: D+2.2 2016: R+3.5 2012: R+12.0 2008: R+10.6
Not yet ingested
- Civics
- —
Market trends
- HPI YoY
- ▼ -103.54%
- Current HPI
- 424.8412
- Rent YoY
- —
- Metro
- Phoenix-Mesa-Chandler, AZ
- State GDP YoY
- ▲ 4.54%
- F500 in state
- 20
Industry mix (Fortune 500 HQ in AZ)
| Industry | F500 HQs | Revenue |
|---|---|---|
| Technology | 2 | $13B |
|
||
| Mining / Metals | 1 | $23B |
|
||
| Environmental Services | 1 | $16B |
|
||
| Metals / Steel | 1 | $14B |
|
||
| Technology Distribution | 1 | $9B |
|
||
| Homebuilding | 1 | $8B |
|
||
Price history
+201.3% since first listed21 events — show timeline
- 2026-04-21 Pending — ARMLS
- 2026-04-21 Relisted — ARMLS
- 2026-04-21 Pending — ARMLS
- 2026-04-14 Listed $117,500 ARMLS
- 2025-11-19 Pending — ARMLS
- 2025-11-19 Listing Removed — ARMLS
- 2025-11-08 Listed $117,500 ARMLS
- 2025-08-26 Price Changed $150,000 ARMLS
- 2025-06-03 Listed $180,000 ARMLS
- 2025-05-02 Pending — ARMLS
- 2025-05-02 Listing Removed — ARMLS
- 2025-03-19 Listing Removed — ARMLS
- 2025-03-19 Listed $180,000 ARMLS
- 2023-01-27 Sold (Public Records) $197,500 Public Records
- 2023-01-27 Sold (MLS) $160,000 ARMLS
- 2022-12-31 Pending — ARMLS
- 2022-11-30 Relisted — ARMLS
- 2022-11-29 Pending — ARMLS
- 2022-10-28 Listed $198,500 ARMLS
- 2017-08-11 Sold (Public Records) $89,000 Public Records
- 1985-06-04 Sold (Public Records) $39,000 Public Records
Property tax history
-4.9%/yrLatest (2025): $322 · +10.9% YoY. Source: county tax records.
Cash-flow waterfall
monthlySold comps — $/sqft
last 12 mo · ≤1 miLoading sold comps…